This is a chart of the United States of America and it is showing a drought of the entire
country. It shows which places are in a worse drought than others. It is effecting crop growing
throughout the Midwest.
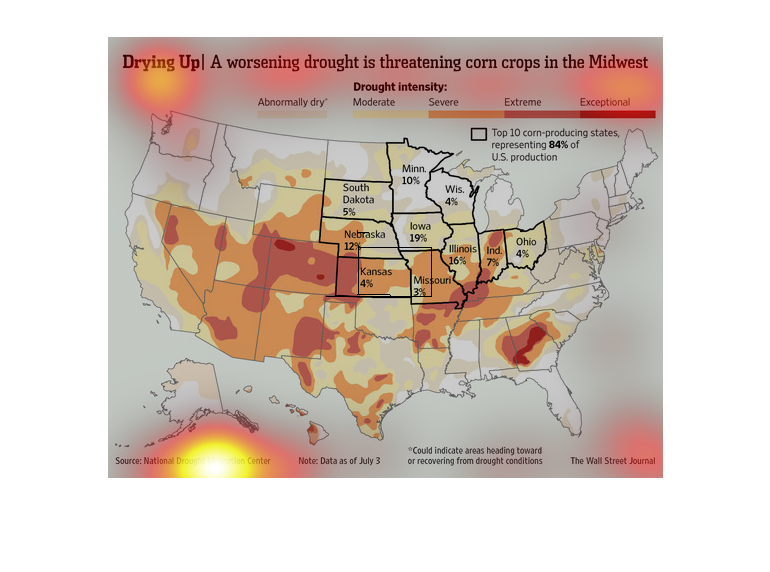
This chart from the Wall Street Journal shows how a devastating drought is affecting corn
production in the midwest of the United States. It is the worst on record
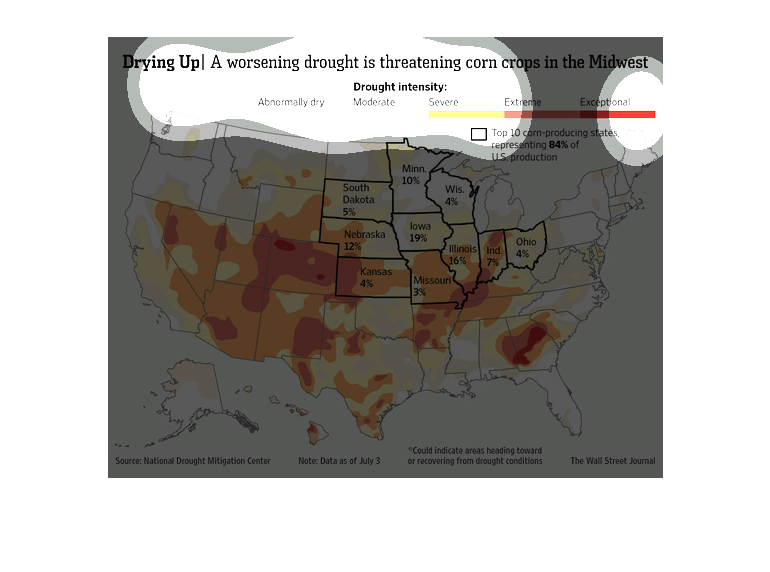
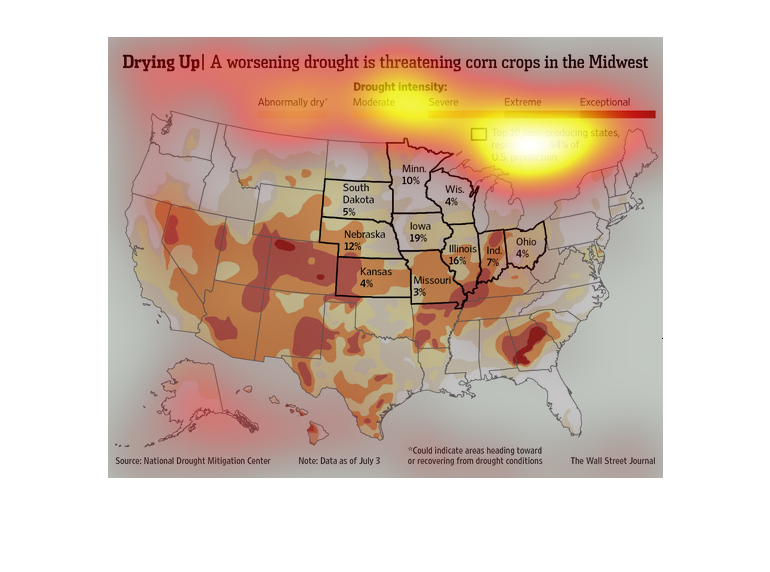
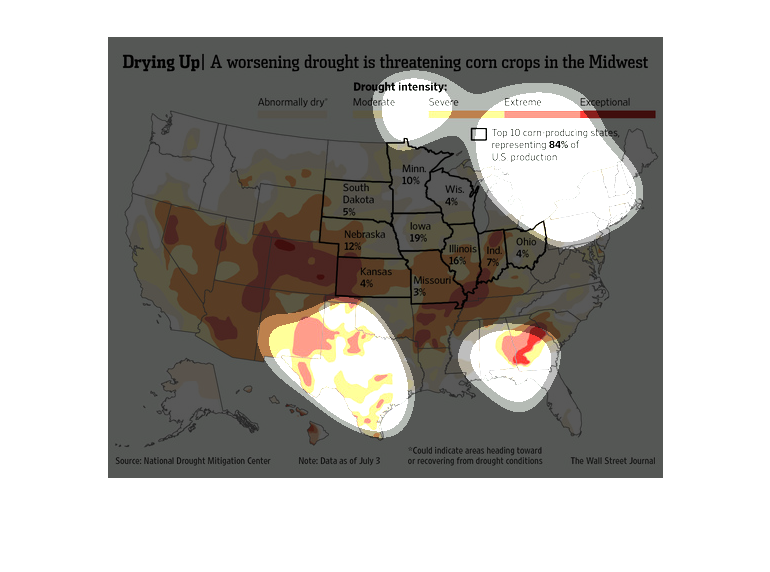
This graph shows the extent and severity of drought and the consequences it has on corn crop
yield on the Midwest United States. Levels of drought range from abnormal to exceptionally
dry.
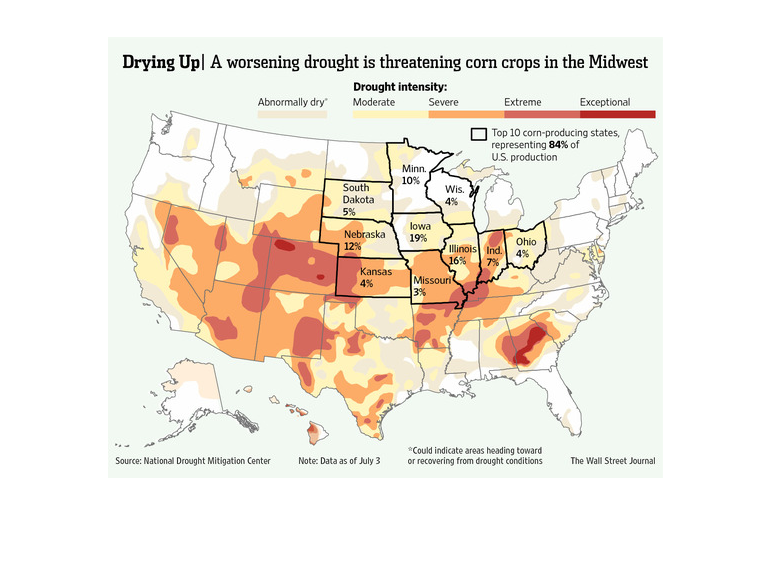
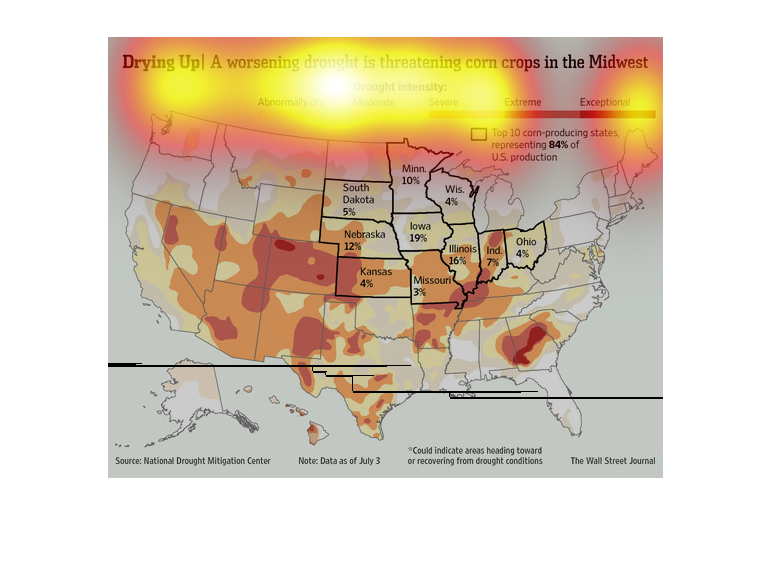
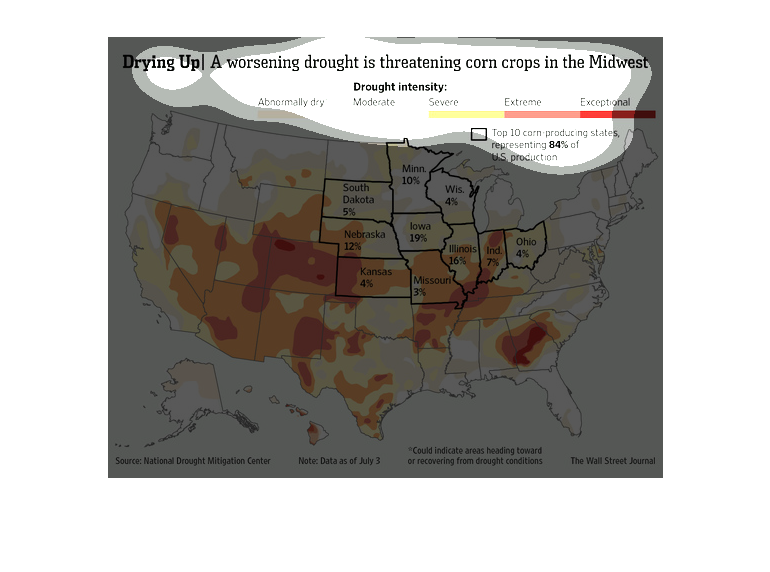
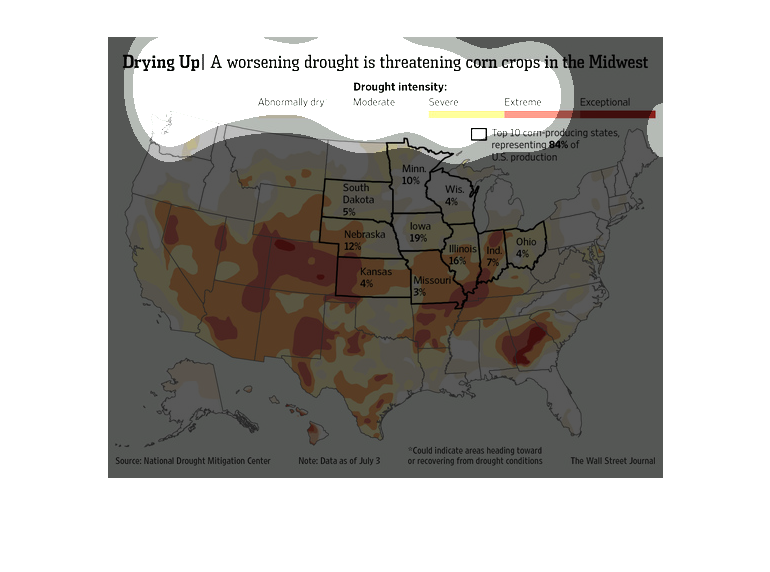
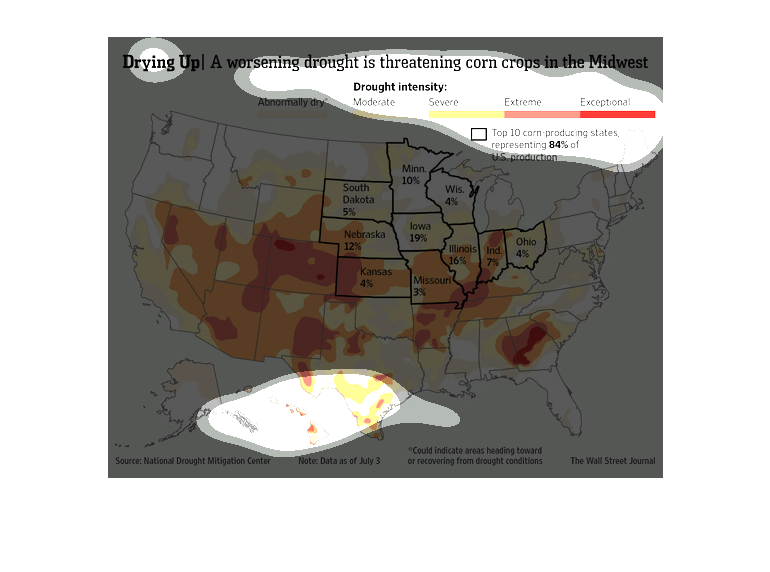
The chart shows drought intensity in the USA midwest for corn crops. Yellow to red denotes
intensity from moderate to extreme. Tan denotes abnormally dry.
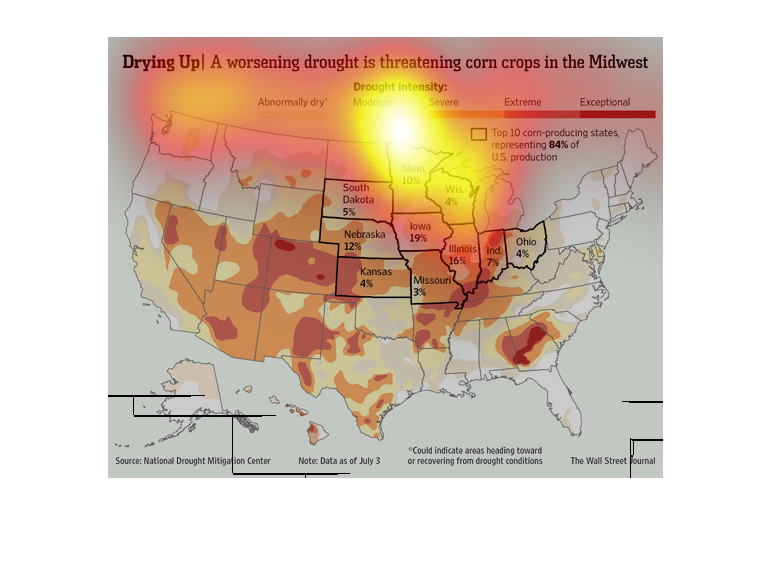
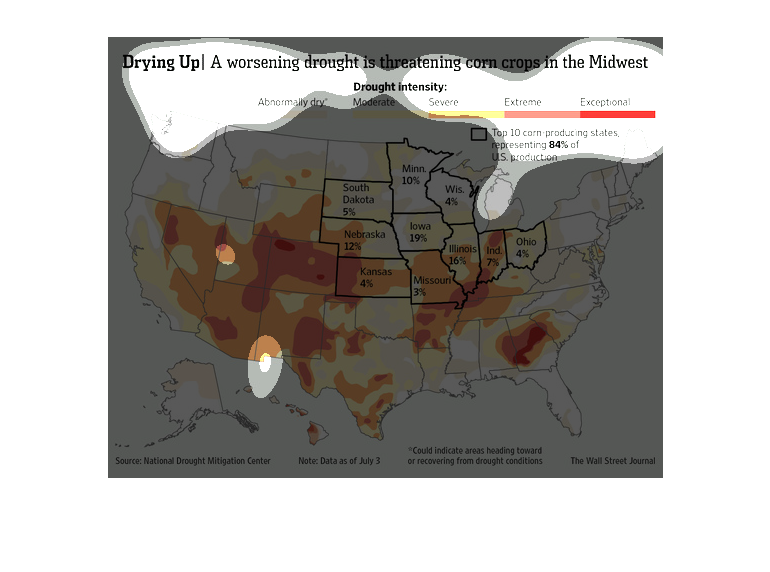
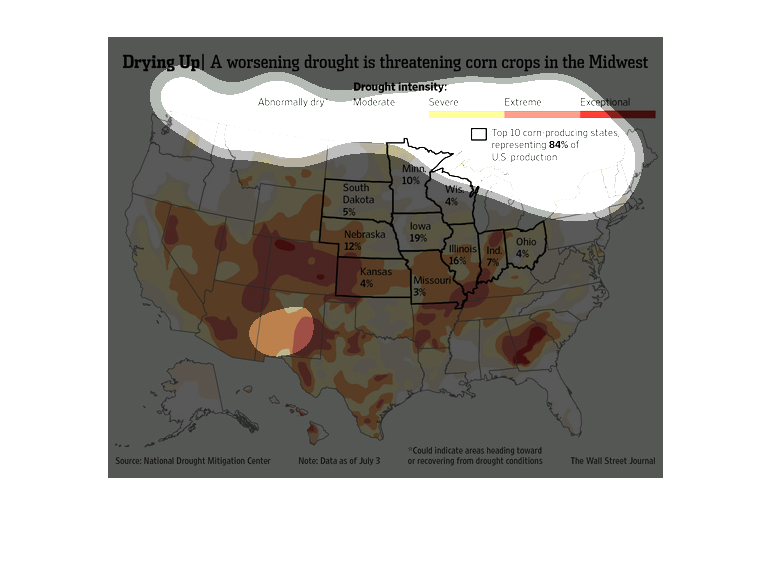
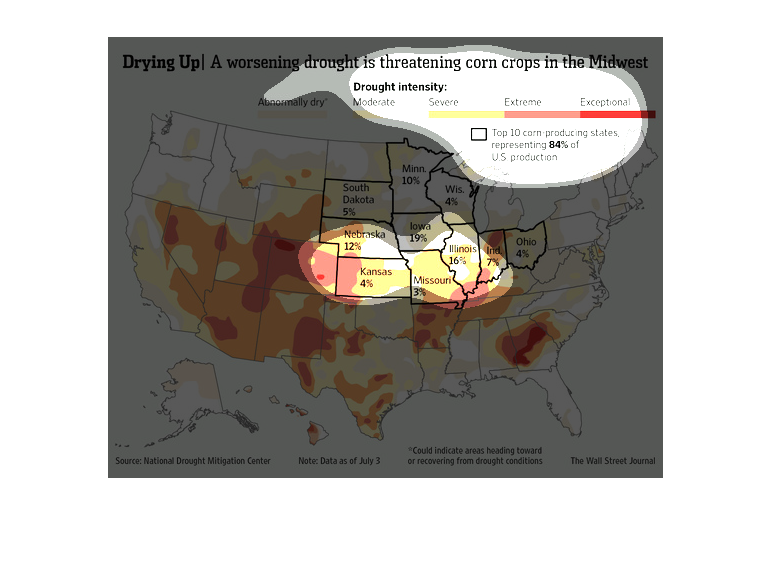
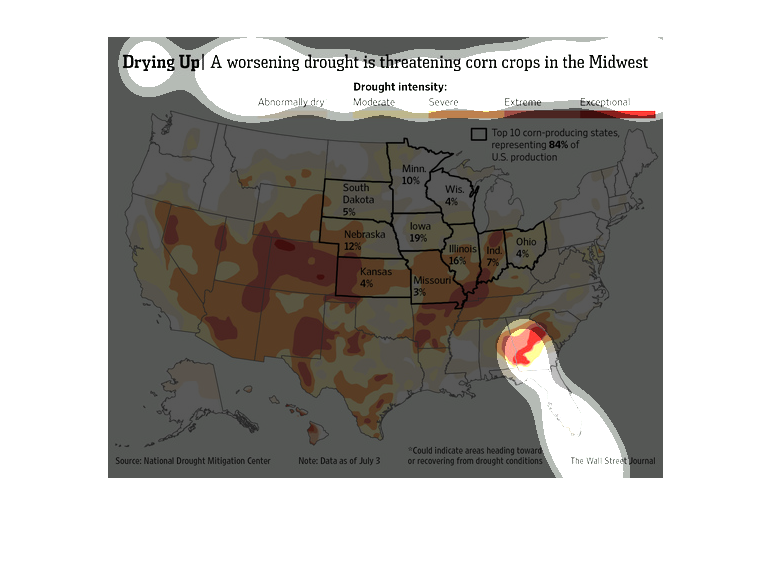
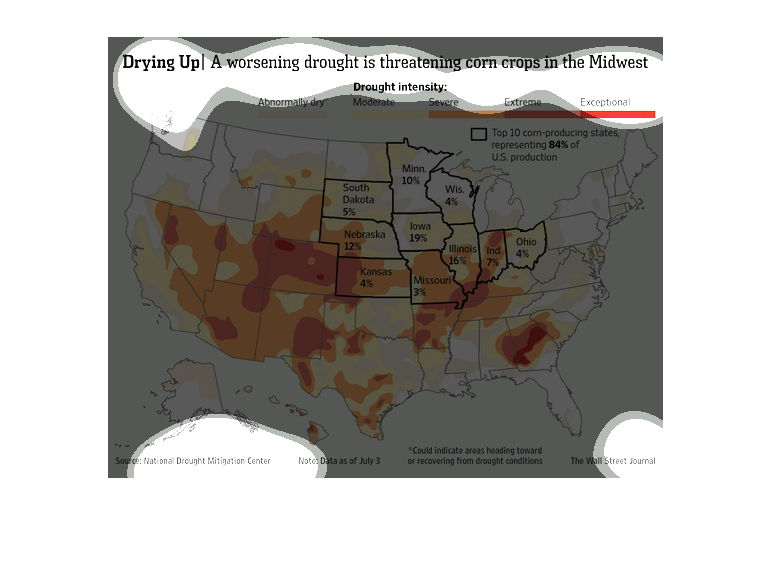
This is a map of drought intensities in the United States. The states outlined with a bold
black are the top 10 corn-producing states that make up 84% of US corn production. The states
are colored in to represent the intensity of the drought are: moderate, severe, extreme, and
exceptional. There are also states that are colored in with a grayish color to represent abnormal
dryness.
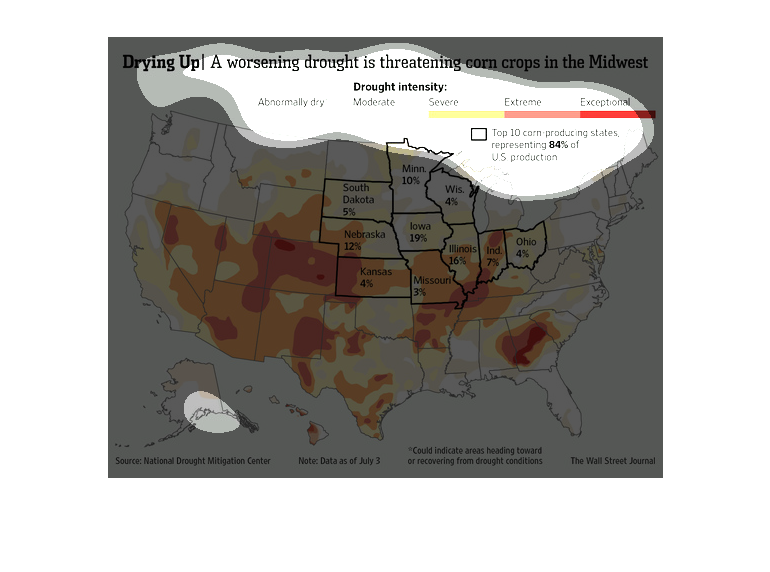
Corn crops in the Midwest are being threatened by a worsening drought. Iowa is at 19% while
Illinois is at 16%, and Nebraska is at 12%. These are in the top 10 corn producing states.
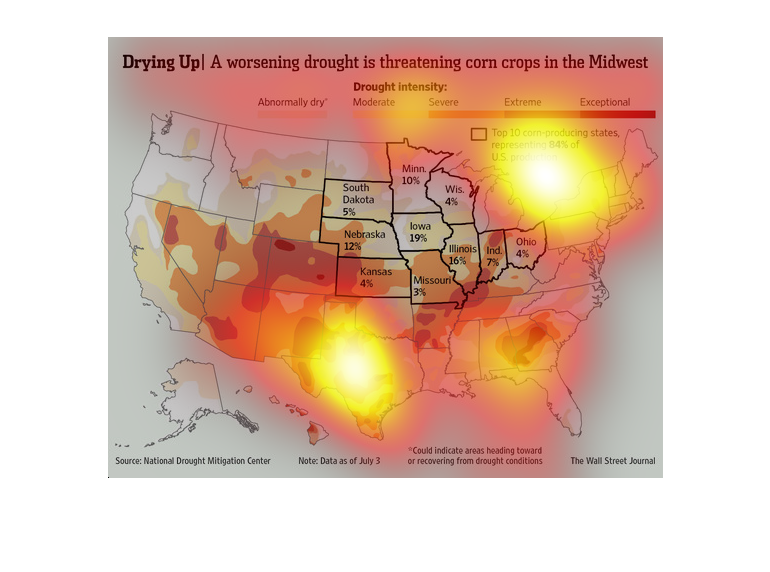
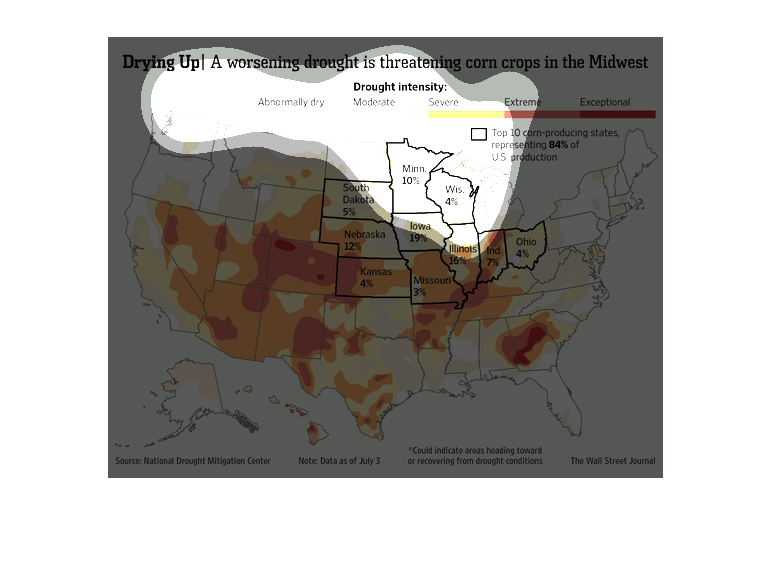
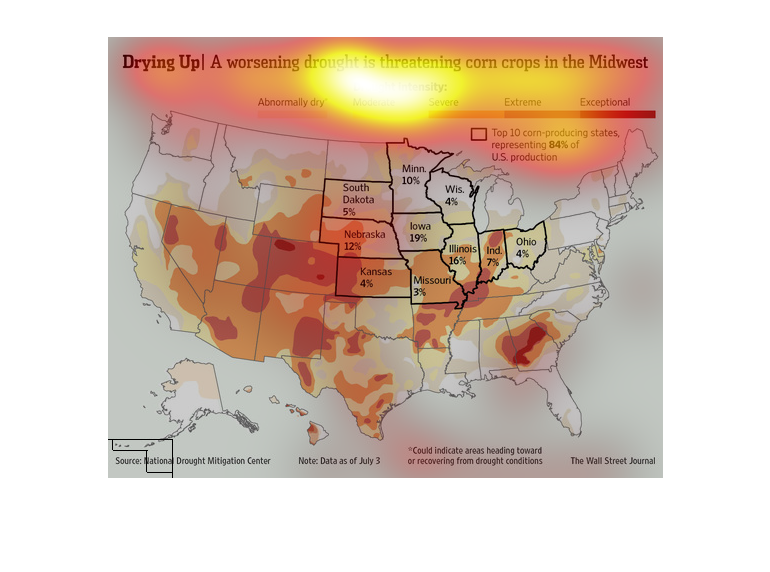
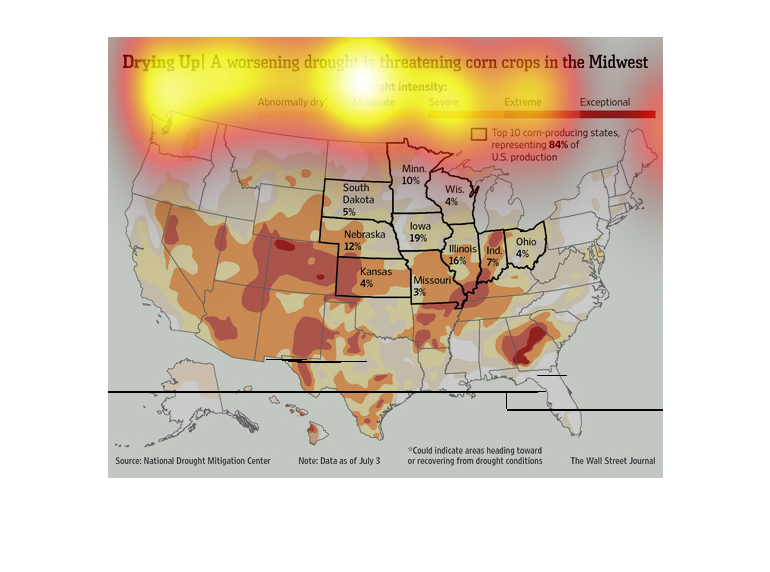
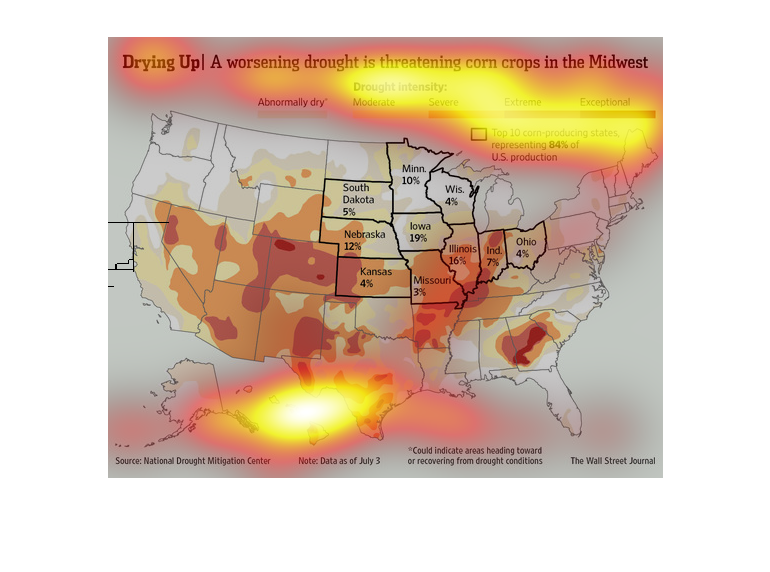
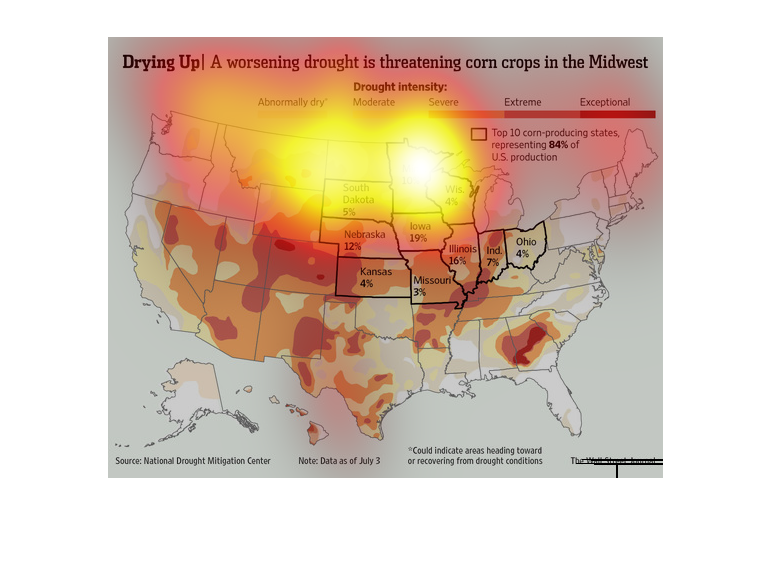
This graph shows a map for the drought conditions in the US and focuses on the states with
the majority of corn crops. Most of the top 10 corn producing states are experiencing areas
of severe to exceptional drought conditions.
This chart from the Wall Street Journal shows how a drought in the United States is affecting
the corn production and reducing overall corn production.
This is a color coded map of the United States with related statistics depicting that a worsening
drought was threatening corn crops in the Midwest at the time.
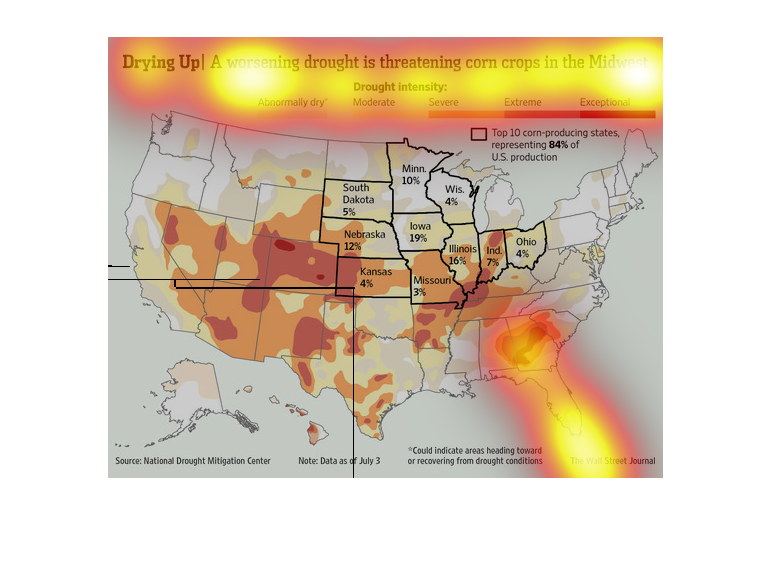
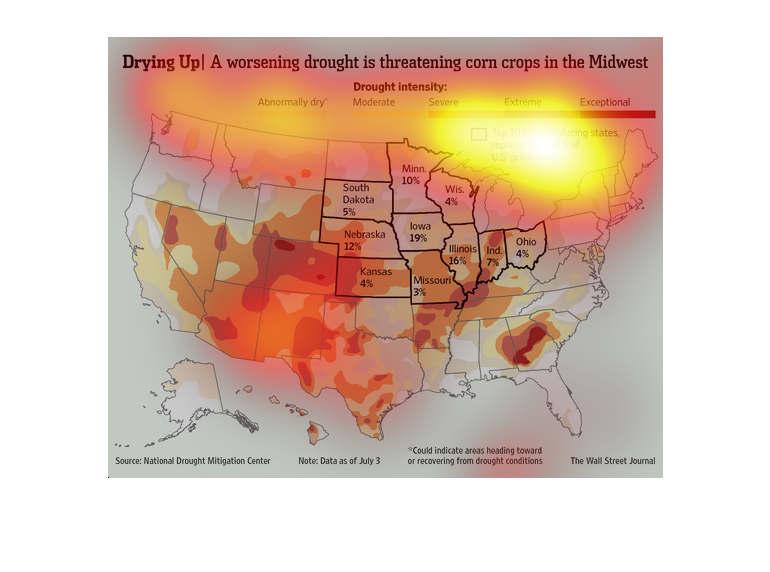
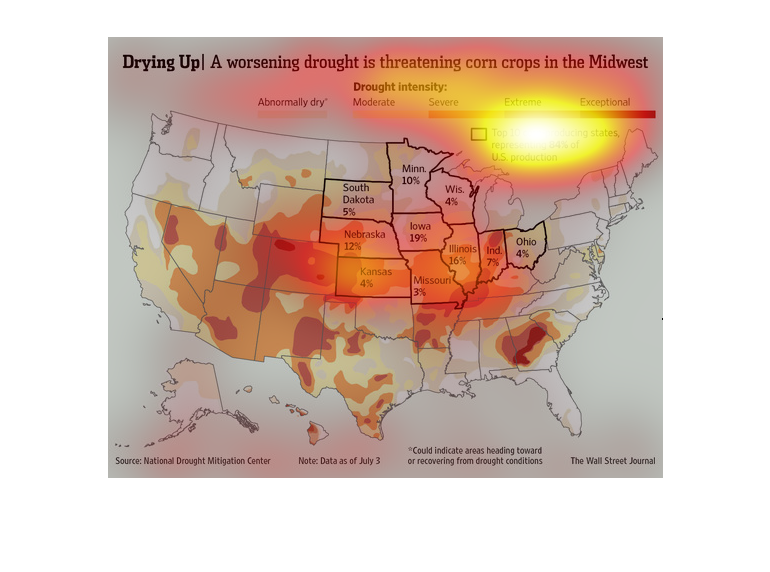
This US map shows the effect of drought on corn producting states. Large swathes of red shading
denote drought extremety, while the top 10 corn producing states are pointed out.
The National Drought Mitigation Center has drafted a report based on the effects the drought
has had on crops and how it will continue to incur losses for all those involved.
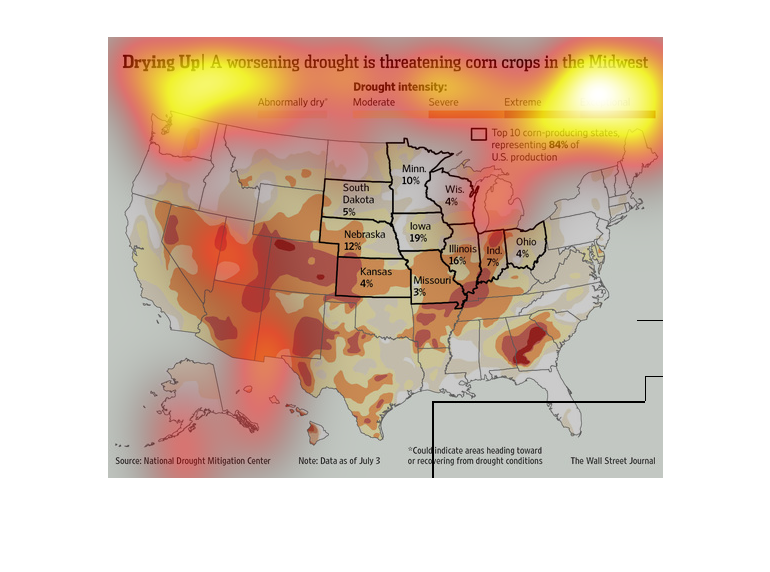
A drought is threatening the corn crops in the Midwest USA. The levels of drought are represented
by varying colors on a scale starting at abnormally dry for a beige color, and ending at red
representing a severe drought.
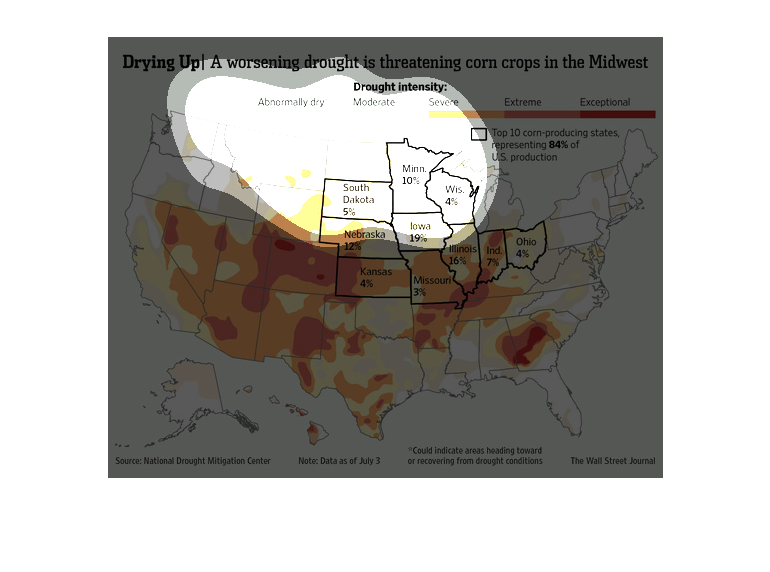
This chart describes drying up. Specifically, a worsening drought is threatening corn crops
in the Midwest. Categories on the chart include moderate and severe.