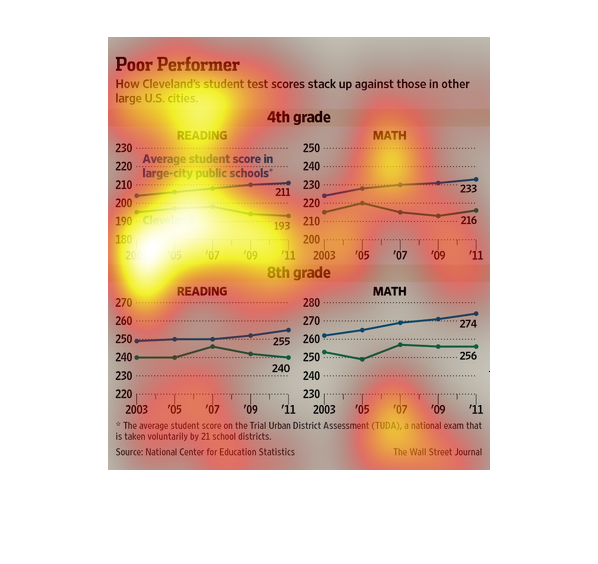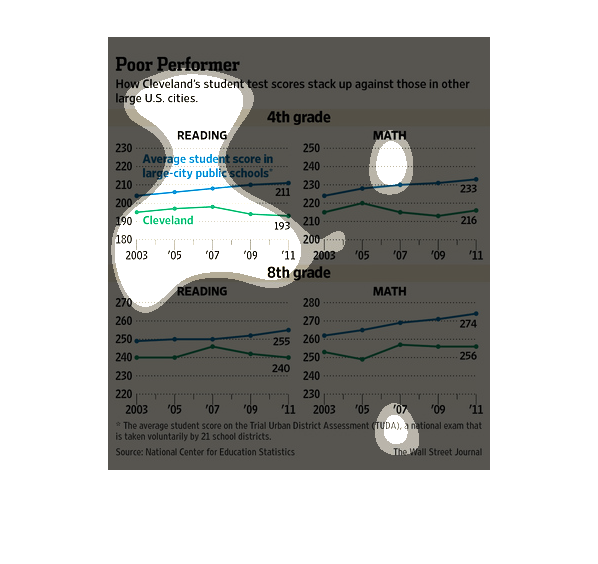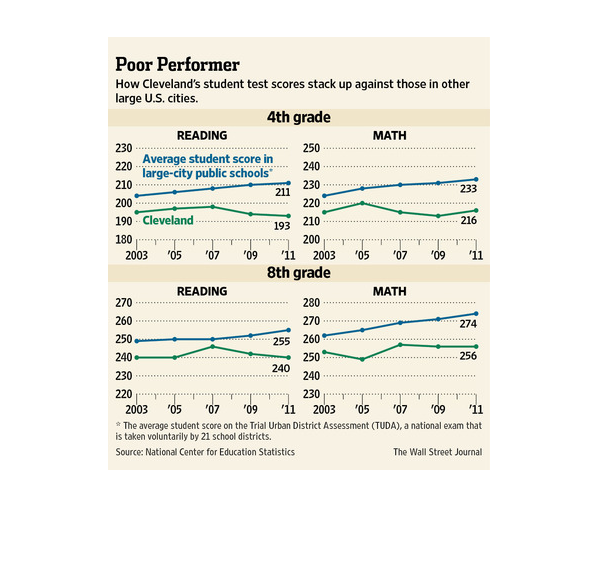
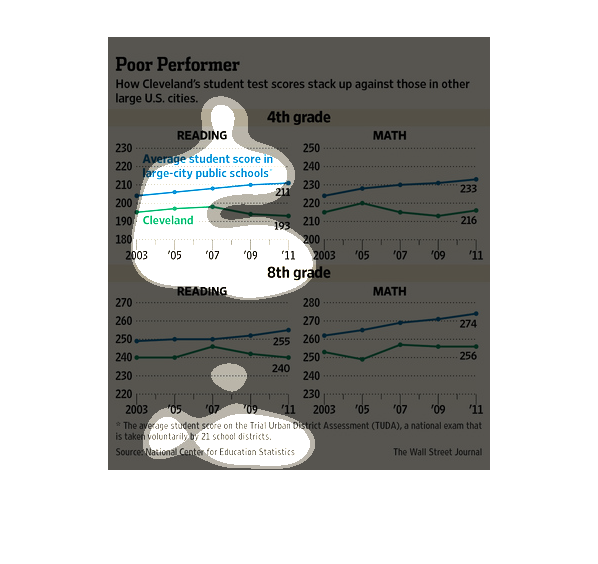
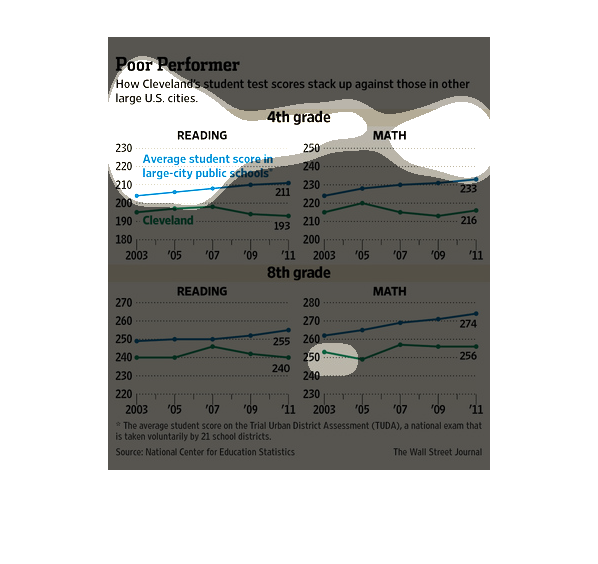
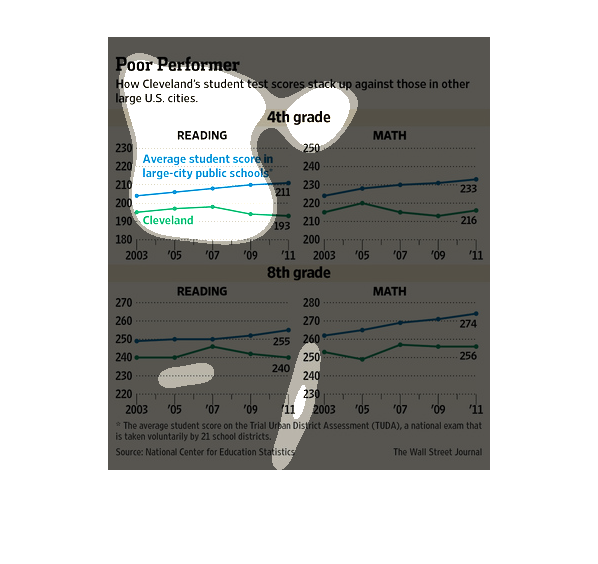
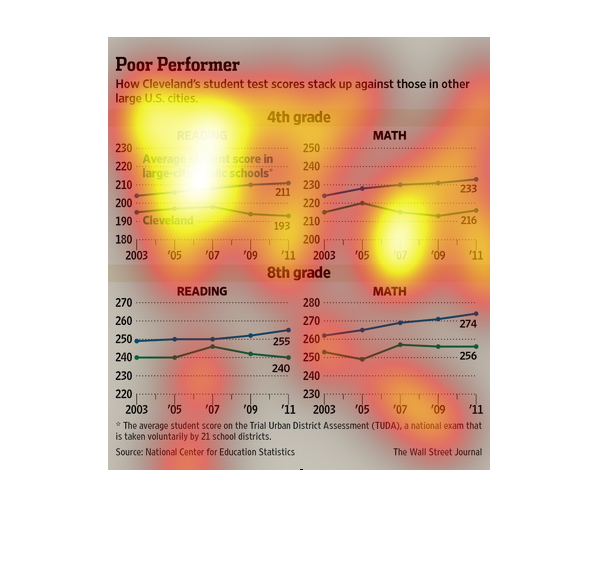
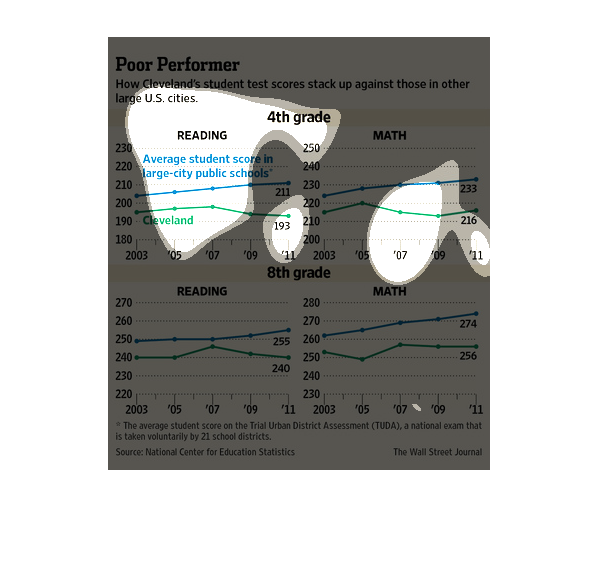
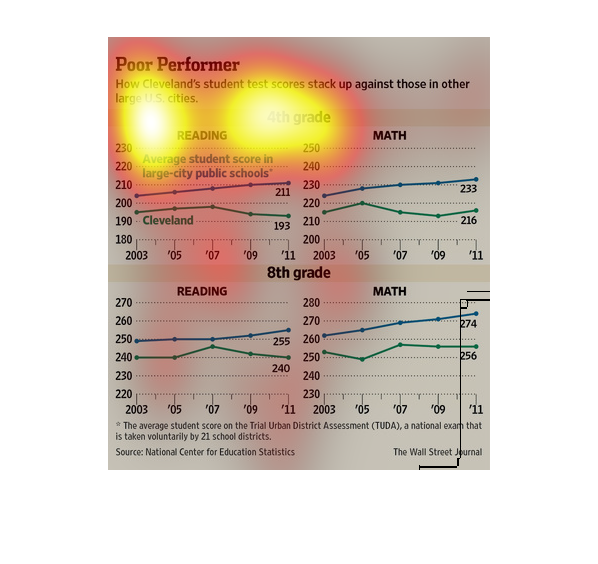
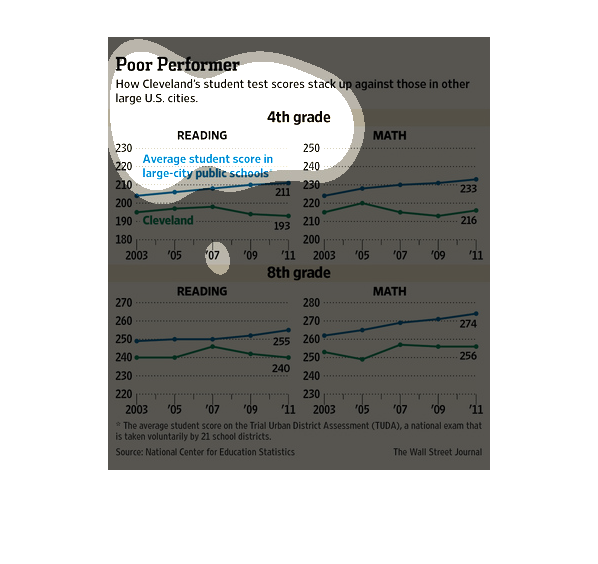
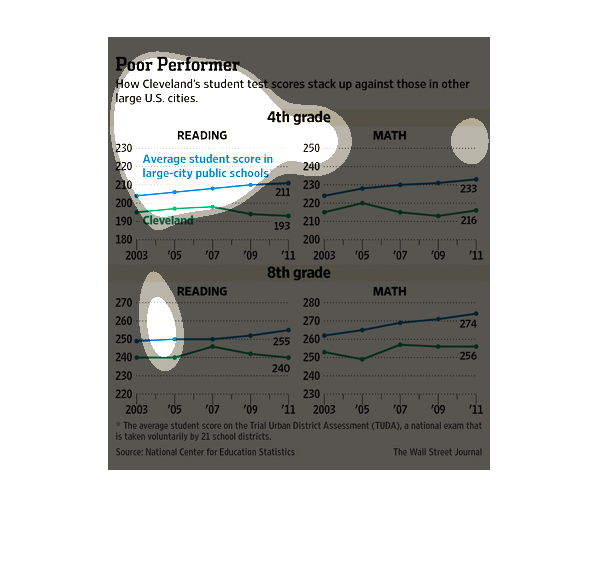
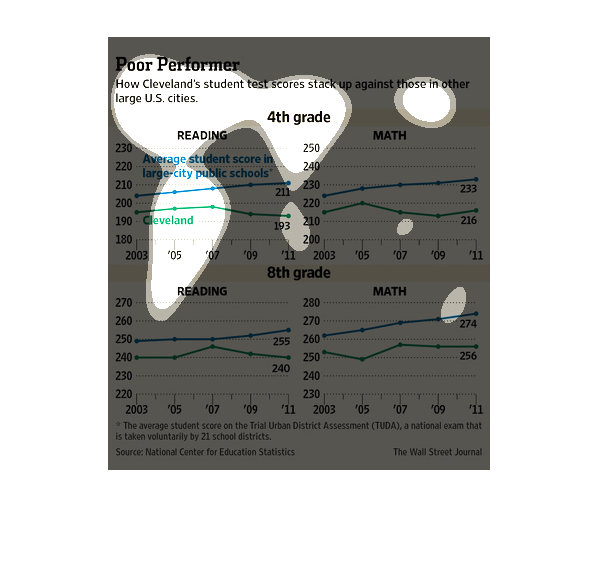
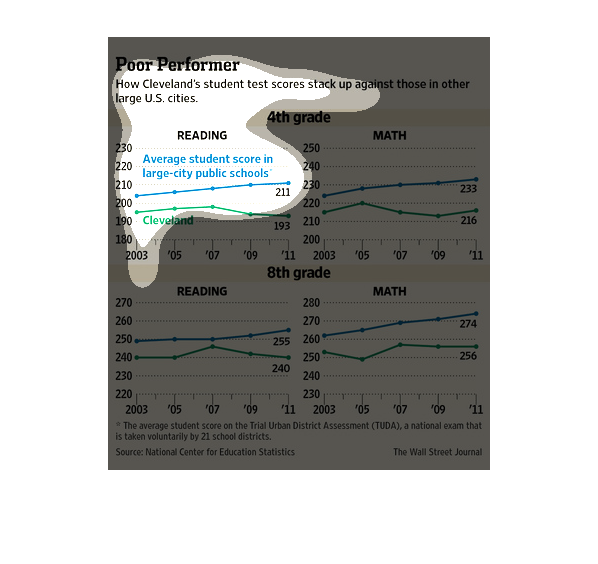
This chart compares math and reading scores of 4th and 8th grade students in Cleveland to
the scores of students in other urban areas. It uses scores from TUDA exams in 21 school districts.
Between 2003 and 2011, Cleveland students always scored lower, and thier scores have generally
worsened.
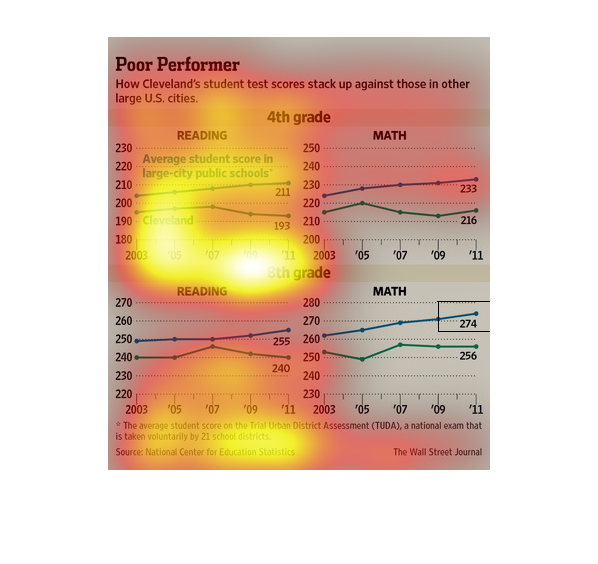
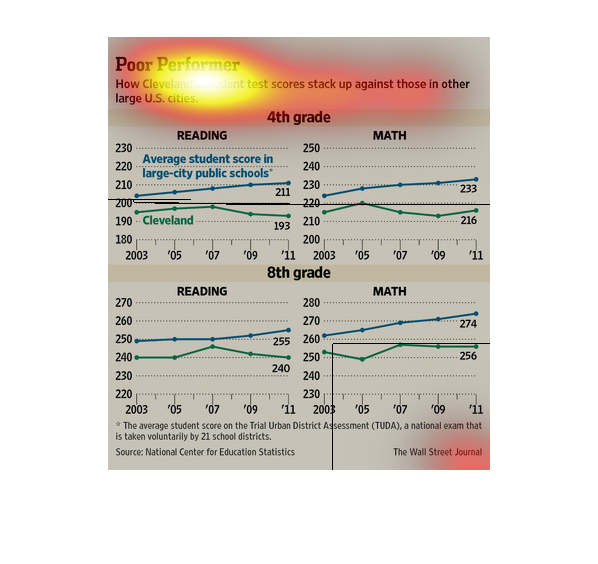
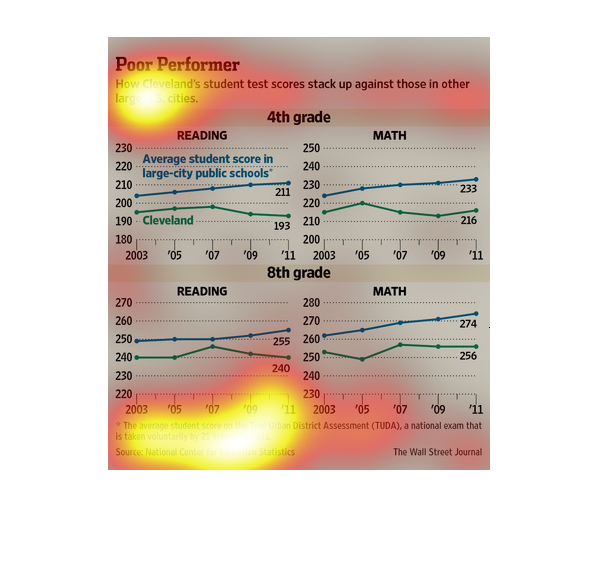
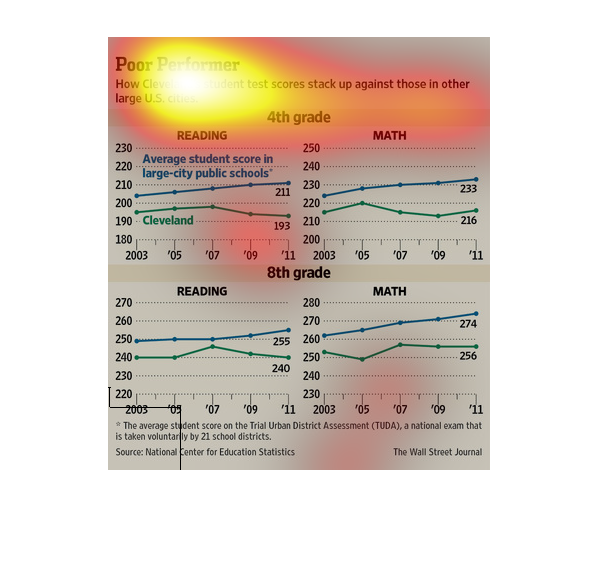
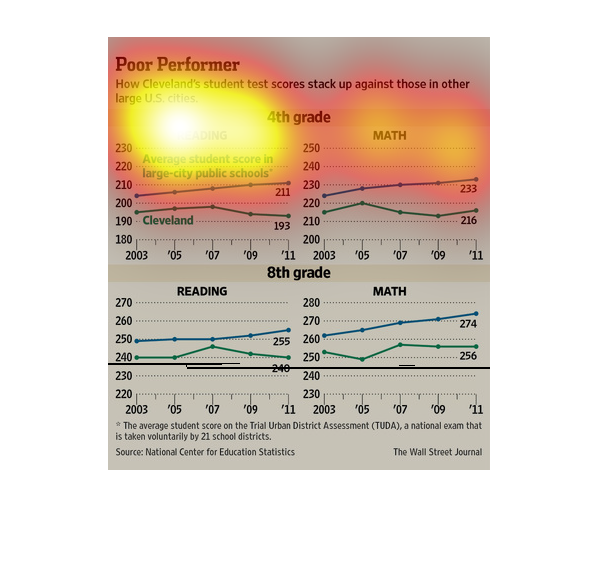
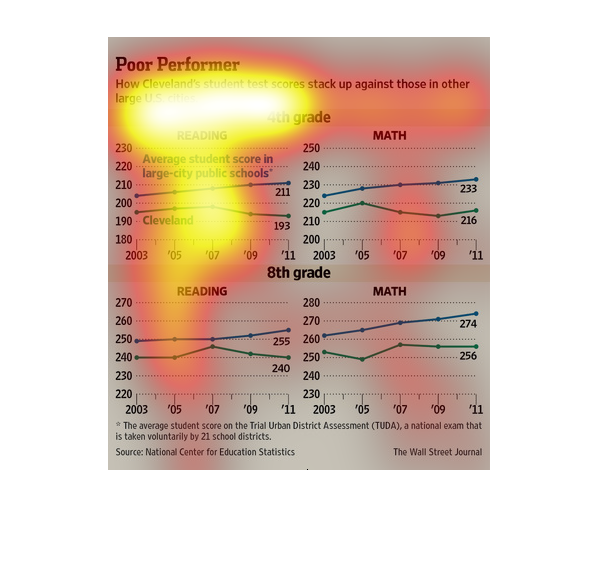
This chart from the Wall Street Journal shows how Cleveland students are underperforming on
standardized tests in the United States and relative to other students
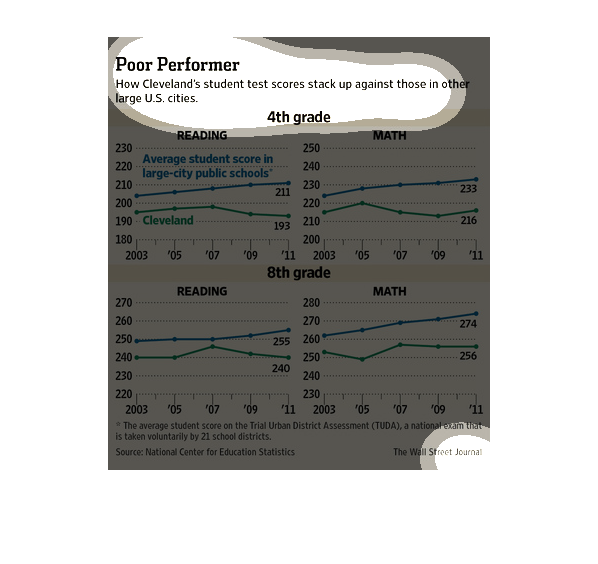
This is a series of color coded charts and related statistics depicting how Cleveland's student
test scores stacked up against those in other large U.S. cities.
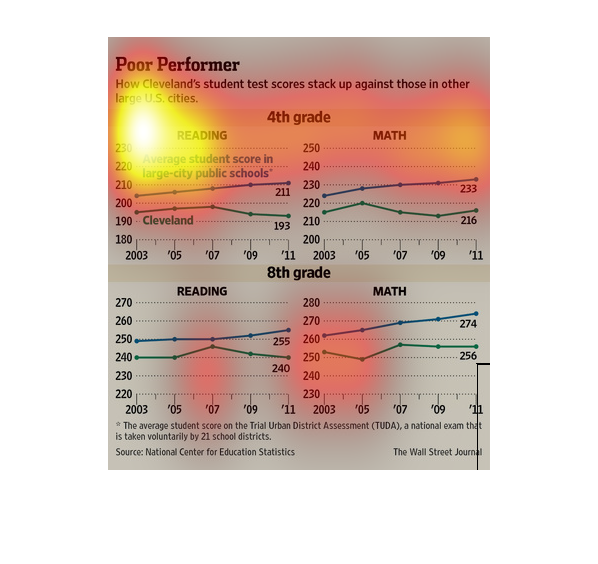
In this Wall Street Journal study from 2003 to 2011- information gathered from the National
Center for Education Statistics- we see students in Cleveland doing horribly on test scores
compared to the rest of the nation.
Poor Performance: How Cleveland's student test scores stack up against those in other large
US cities.  This fact is illustrated by four separate graphs which shows Reading and Math
levels of 4th and 8th graders. In each case, Cleveland is below the average for large US cities.
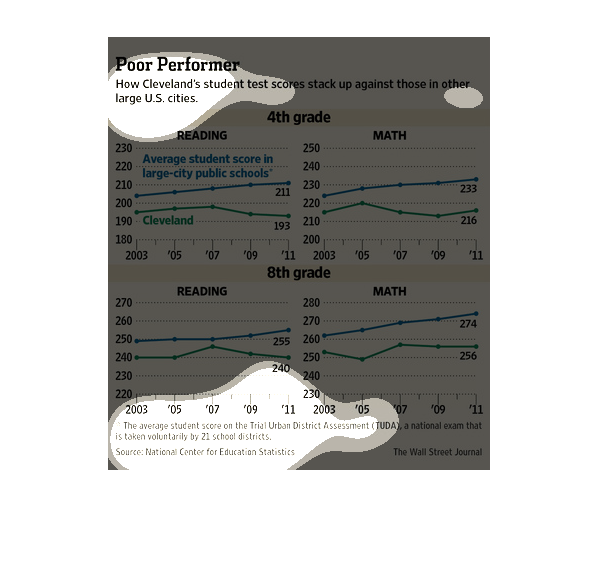
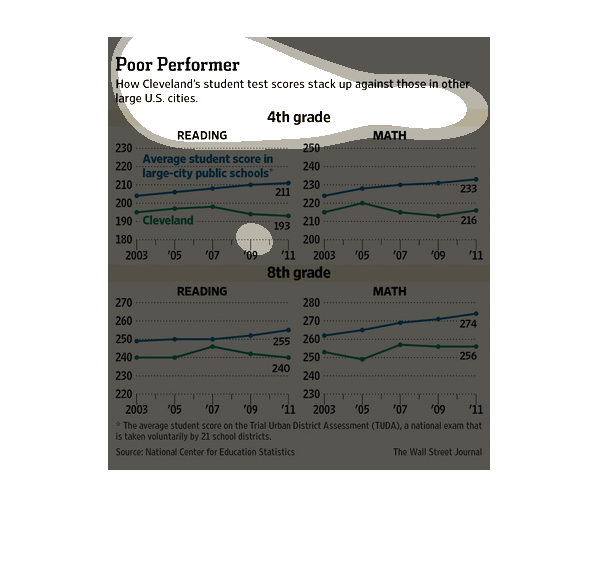
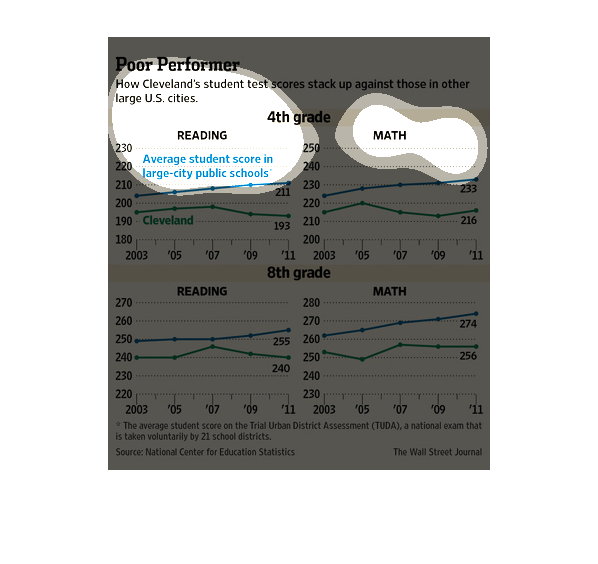
This graph illustrates how Cleveland, Ohio United States test scores stack up against those
in other major cities.  Cleveland is below the average for math and reading in both fourth
grade and eighth grade.
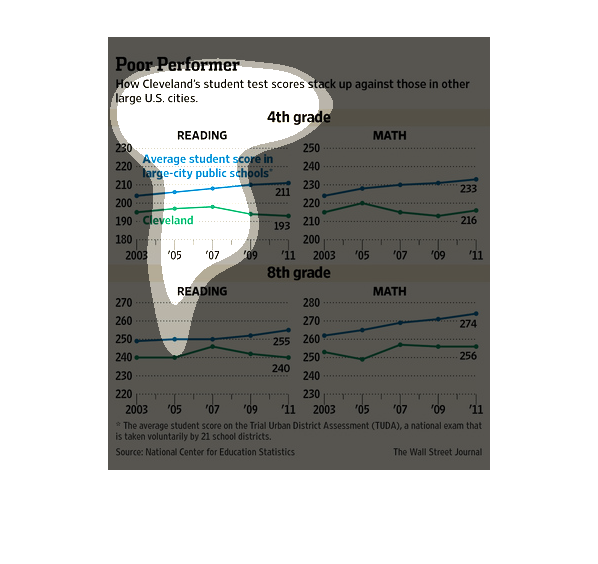
This graph shows how Cleveland's student test scores stack up against those in other large
cities in the United States. The graph is labeled "Poor Performer". It shows two different
line graphs.
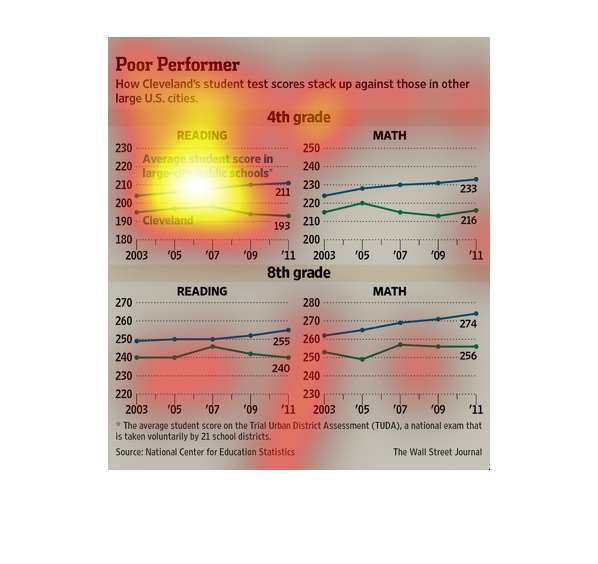
This chart describes poor performer. Specifically, how Cleveland's student test scores stack
up. Different categories are represented by different colors.
This chart from the Wall Street Journal shows how compulsory school students are faring poorly
on tests in Cleveland in relation to students in the United States
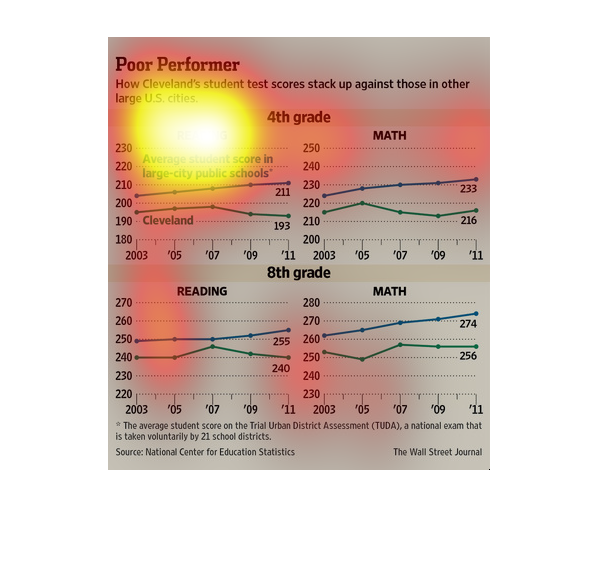
This chart describes poor performer. Specifically, how Cleveland student's test scores stack
up against those in other large cities around the United States.
This chart shows how test scores of students in Cleveland are consistently lower over many
years than the test scores of students in other large U.S. cities.
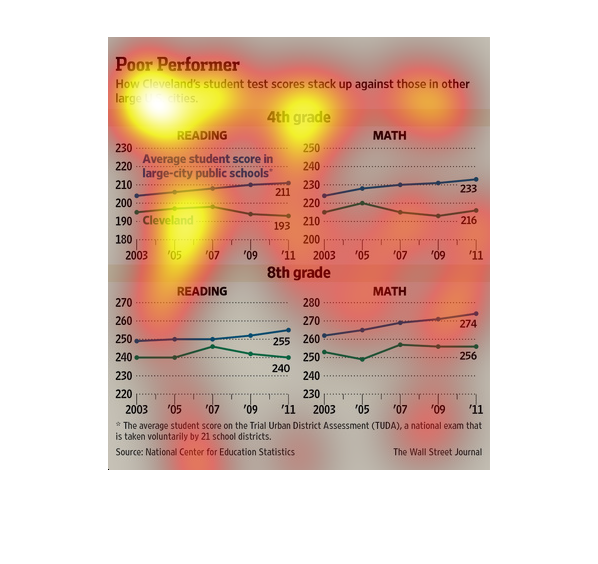
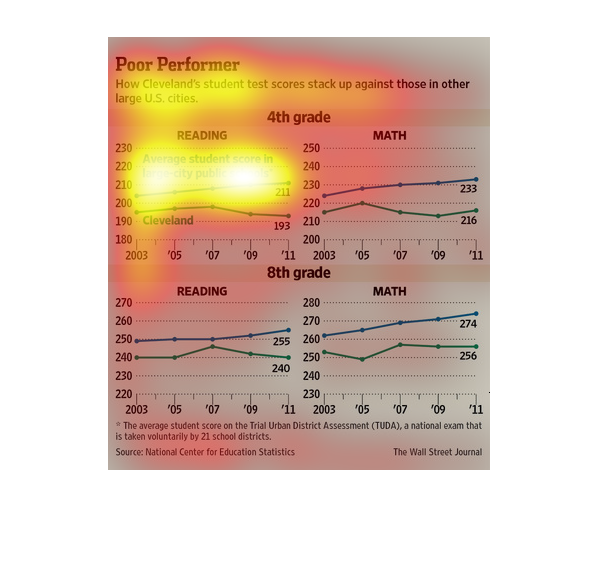
The image depicts Cleveland student's poor test scores when compared to other US cities. Cleveland
students are performing worse than the public school average in math and reading over a period
of multiple years.
This image compares the test scores of students in Cleveland to those in other major cities
across the United States. Between 2003 and 2011, 4th graders and 8th graders in Cleveland
under-performed compared to the average scores of larger cities in the subjects of reading
and math.
This chart shows Cleveland, Ohio's student test scores compared to other large U.S. cities.
In Math and Reading, they have tested significantly lower than other students in big cities
nationwide.