This chart describes squeeze play. Specifically, austerity is taking a toll on Portugal's
economy. Different categories are represented by different colors.
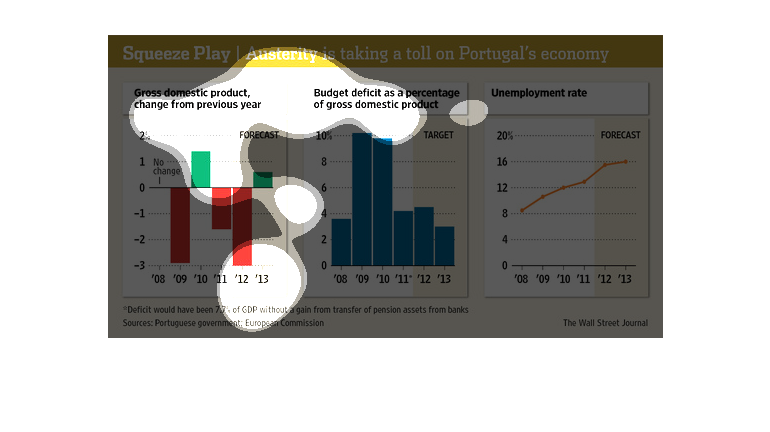
This is a series of color coded bar graphs with related statistics depicting that austerity
was taking a toll on Portugal's economy as seen in data from 2008 to 2013.
Like Greece, Portugal is in the danger zone of totally collapsing under its own weight. In
this study conducted by the Wall Street Journal we see the rise in unemployment and unstable
market root causes of all their woes.
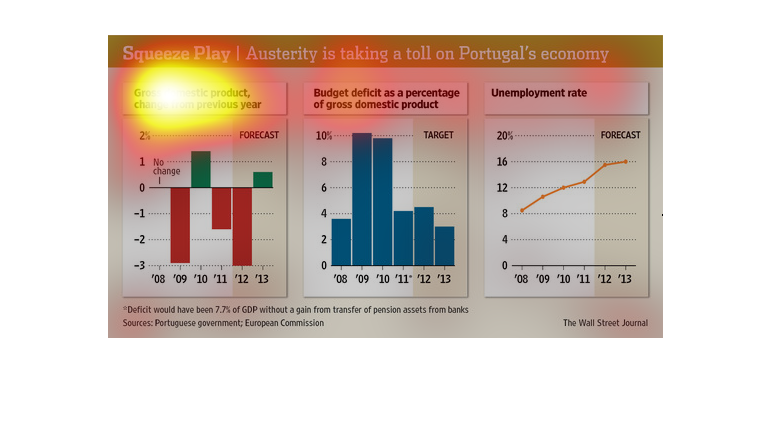
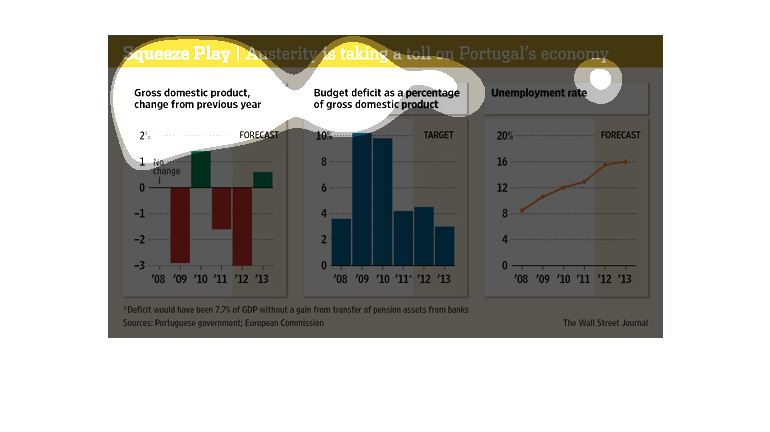
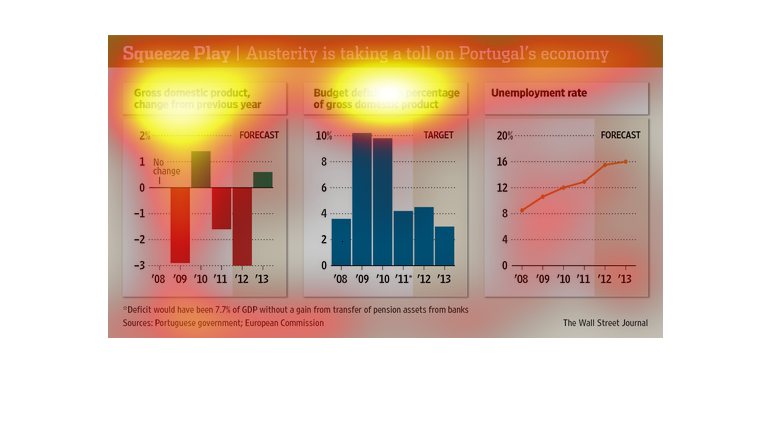
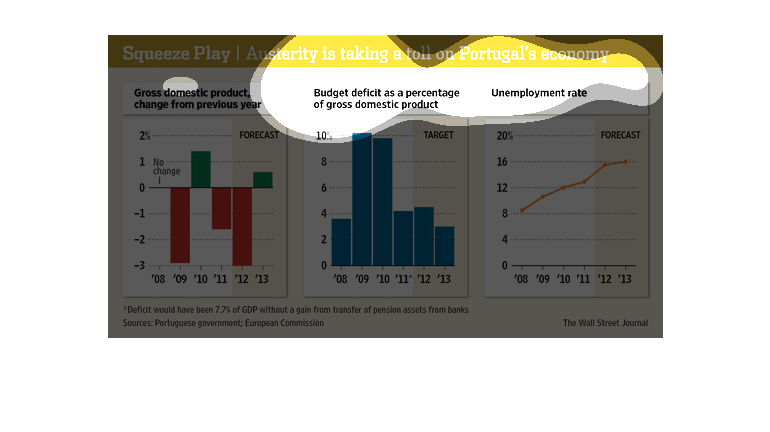
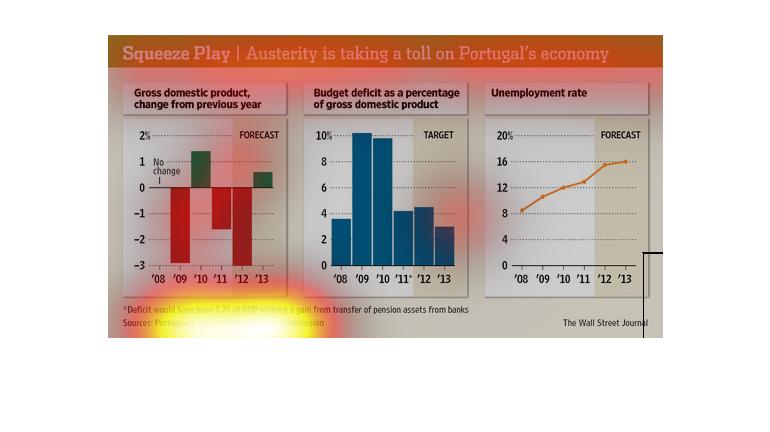
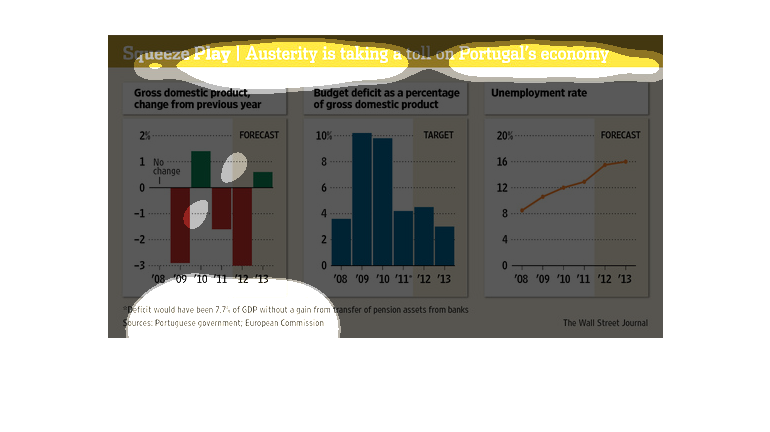
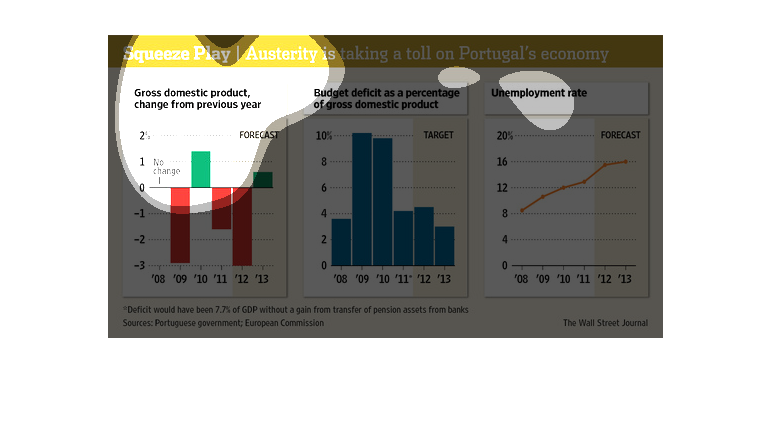
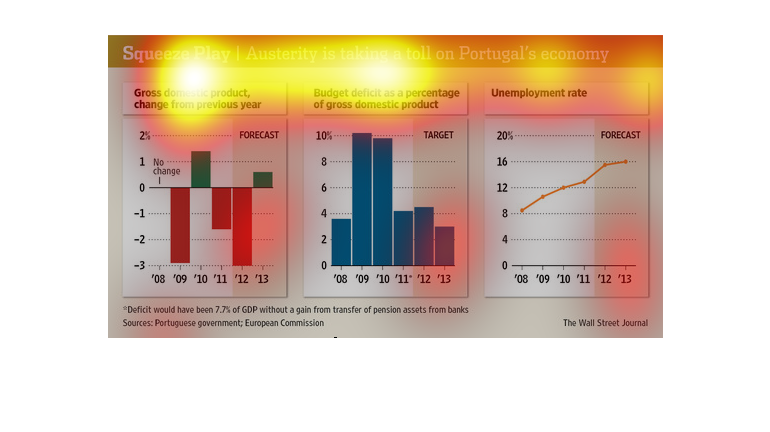
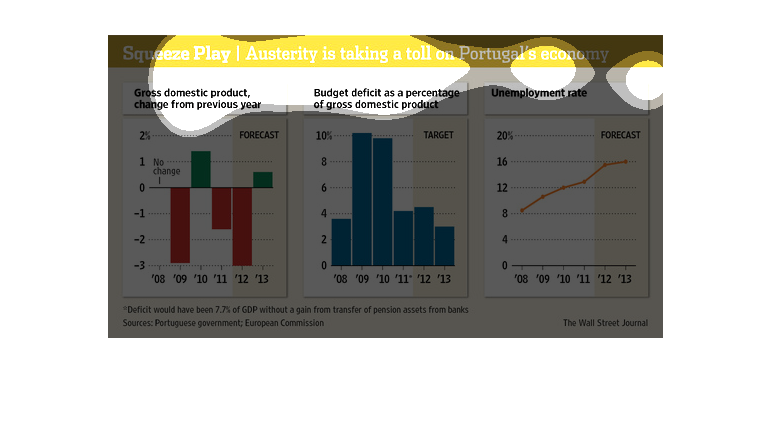
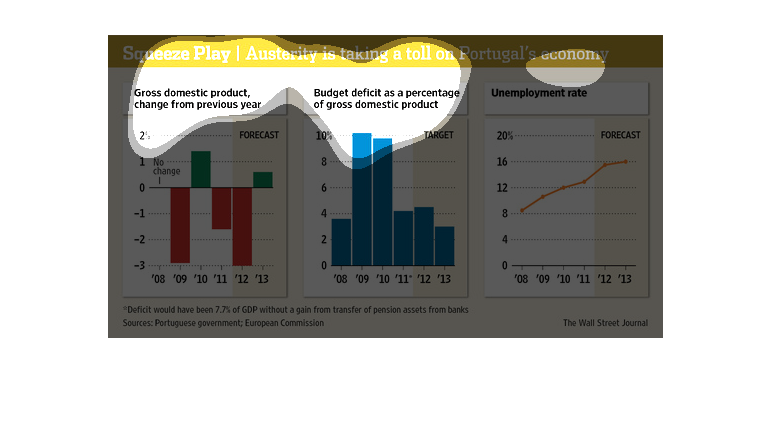
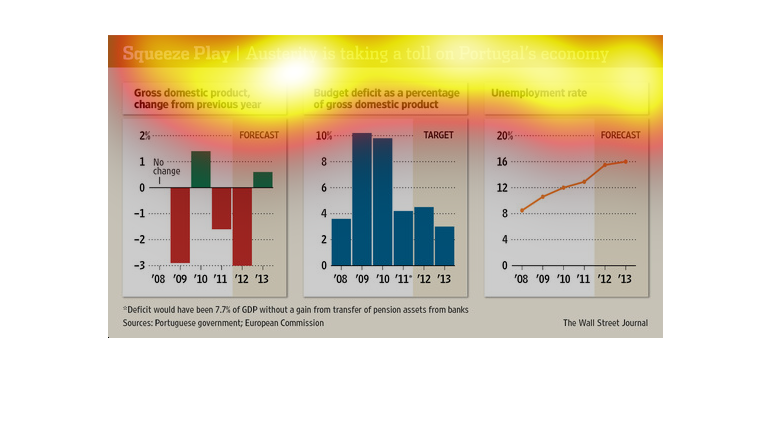
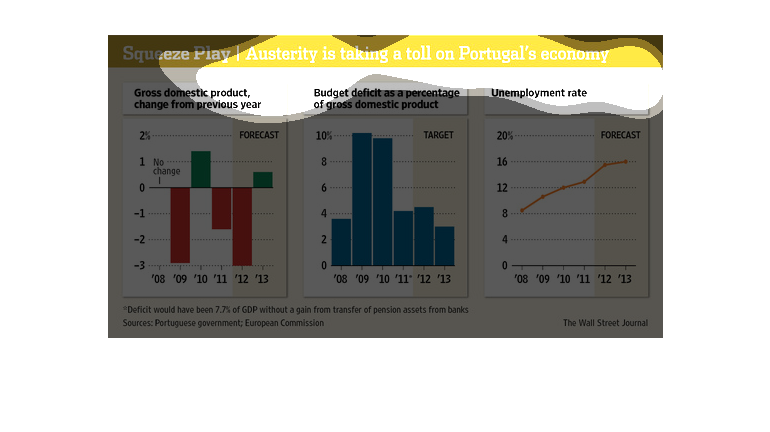
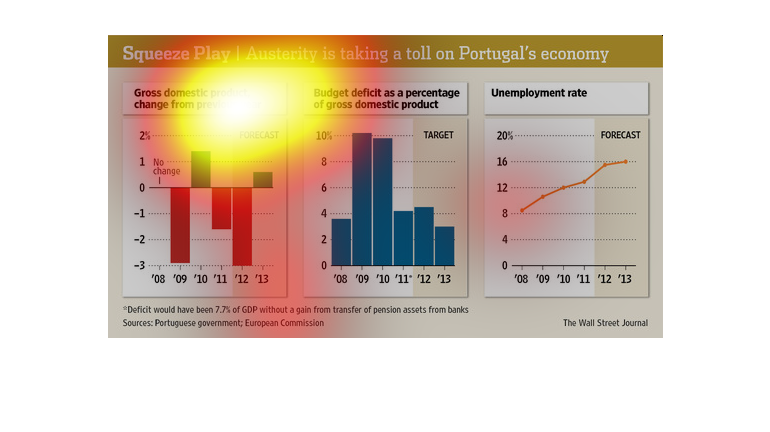
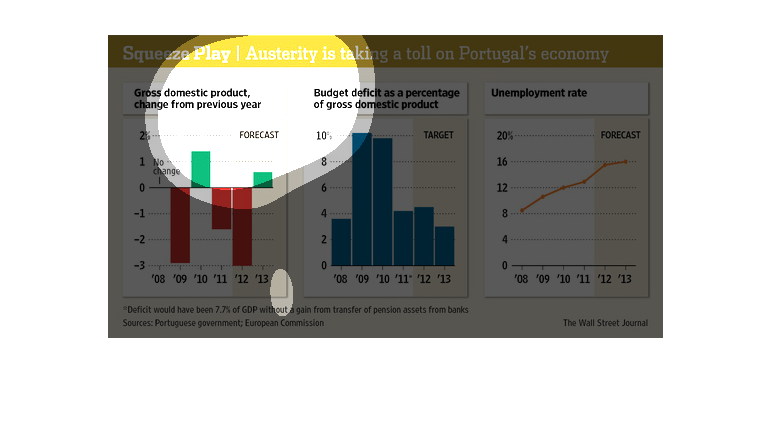
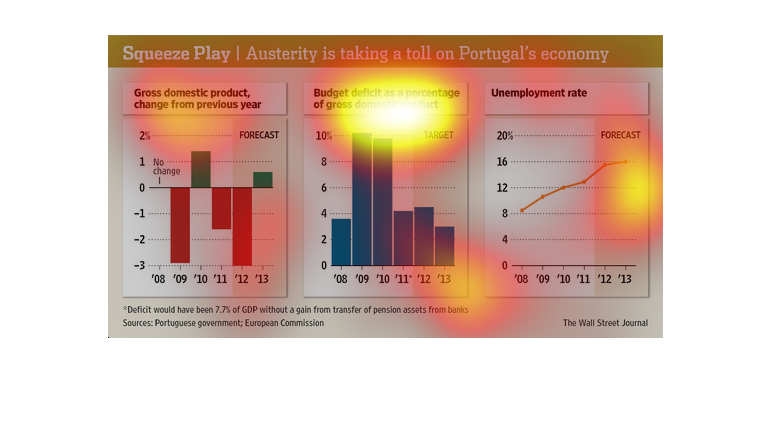
Austerity is taking a toll on Portugal's economy. GDP is down for 2011-2012 but is forcasted
to slightly improve. Budget deficit is down significantly. Unemployment is expected to rise.
The title of the graphic is squeeze play: Austerity is taking a toll on Portugal's economy.
It shows a decrease in the gross domestic product from the previous year.
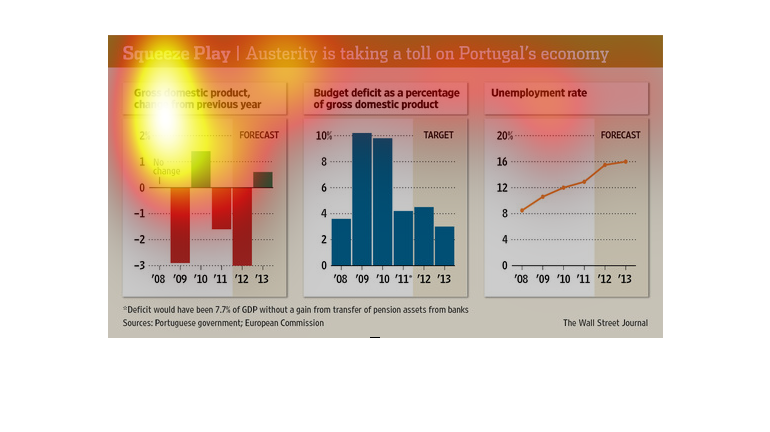
This image shows or depicts in both bar graph and line graph statistical format information
concerning how austerity is taking a toll on Portugal's economy.
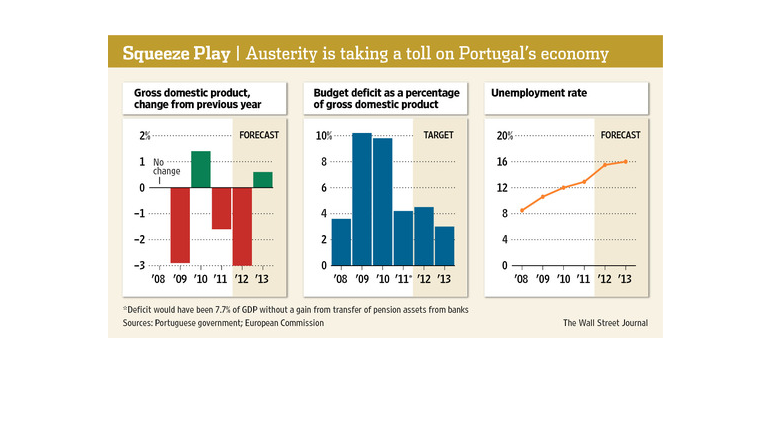
This chart from the Wall Street Journal shows how austerity measures of budget cuts and tax
increases is putting a squeeze on Portugal's economy.
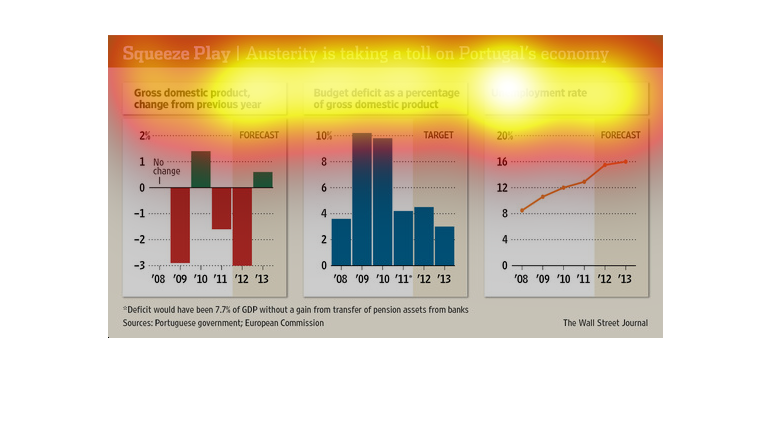
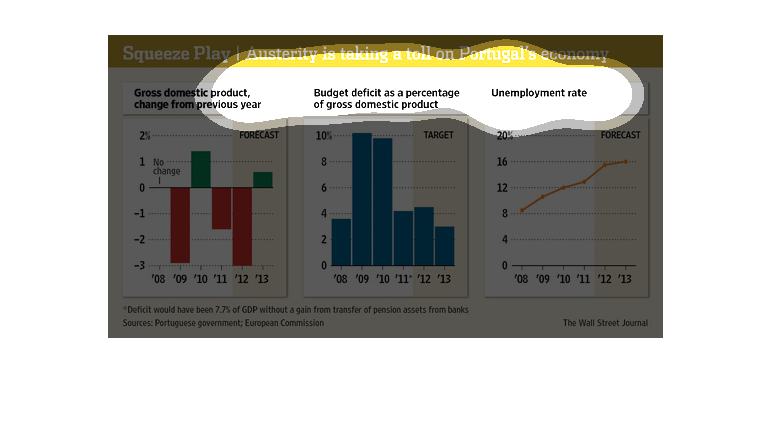
This shows Portugal's GDP, deficit, and their effects on the unemployment rate. While GDP
has been in the red with forecast to rebound, and the deficit is decreasing steadily, unemployment
continues to rise.

This chart describes squeeze play. Specifically, austerity is taking a toll on Portugal's
economy. Different categories are represented by different colors.
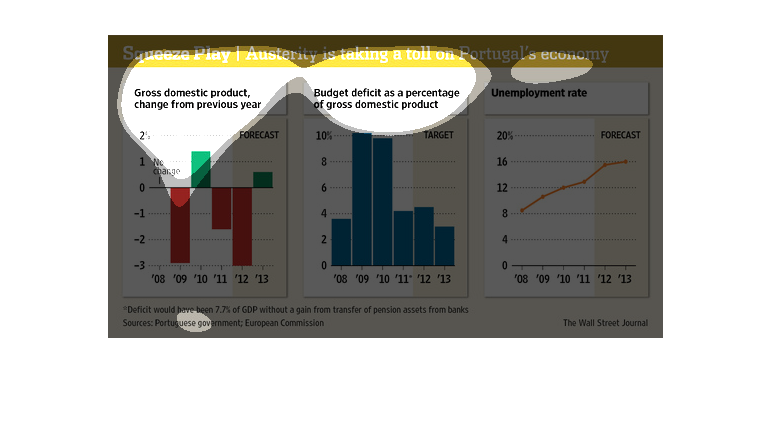
the name of this graph or chart is called squeeze play and it has two bar graphs on it. the
first graph has two colors red and green the green side is up
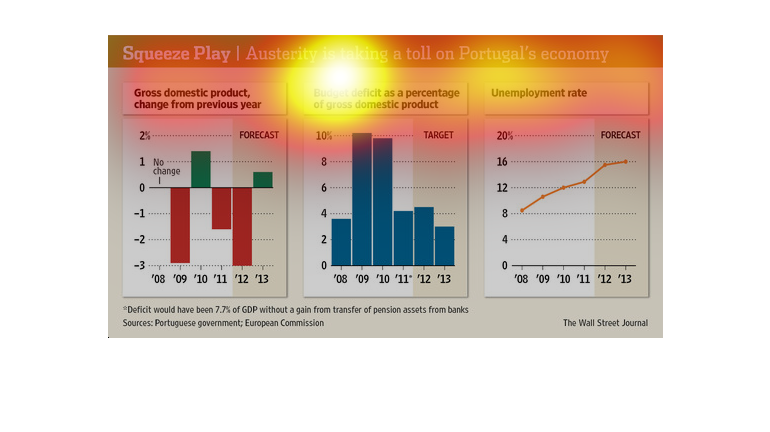
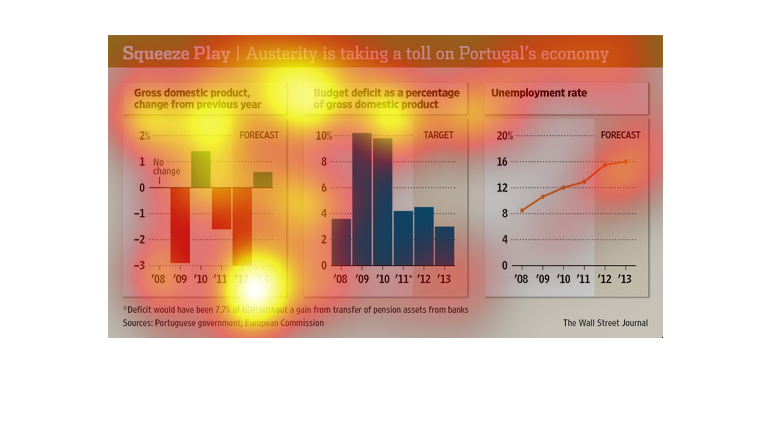
The image depicts how austerity is taking having a negative effect on Portugal's economy.
Portugal's unemployment rate is steadily increasing, while GDP growth is very minor, with
the budget deficit as a percentage of GDP decreasing steadily.
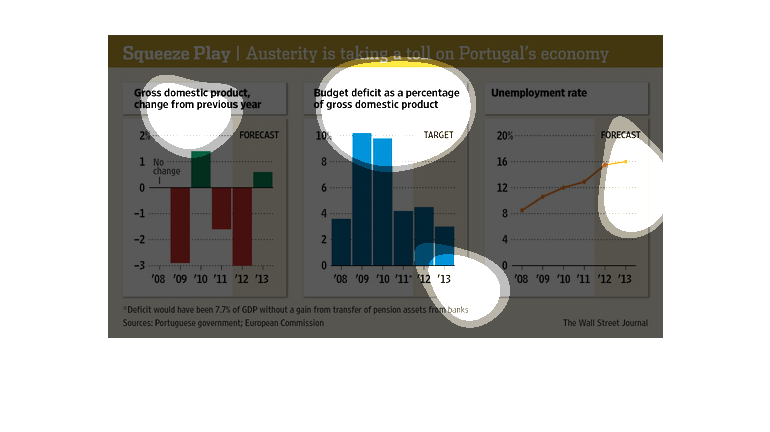
Austerity measures are taking a toll on Portugal's economy. 2011 and 2012, after brief gains
in 2010, showed declines in GDP. The budget deficit also increased in 2009 and 2010, and was
significant in subsequent years as well.
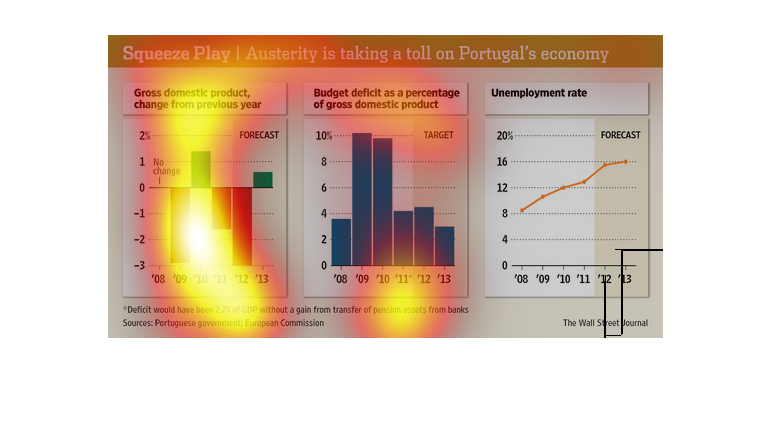
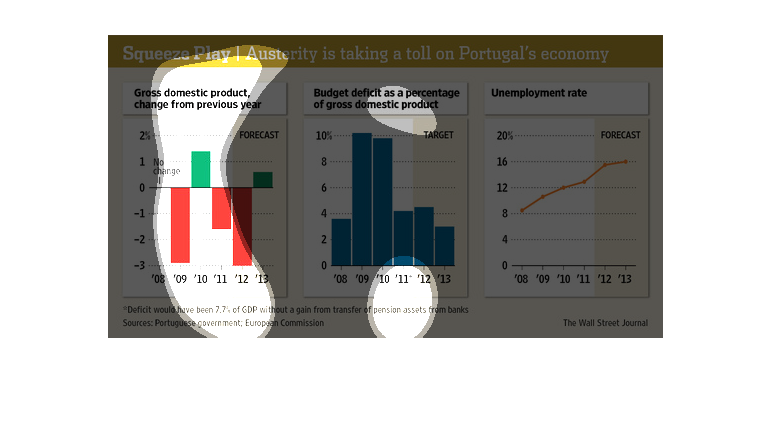
This is a chart about portugal's economy from 2008-2013. It shows the amount of gross domestic
product, the budget deficit and how that has affected Unemployment rates.