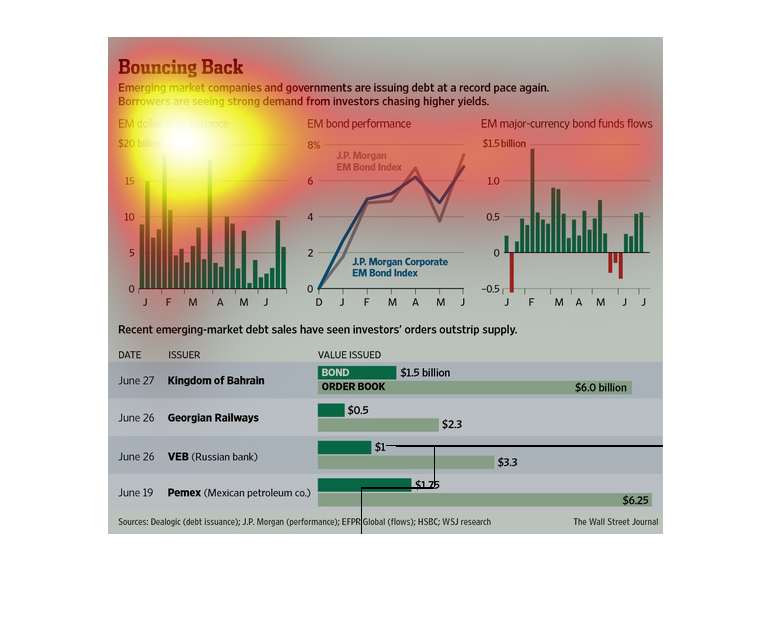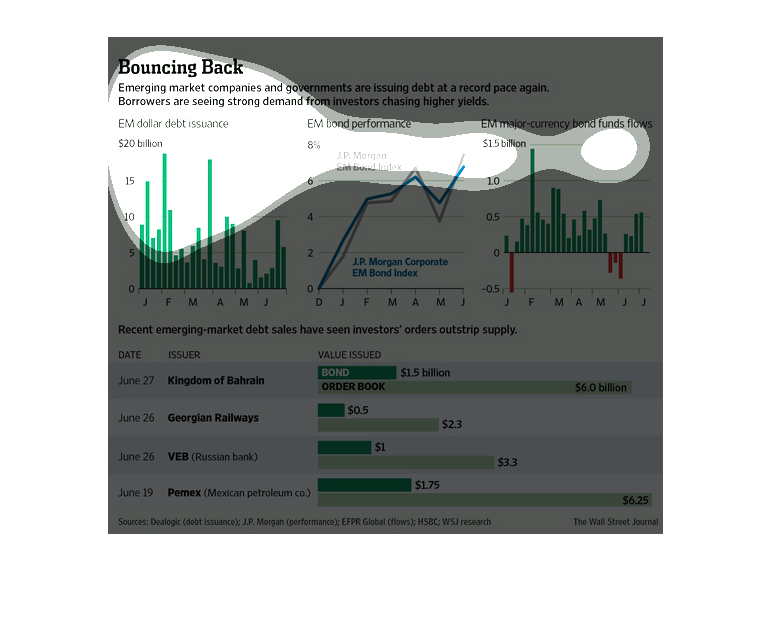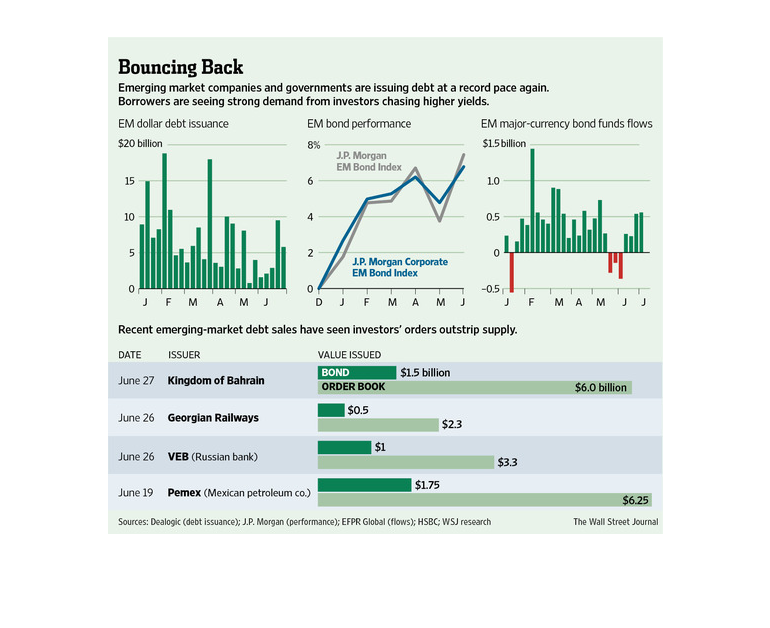
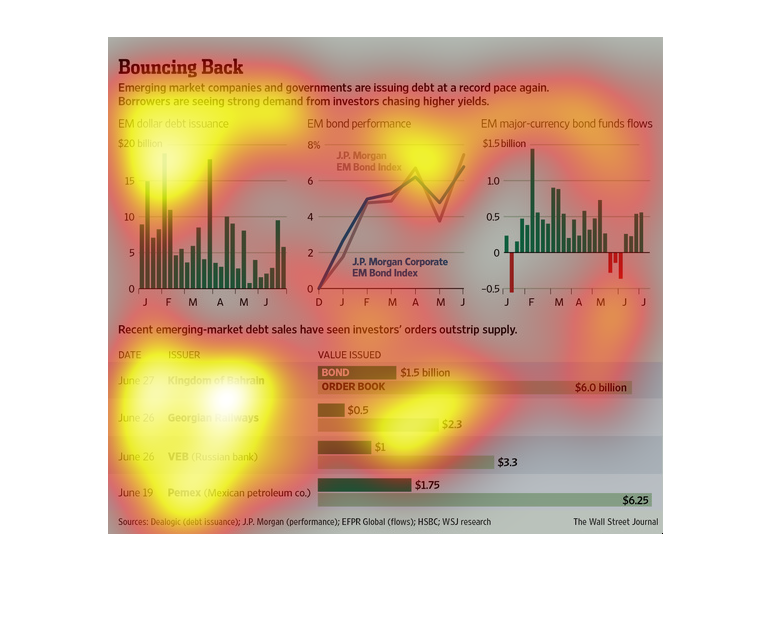
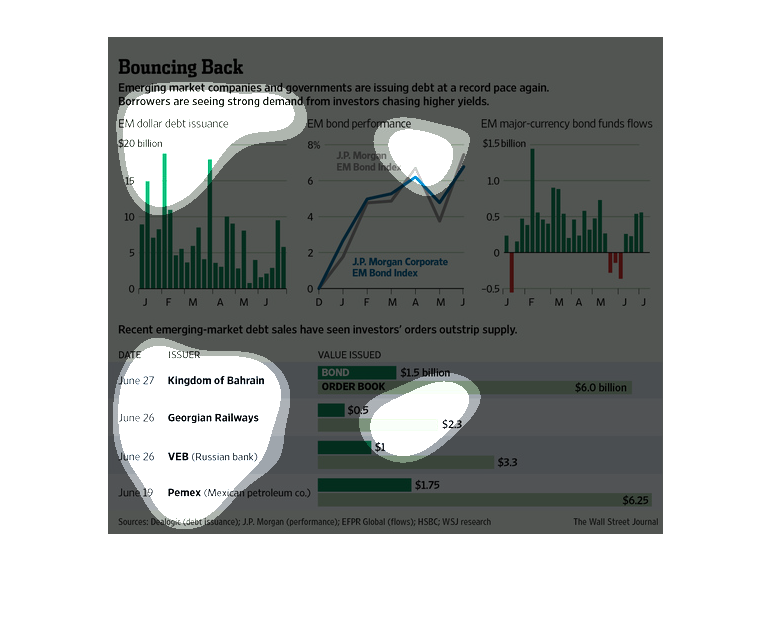
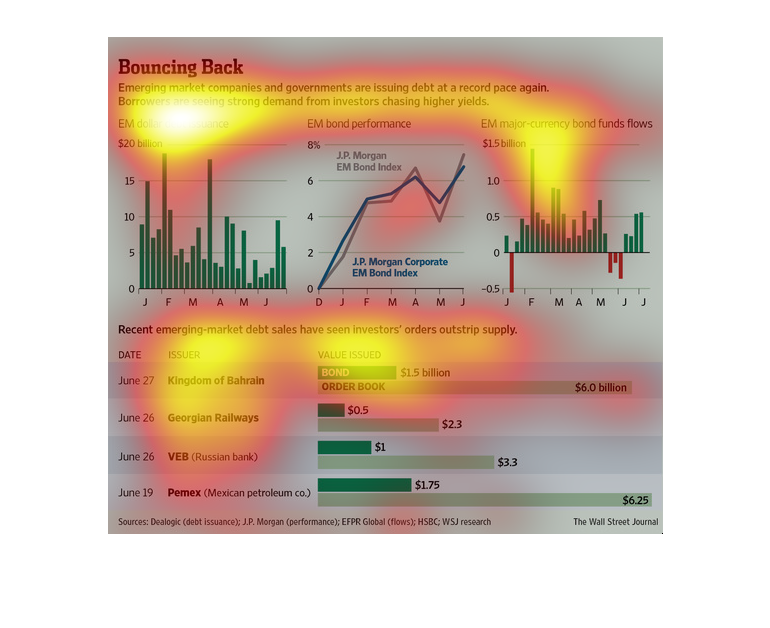
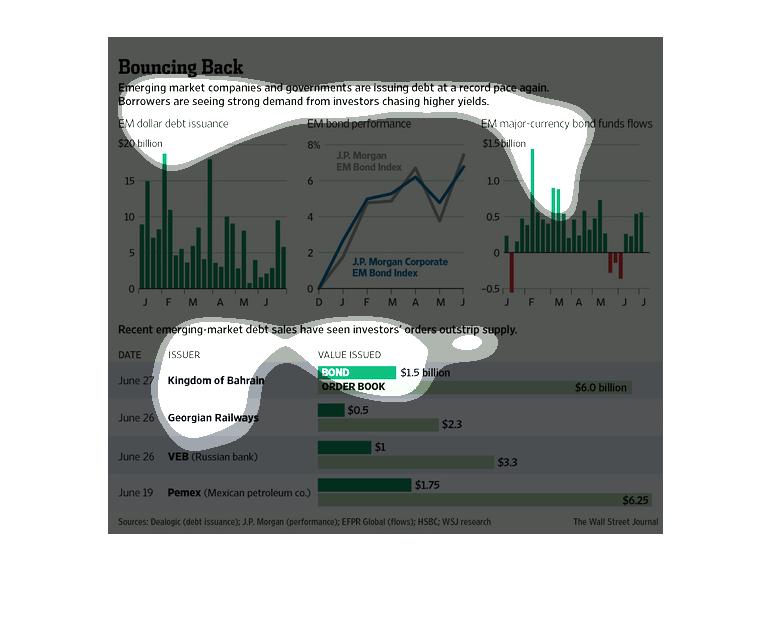
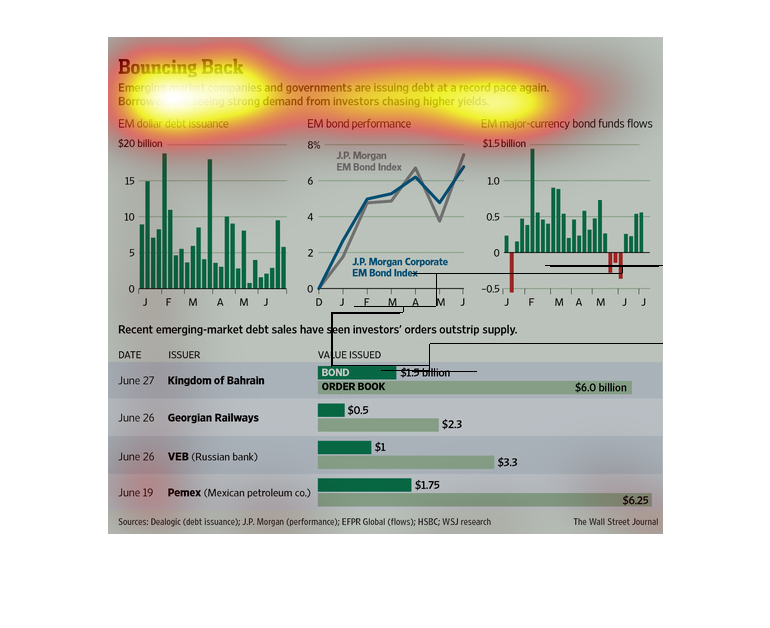
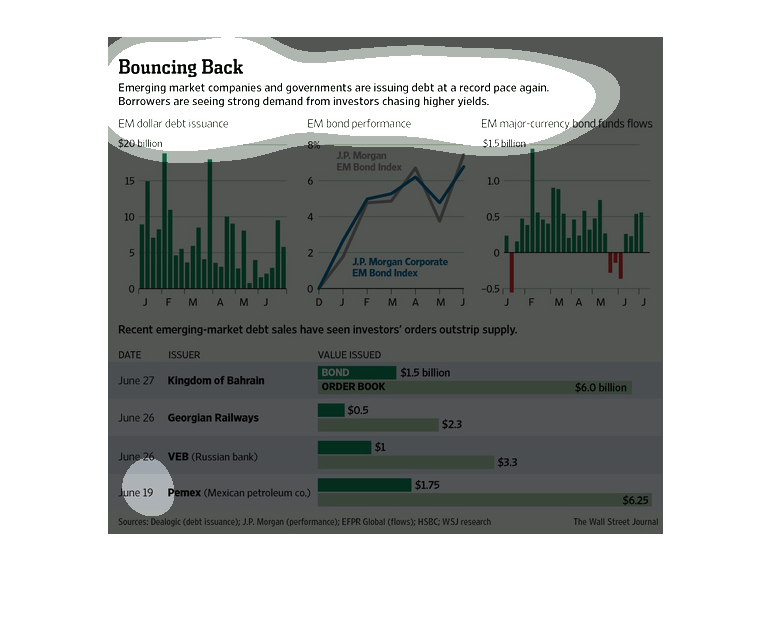
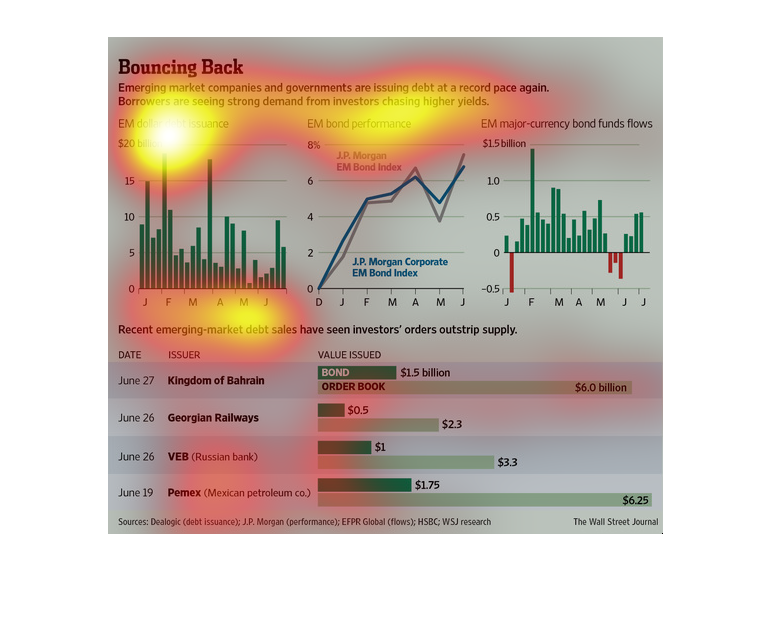
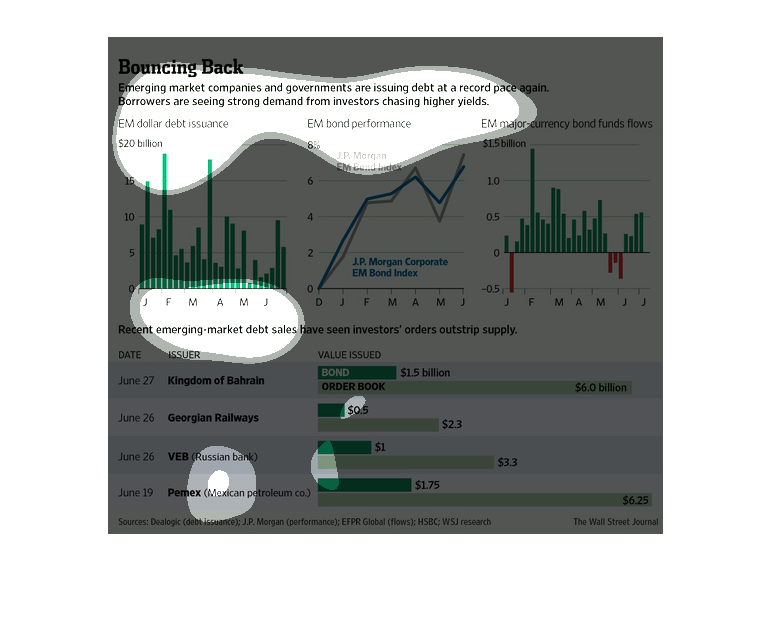
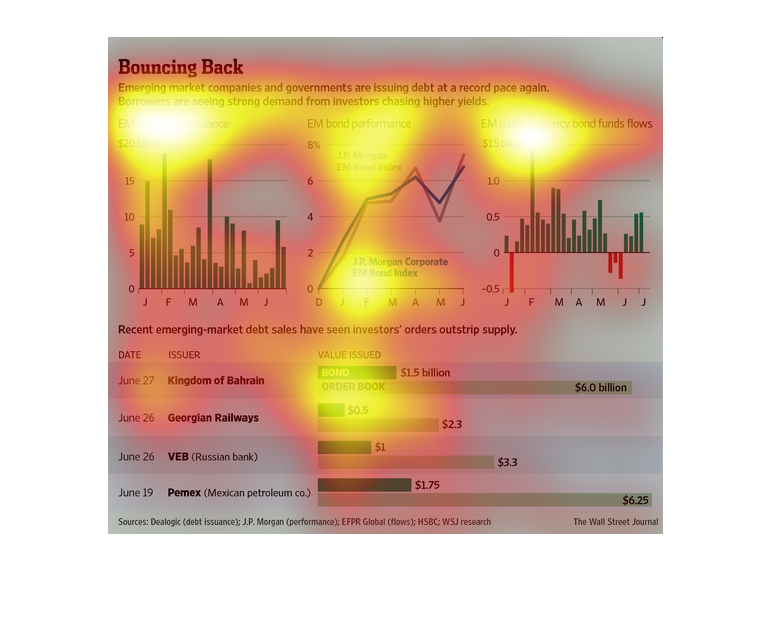
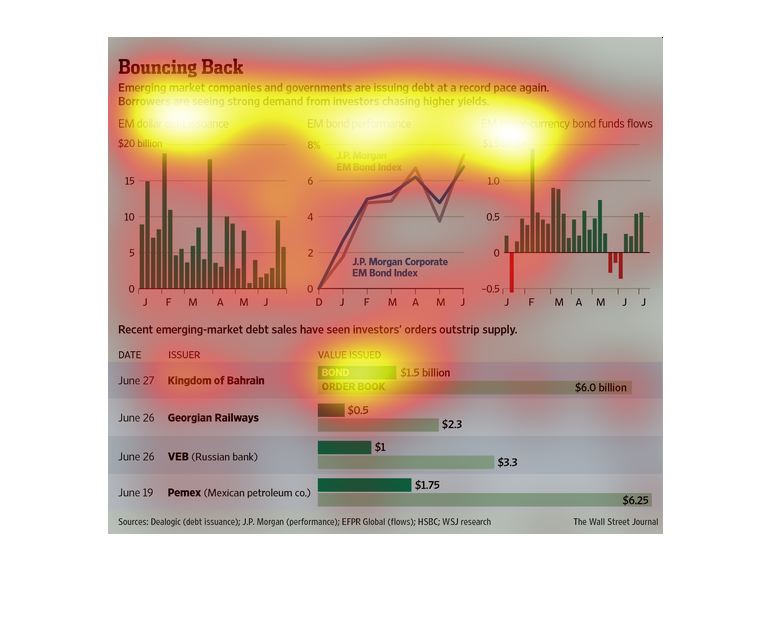
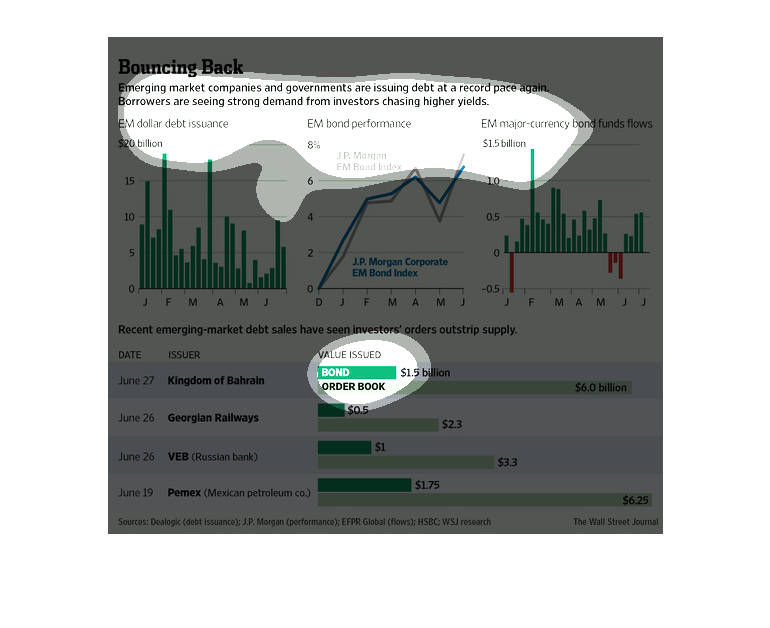
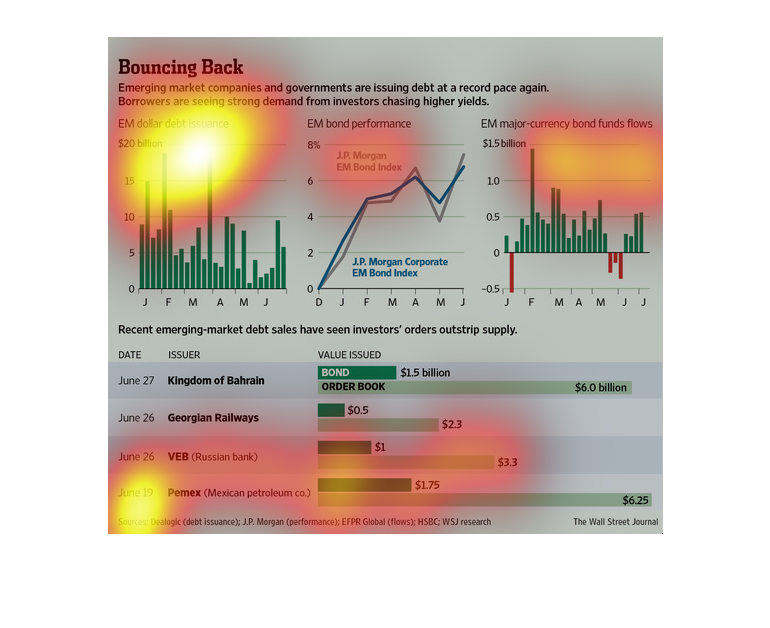
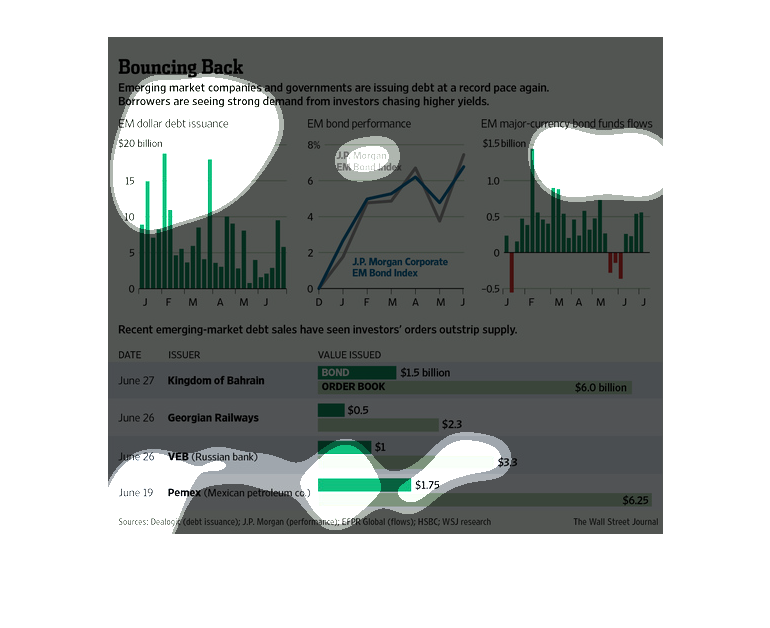
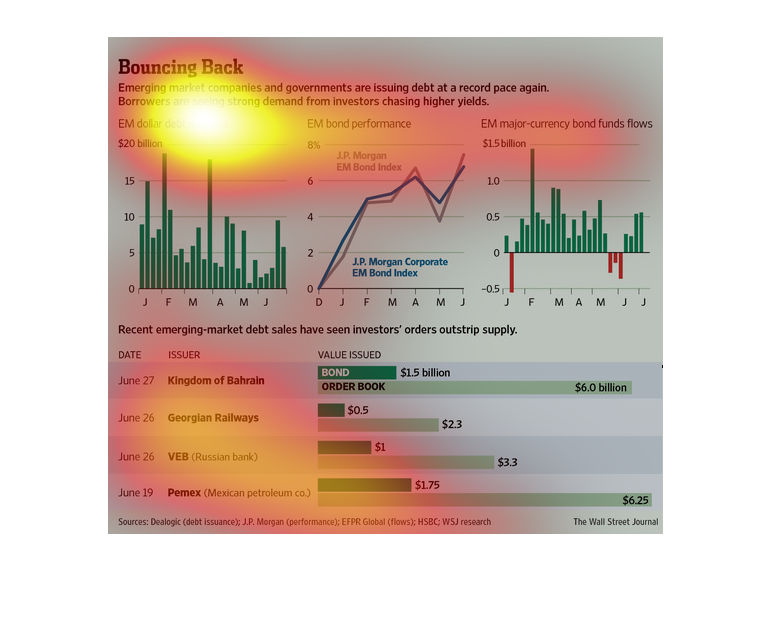
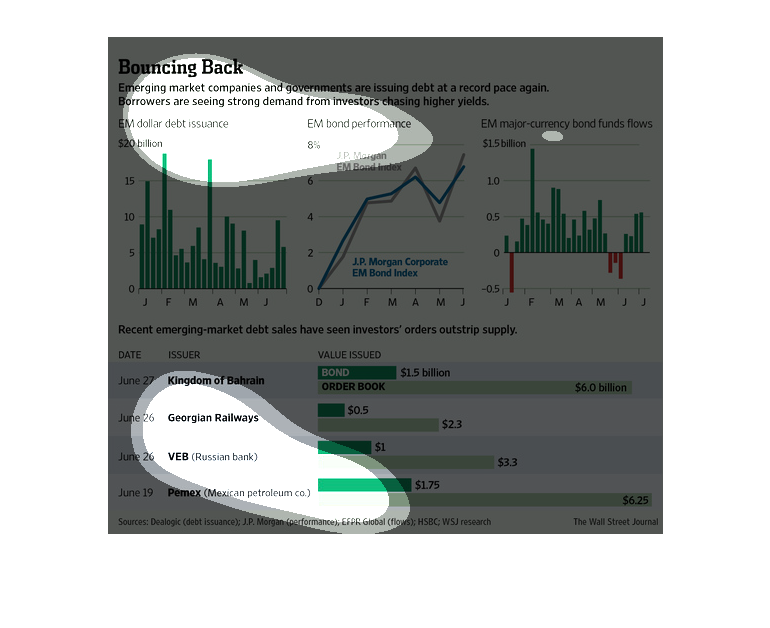
This chart describes bouncing back. Specifically, emerging market companies and governments
are issuing debt at a record pace again. Borrowers are seeing strong demand.
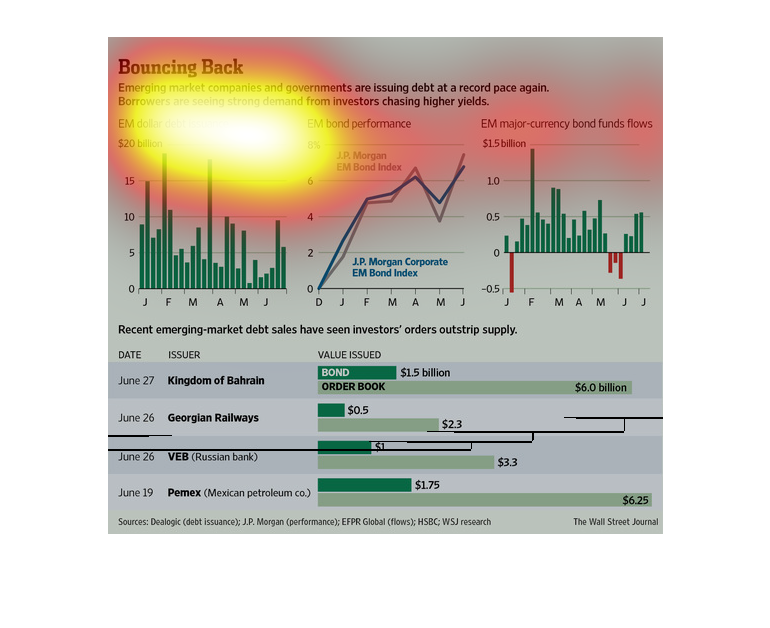
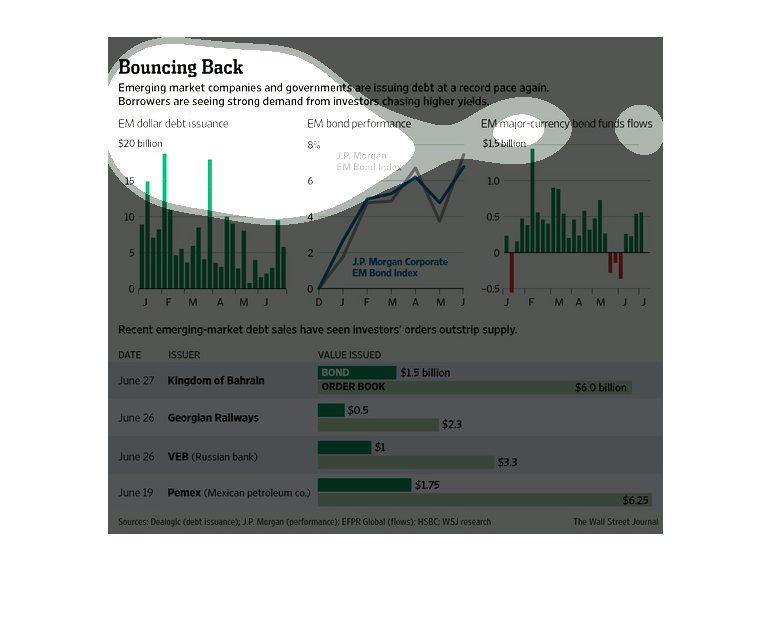
This series of graphs shows how emerging world businesses are issuing debt at an increasing
rate, aas their stock rises (shown in a trending graph). Below the sources are ranked by values
of the bonds issued and total investments.
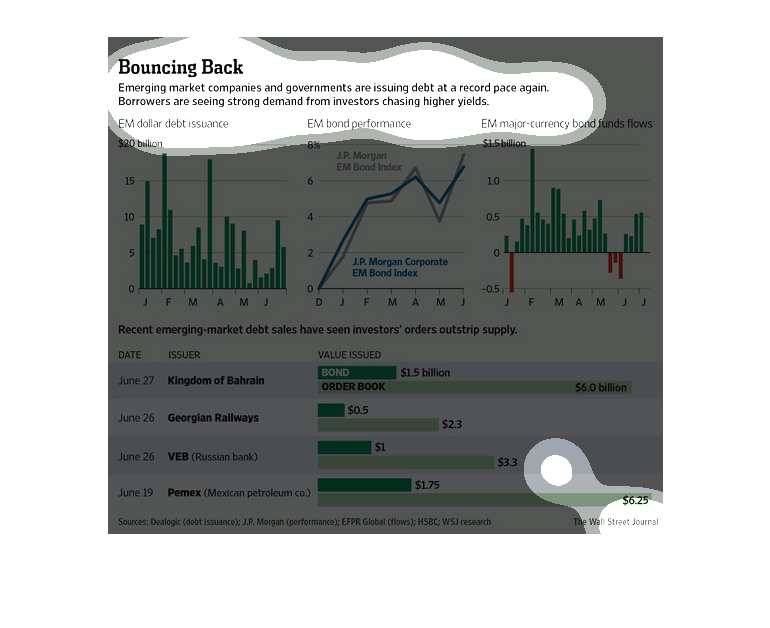
This is an infographic, dealing with a recovering market.  Investors are putting money into
borrowers with expectations of higher yields.  The graphs are showing how much money is flowing
into different sectors.  There are 3 bar graphs and two line graphs.
The world has not yet recovered from the devastating recession it had to endure a few years
ago, but the fact remains that emerging markets are making strides to improve their GOP
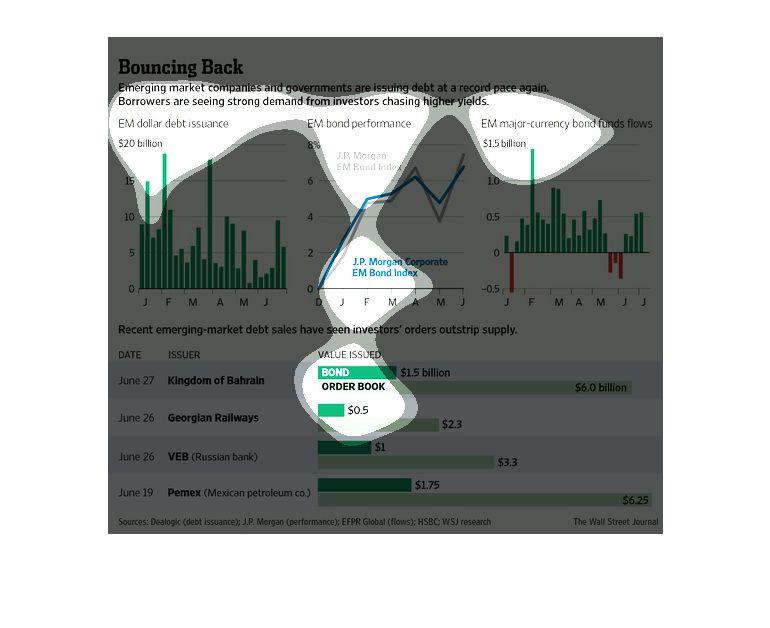
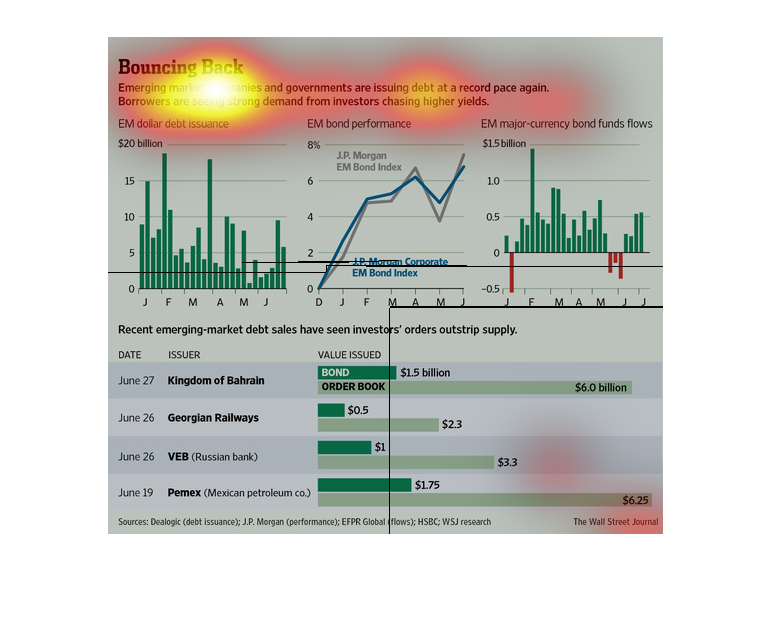
Titled "Bouncing Back." It talks about institutions issuing debt at a record pace again, with
a bar graph showing em dollar debt issuance from January to June, with the peaks being in
february and April.
Emerging market companies and governments are issuing debt at a record pace and demand is
almost 4 times that of supply as investors are looking for larger returns.
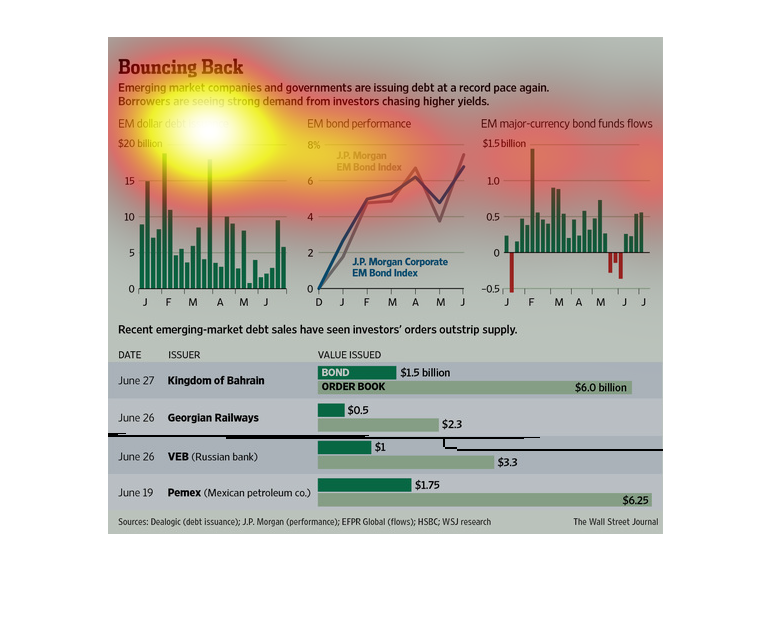
This chart from the Wall Street Journal shows how emerging markets are issuing sovereign and
corporate debt at a quick pace now, reflecting growth expectations
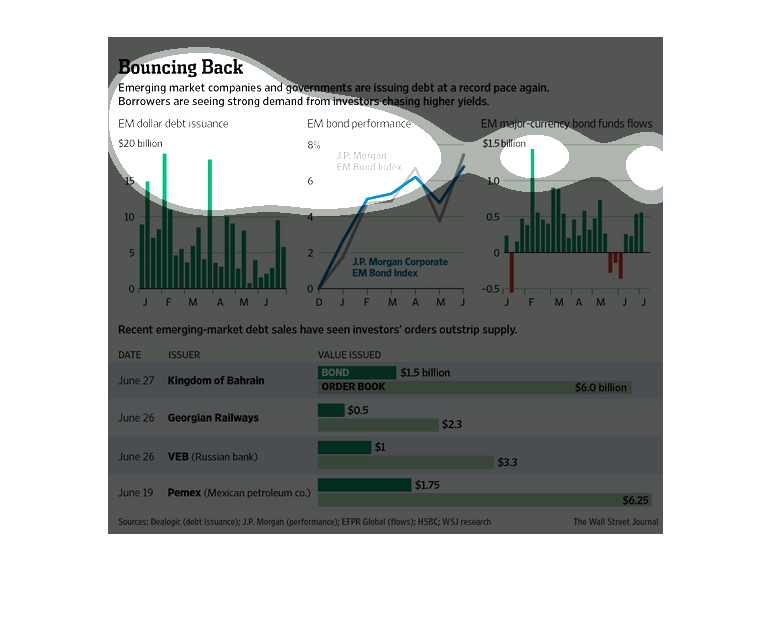
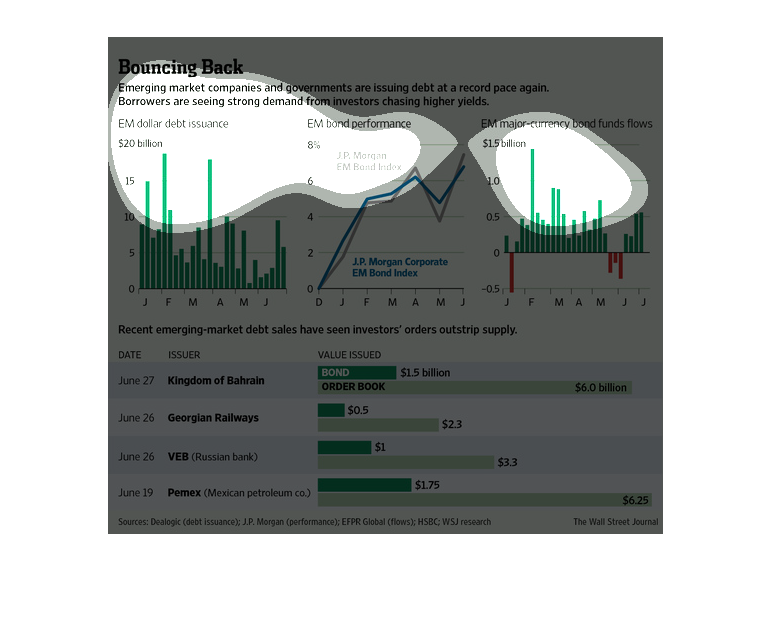
This chart shows bond performance for emerging markets. JP Morgan EM Bond Index performance
increased to 8% from December to June. EM major currency bond fund flows reached $15 billion
in February.  The value issued of bonds from the Kingdom of Bahrain was $1.5 billion.
The title of the graphic is bouncing back. It says that emerging market companies and governments
are issuing debt at a record pace again, and borrowers are seeing strong demands from investors.
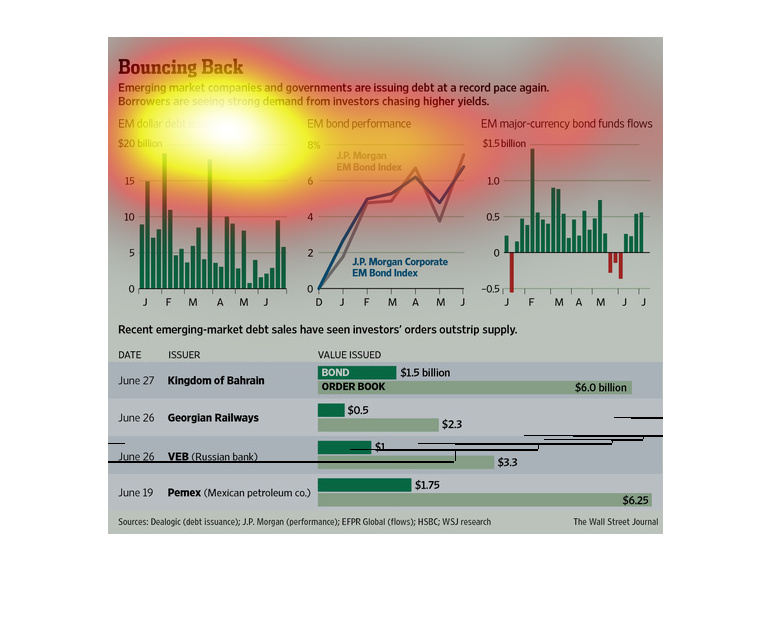
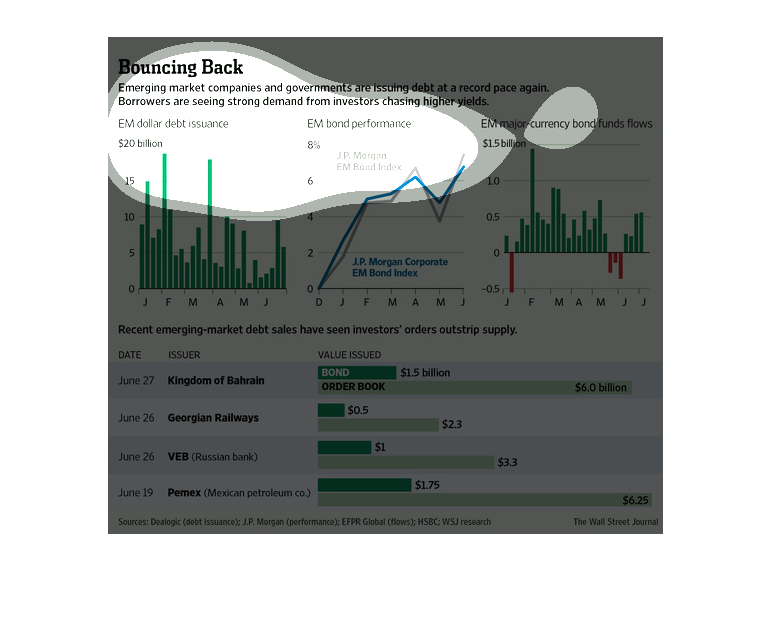
This is a series of graphs showing emerging market dollar debt issuance, emerging market bond
performance, emerging market currency bond funds flows, and recent emerging market client
debt sales.
This graph is illustrating how not only various companies, but governments have bounced back
after the stock market crisis in 2008. The graph also shows debt sales
This chart from the Wall Street Journal shows how emerging market debt is starting to rebound
and how this is a sign of economy health and growth in the world
The image displays several graphs showing the increase in the issuing of debt from the government
and emerging market companies. The graphs display the outflows of bonds and debt issuances
and their performance.
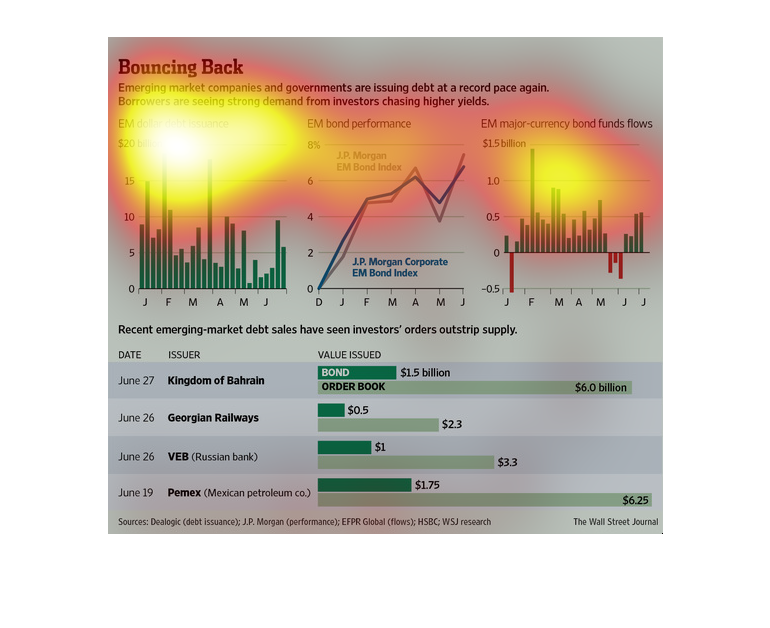
An infographic on Emerging Markets. Showing large increases in demand for capital for emerging
markets, creating opportunity for investors and creating debt