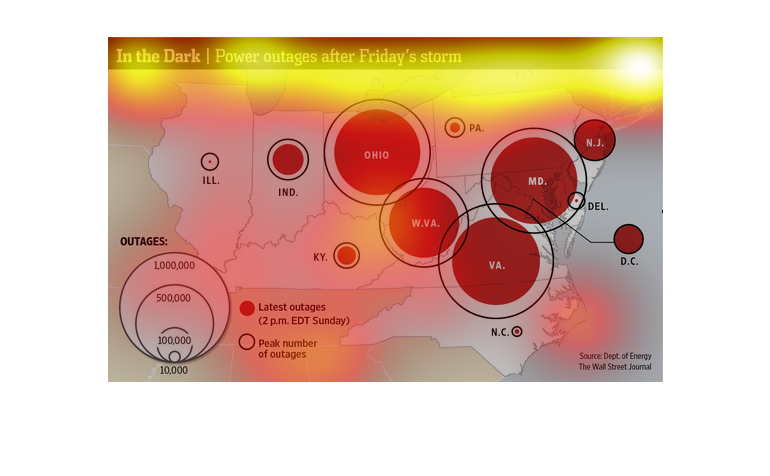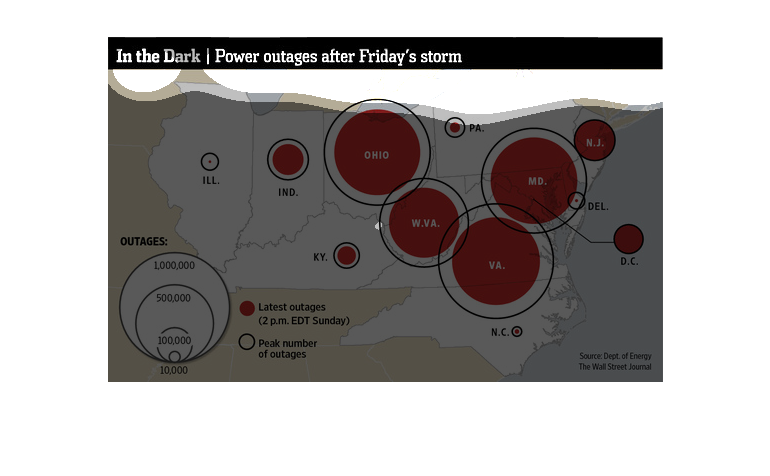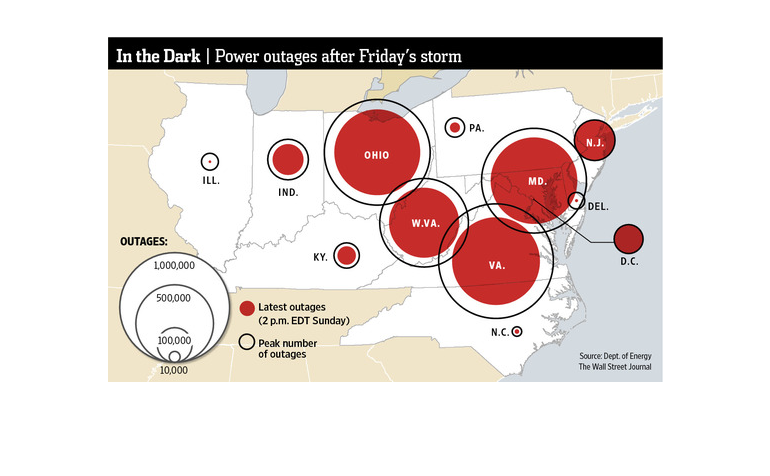
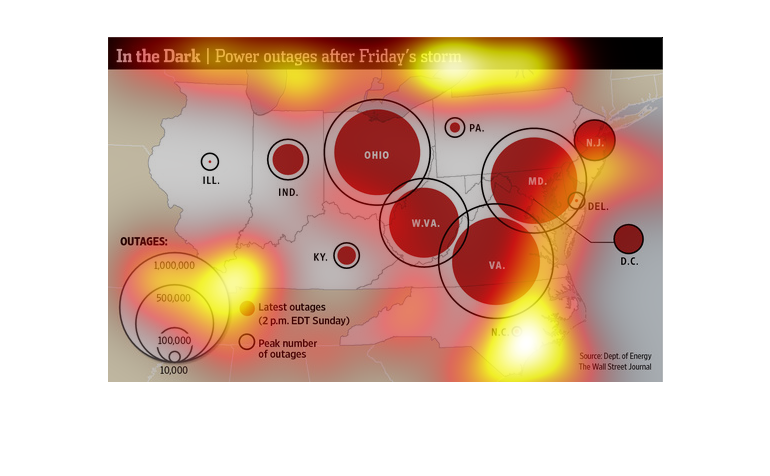
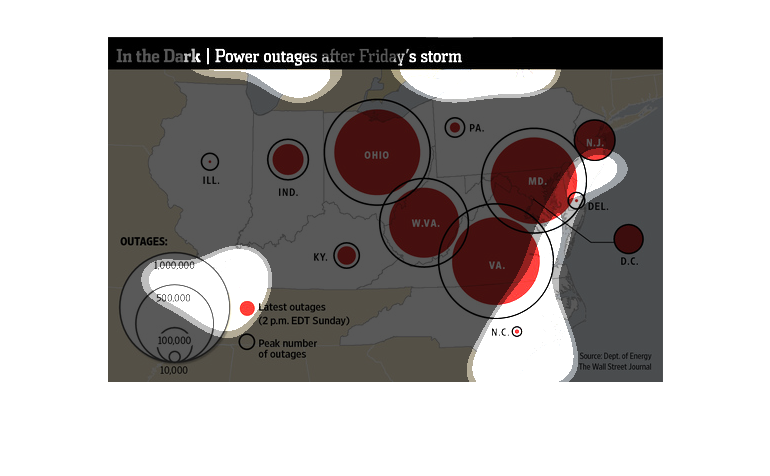
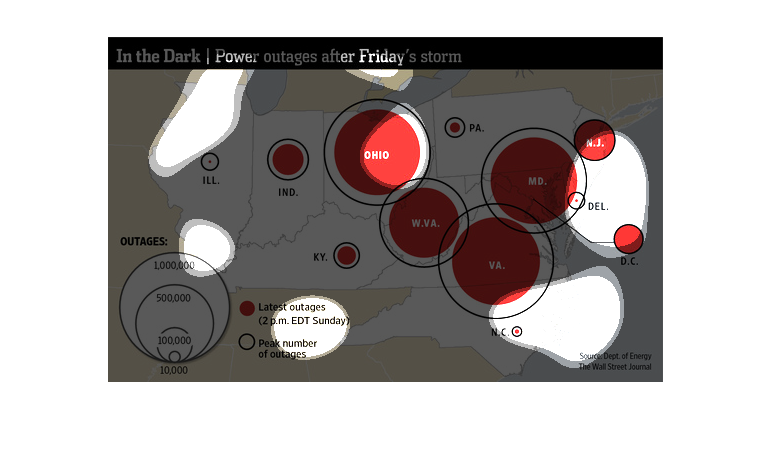
The chart shows the power outages after Friday's storm as it relates to the east cost and
midwest of the US.  The chart shows the impacts to the states and depicts what areas suffered
the most outages.
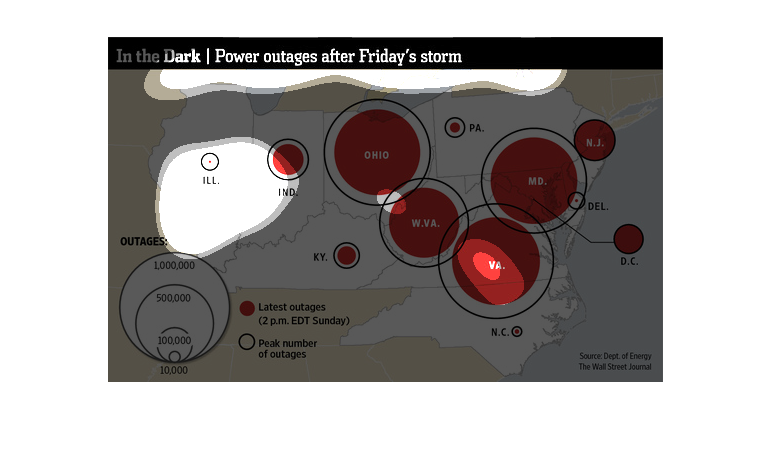
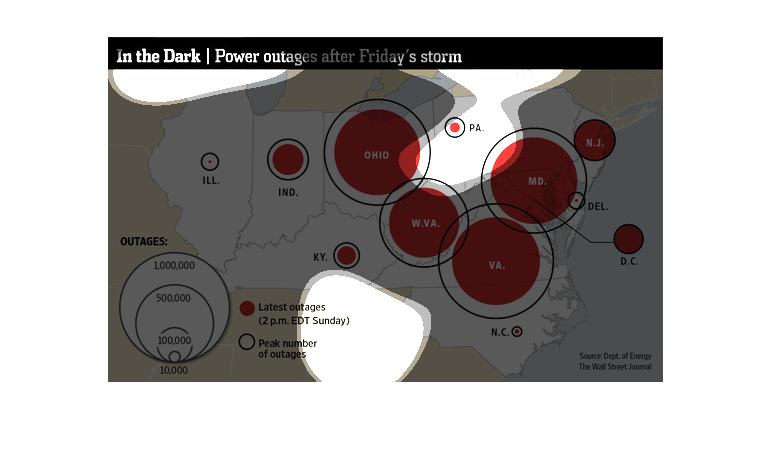
This chart from the Wall Street Journal shows how power outages occurred as a result of the
superstorm sandy and how it primarily impacted the atlantic coast
This is a map showing power outages after a storm. It has the latest numbers of outages and
peak number of outages over the Eastern part of the United States,
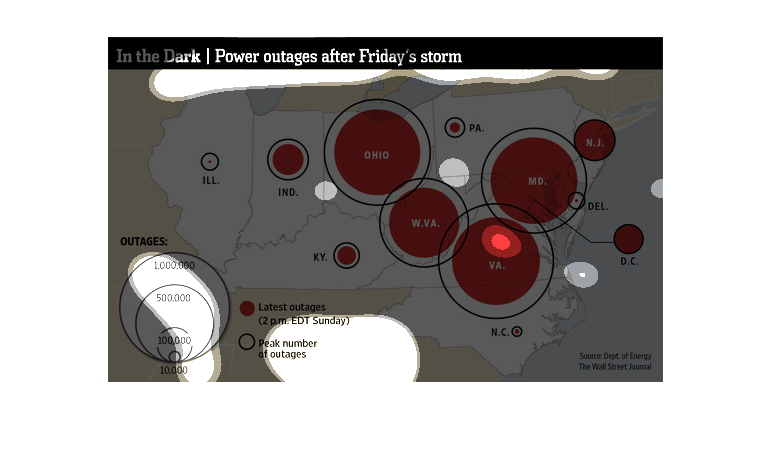
This chart describes in the dark. Specifically, power outages after Friday's storm. categories
on the chart include latest outages, and peak number of outages.
This map shows power outages in much of the mid-atlantic-including Virginia, West Virginia,
Pennsylvania and Ohio anfter a severe thunder storm in the areas.
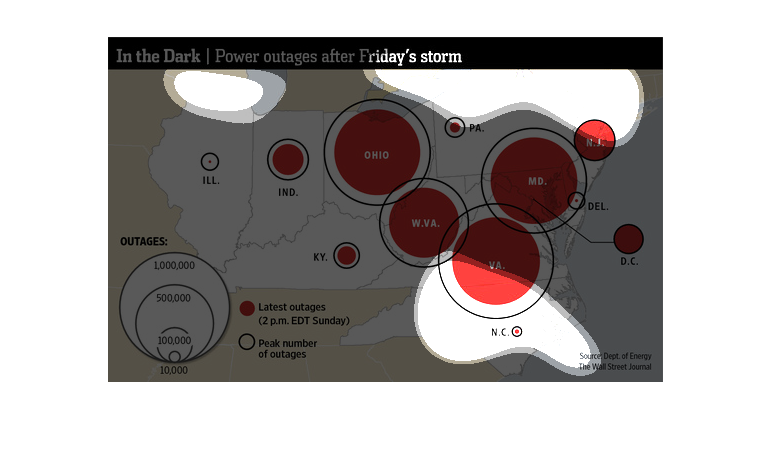
This image shows a map of mid eastern United Sates. It details several locations where power
outages occurred after a storm. It also gives information on the number of outages.
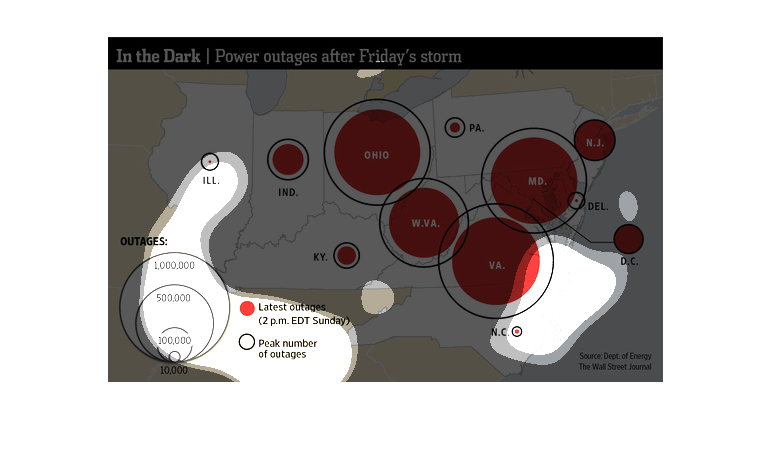
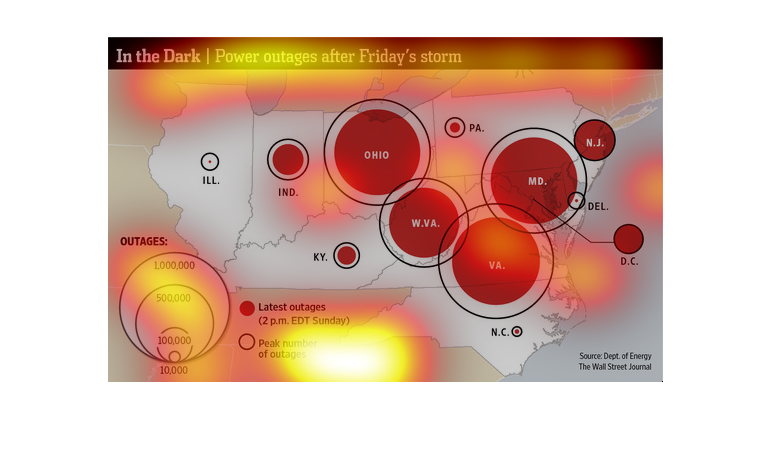
A power outage has swept the northeastern coast, and the blackouts have been widespread, but
primarily centered on heavily populated areas as this still informs us.
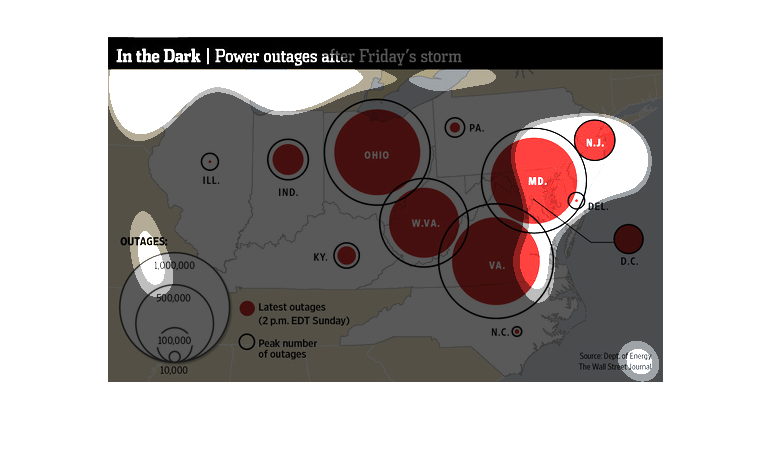
This is a map of the mid-east region of the United States with overlaid related statistics
depicting the areas with power outages following a storm. Ohio is shown to have had the most
outages.
The image depicts power outages after Friday's storm. The east coast of the US appears to
be heavily affected, with outages stretching to the Midwest affecting Ohio.
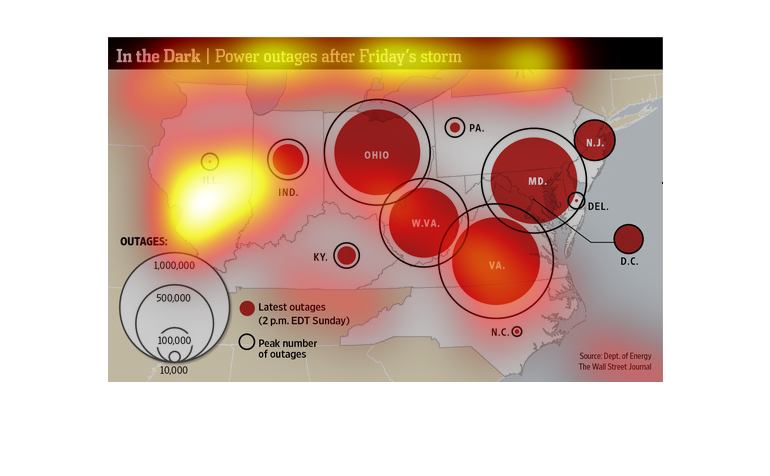
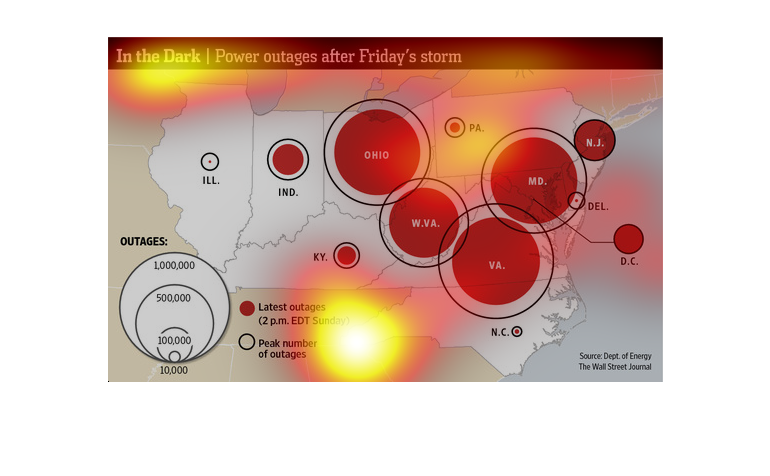
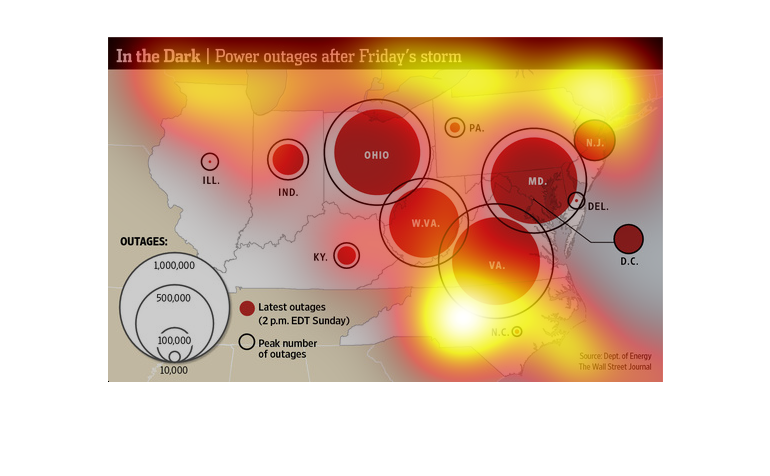
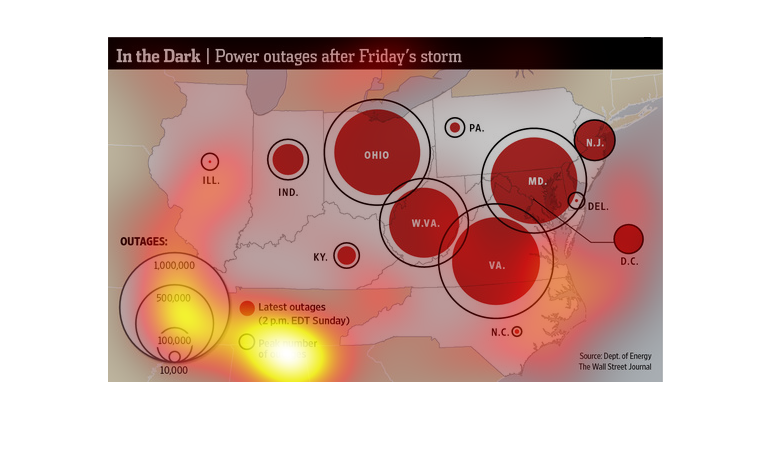
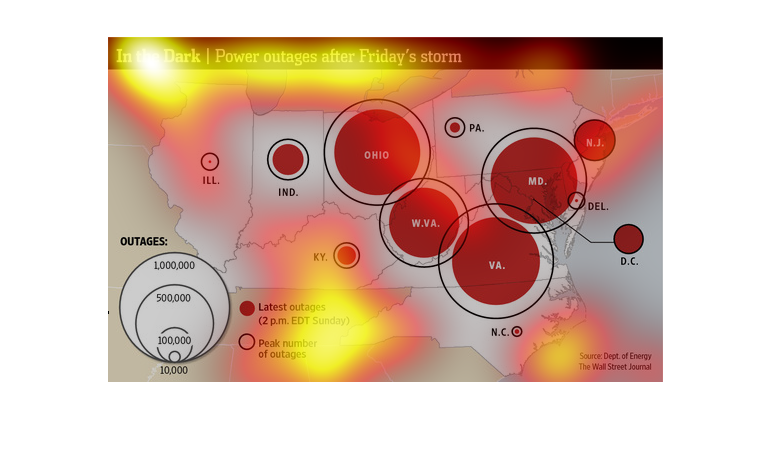
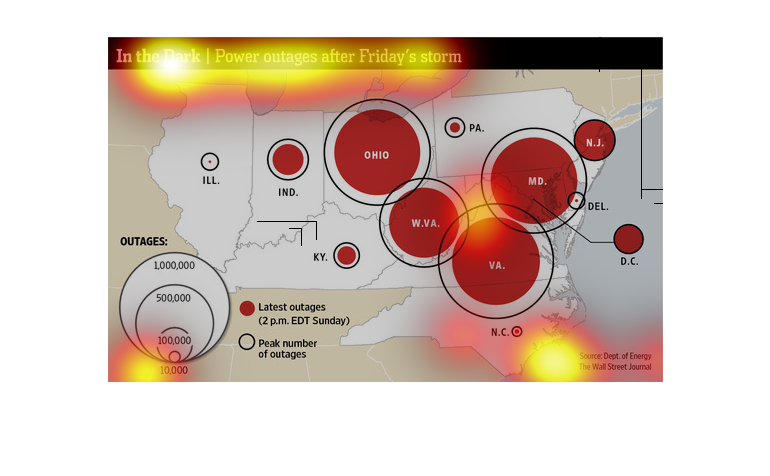
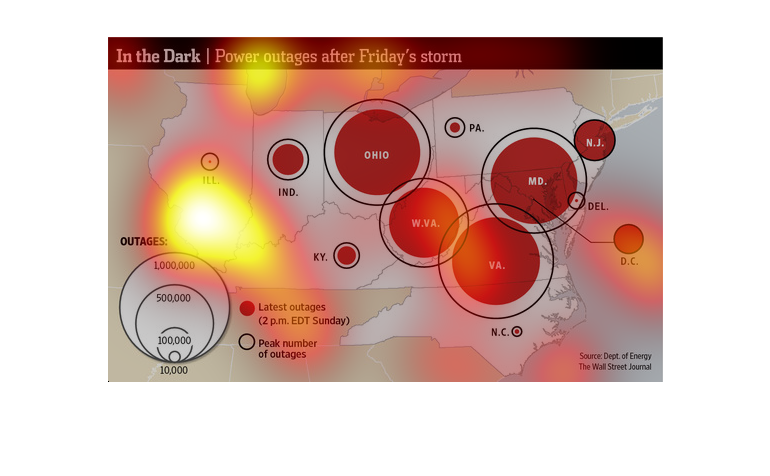
This chart from the Wall Street Journal shows how power outages are prevalent in Florida after
a major hurricane. Other than that it is hard to read what is going on
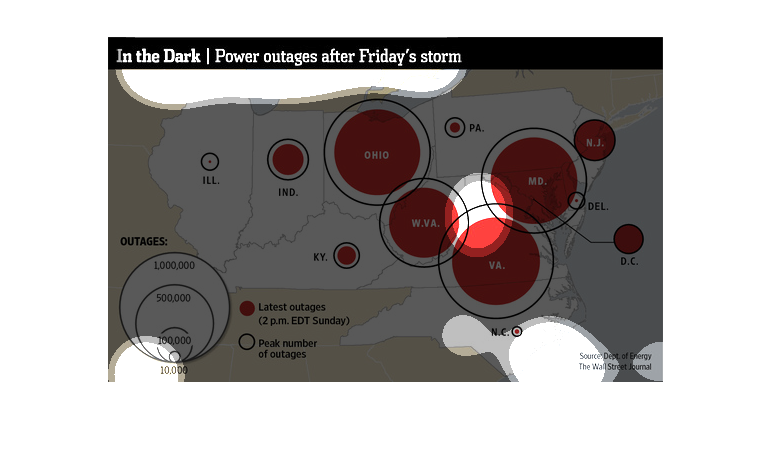
Map reveals the power outages that have hit after a storm on a particular Friday. This map
is presented by the Wall street Journal. The date comes from the Department of Energy. The
outages are across NJ, MD, VA, W.VA, Ohio, D.C, etc
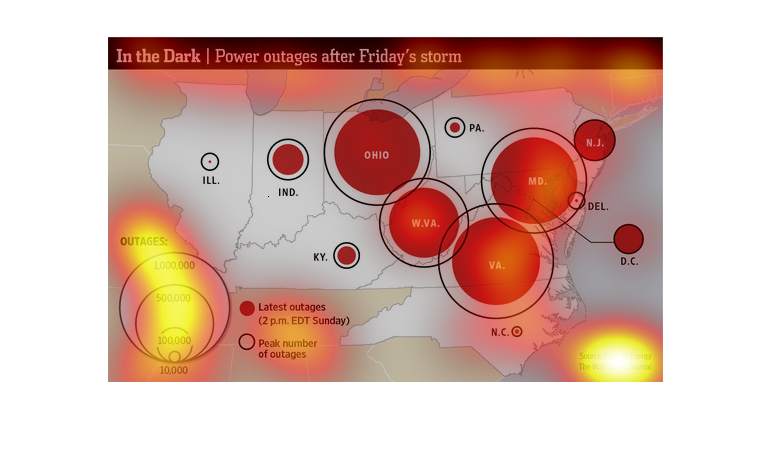
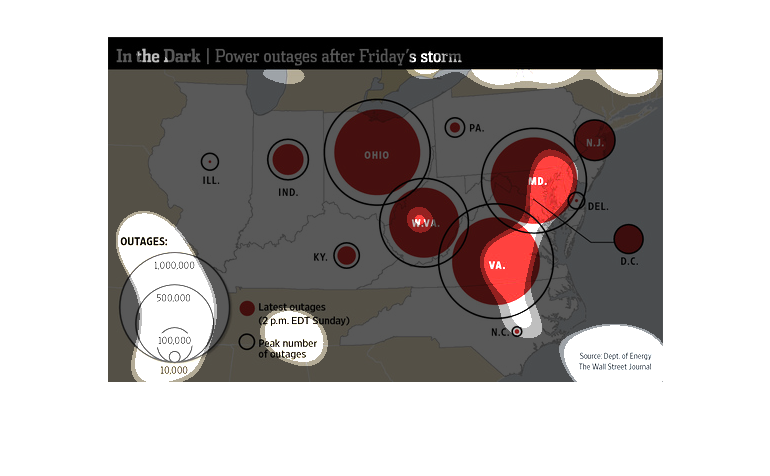
Power outages after Friday's storm is the name of this chart. This chart is showing the number
of cities and counties that are suffering from power outages. It shows states from the east
coast all the way inward to Illinois.
This is a map of part of the united states of america and it shows many different circles
which tell about power outages that happened in these areas shown.