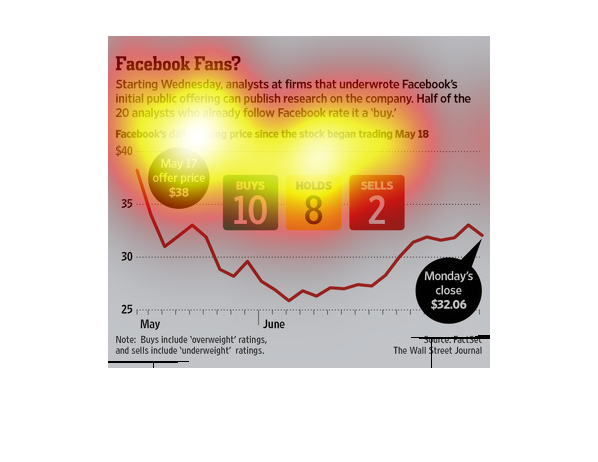
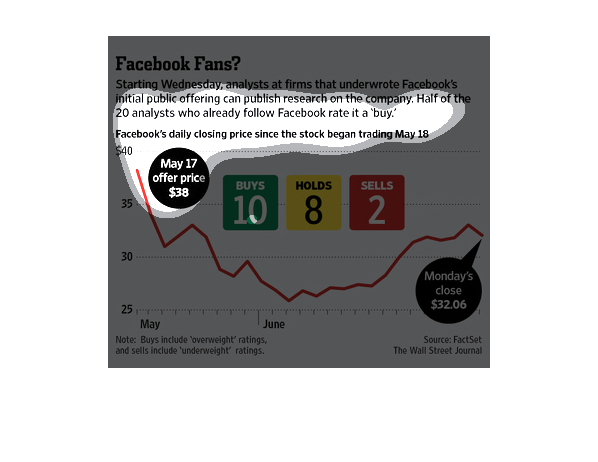
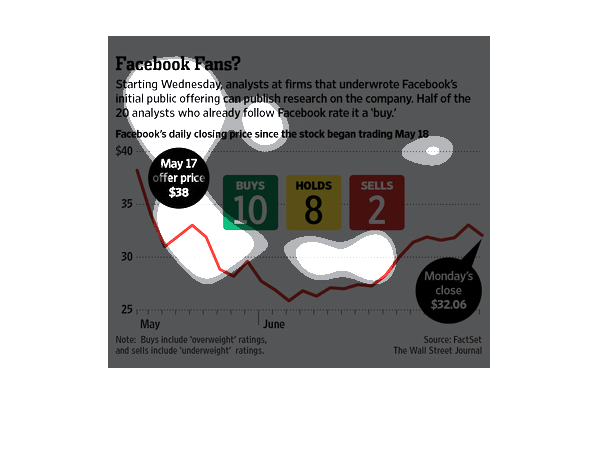
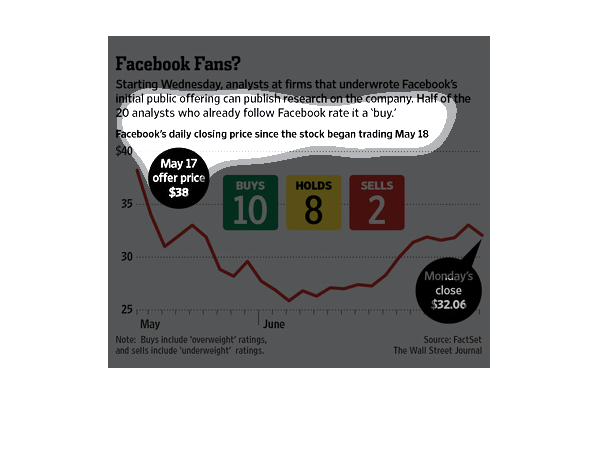
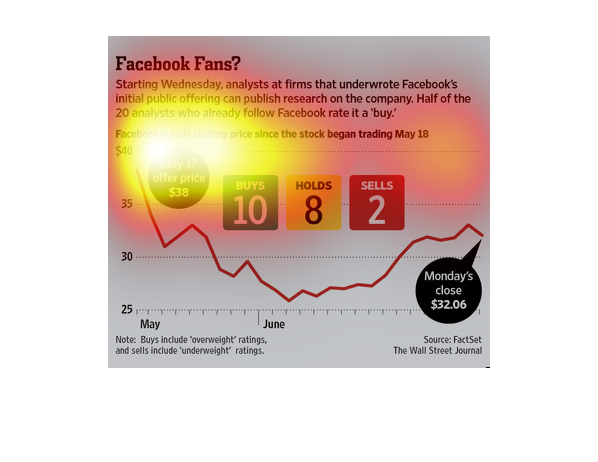
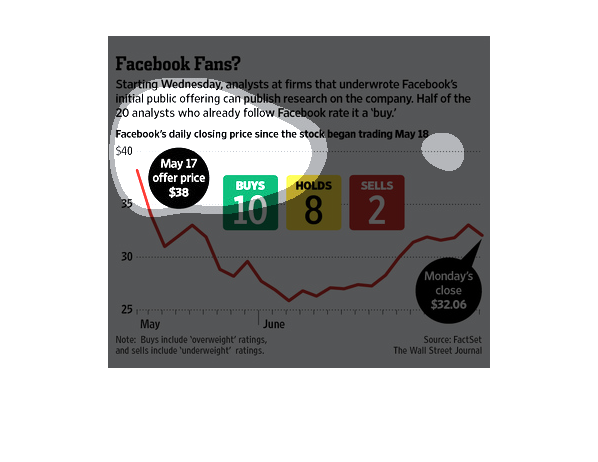
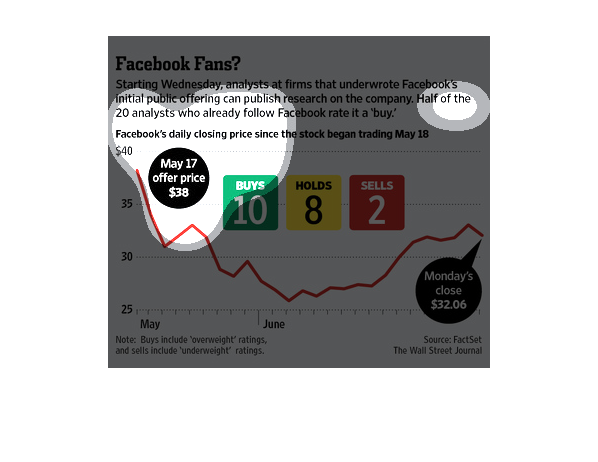
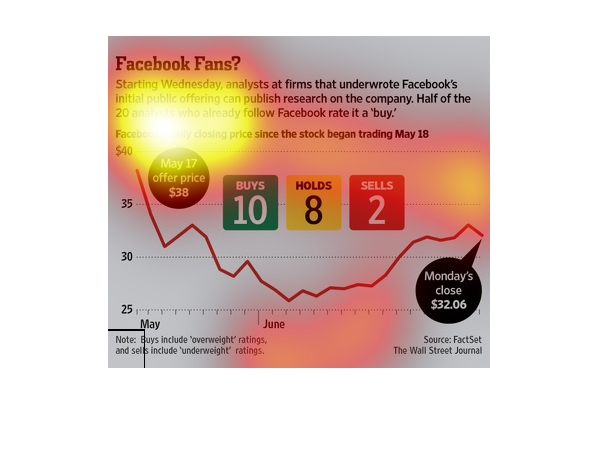
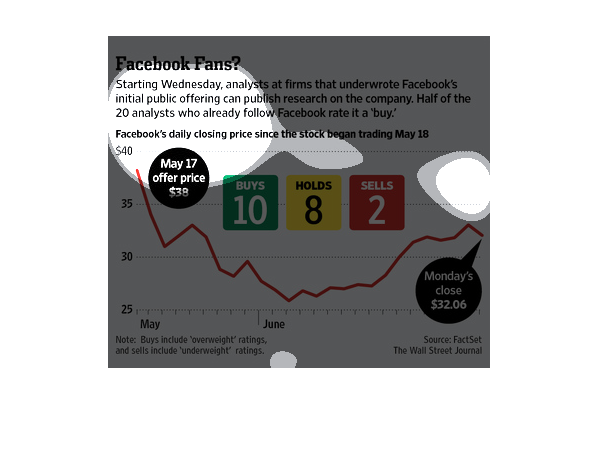
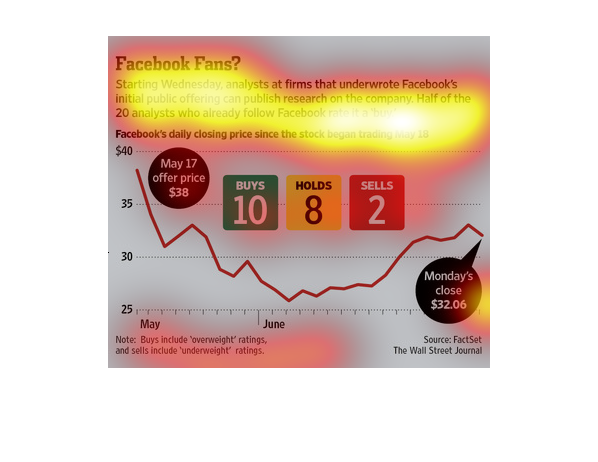
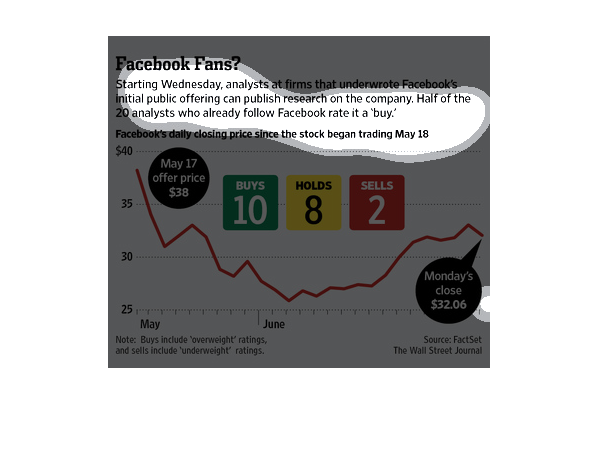
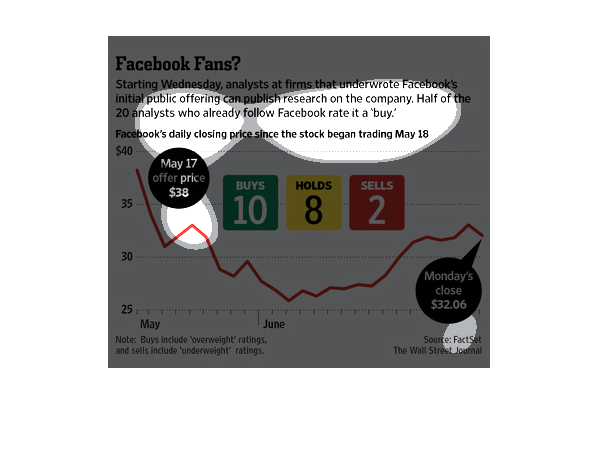
The chart shows how the analysts that underwrote Facebook's initial purchase offering rate
the company. Ten analysts rate it as a buy, 8 as hold and 2 recommended to sell the stock.
Facebook began trading May 18, and from an offer price of $38 on May 17, the stock closed
at $32.06 on Monday.
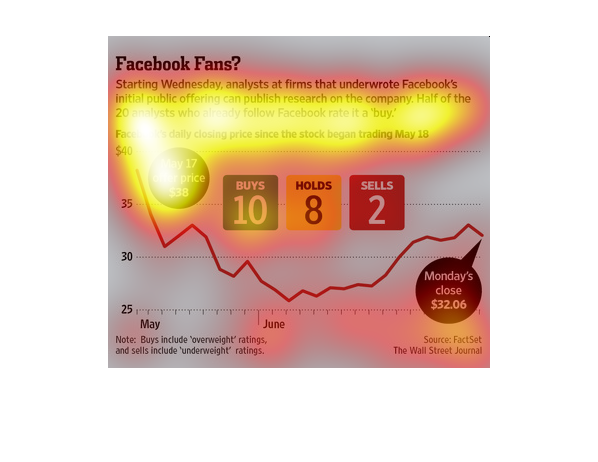
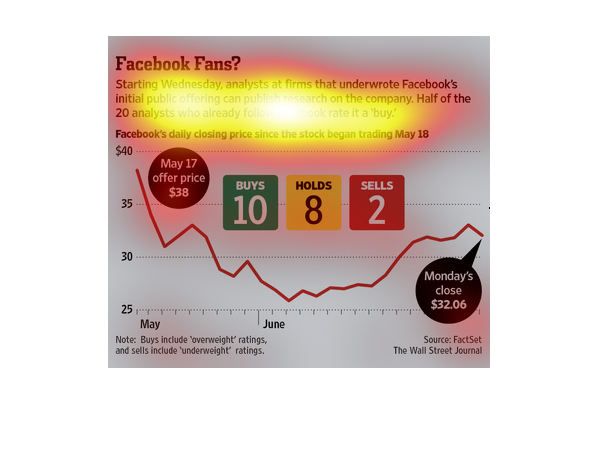
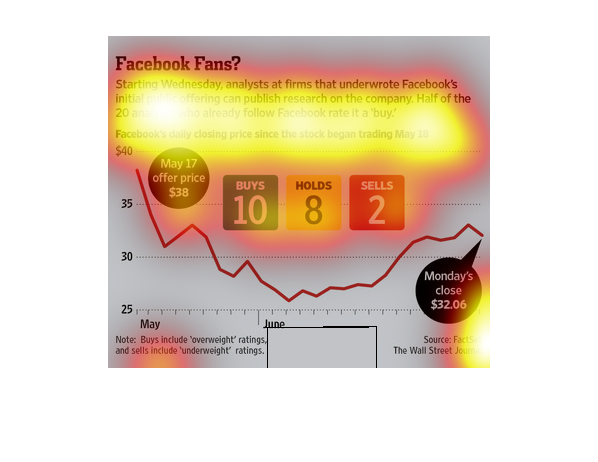
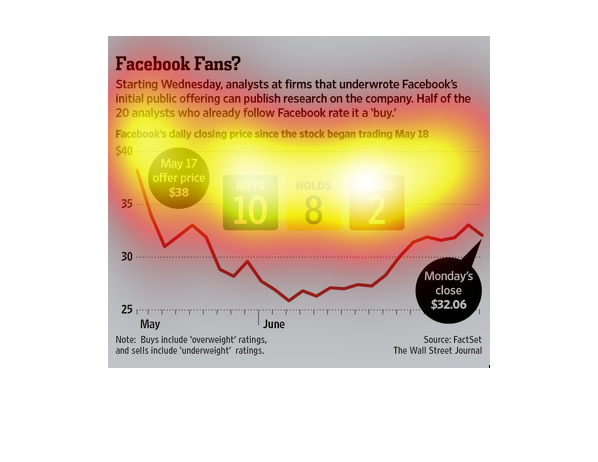
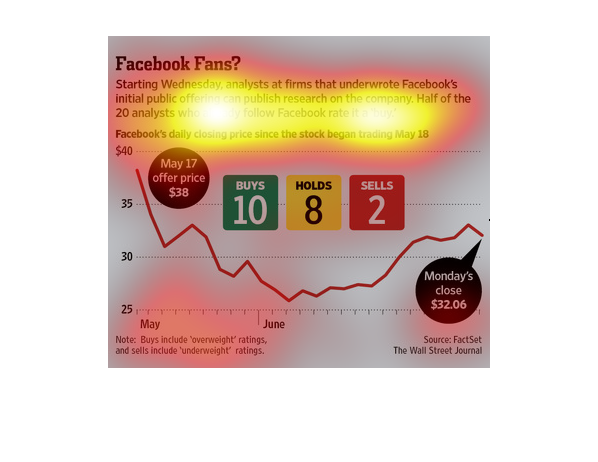
This chart shows the initial public offering of Facebook's stock. Overall, the price dropped
from 38 dollars to 32.06 dollars, meaning it could be a good time to buy.
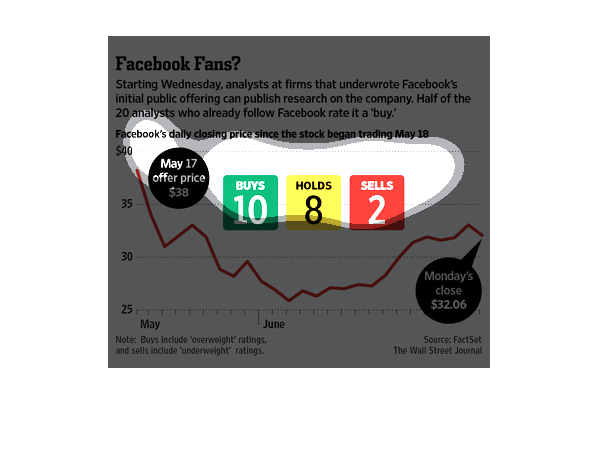
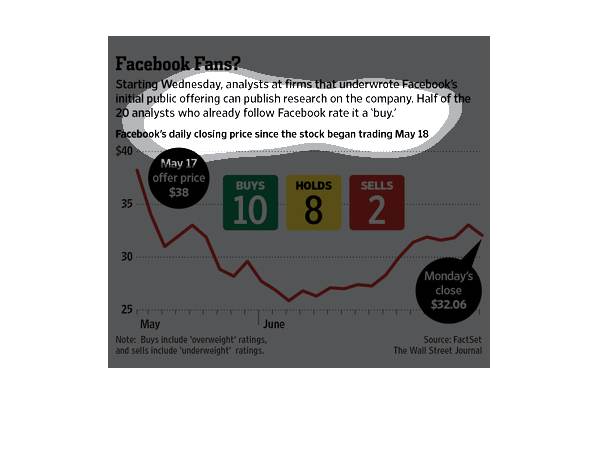
This image is discussing Facebook Fans and the statistics in which they have been offered
a price within a specific time frame. The offer price is given, the buys, the holds, sells,
as well as the time frame's close for the following stats.
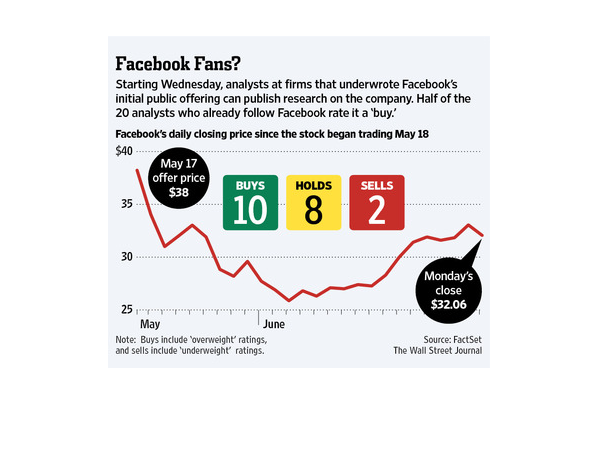
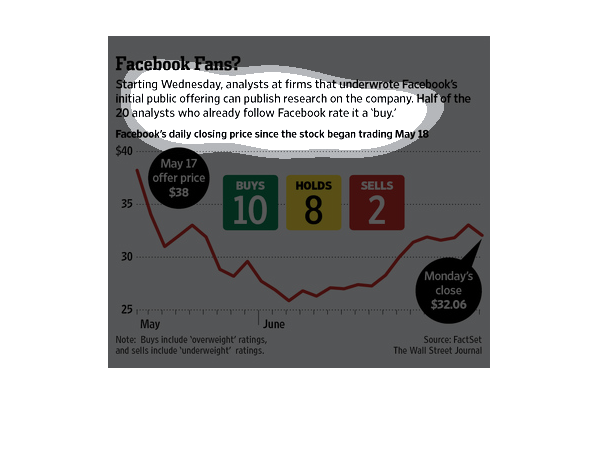
This chart illustrates Facebook's daily closing price since the stock became an IPO in May.
 It shows the offer price, buys, sells and holds during the period.
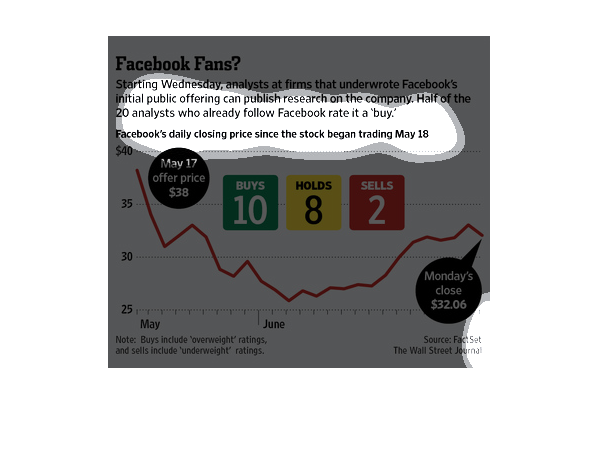
It's labeled facebook fans? It shows facebooks daily closing price since they began trading
stock. There is a read line grab showing stock prices across may and june. It shows in large
letters the holds, sells, and buys, and next to that the offer price of $38 on may 17.
Facebook has been written off my analyst as this graphic leads us to believe, several analyst
said so. But the truth is Facebook has strong stock and can weather the storm.
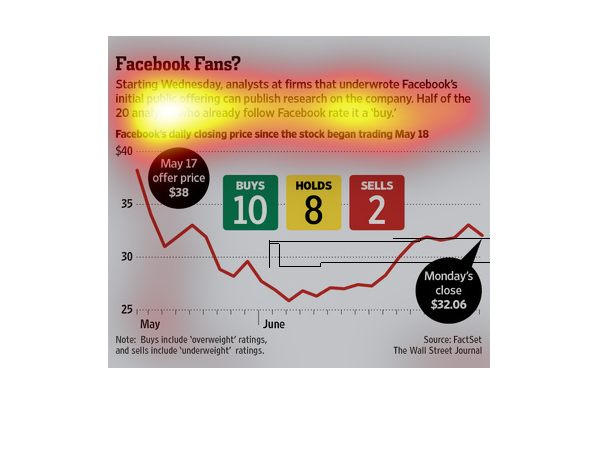
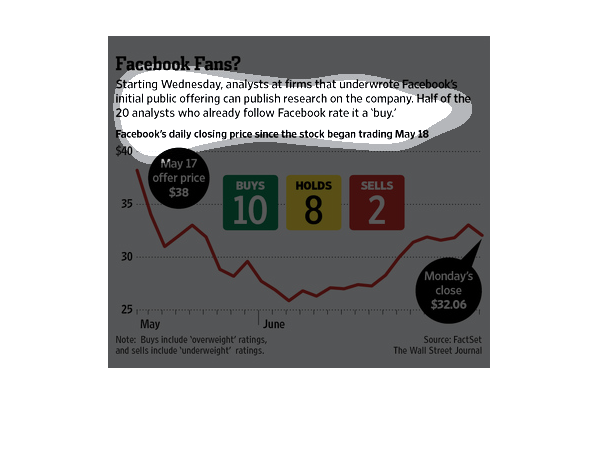
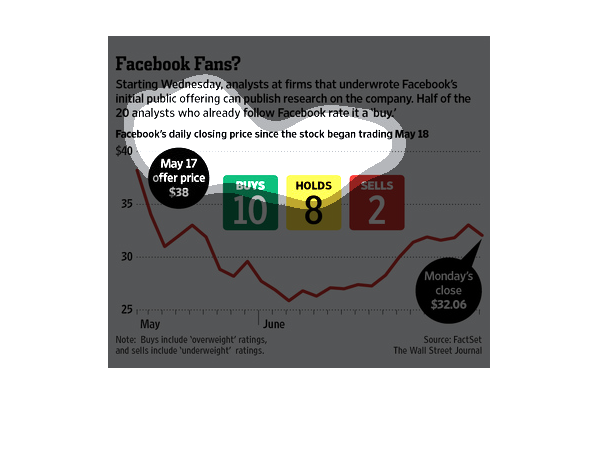
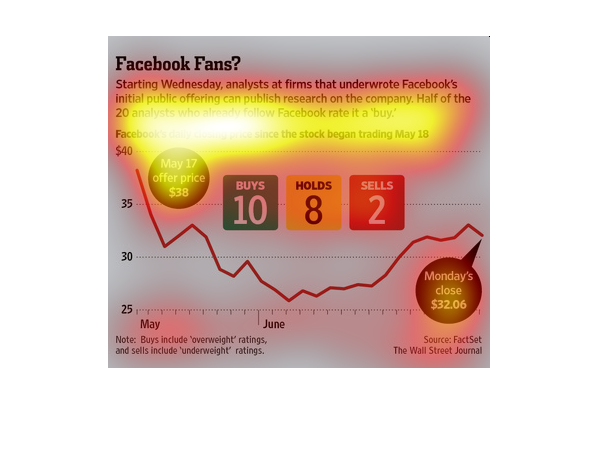
The title of the graphic is facebook fans. It says that starting Wednesday, analysts at firms
that underwrote Facebook's initial public offering can publish research on the company.
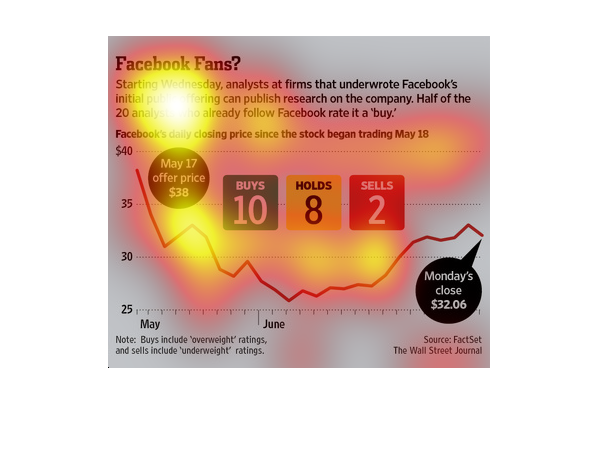
This chart from the Wall Street Journal shows how the facebook IPO went and how researchers
can now publish equity reports on the stock after a cool off period
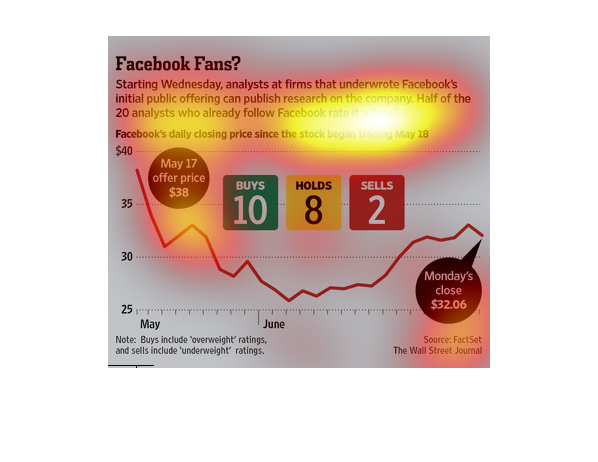
This graph details Facebook's daily closing price since it started as an IPO from a $38 per
share price to a $32 per share price steadily decreasing downward.
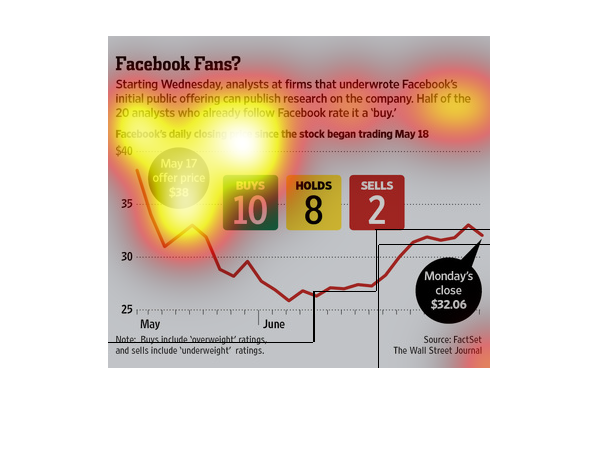
This chart from the Wall Street Journal shows how public equity researchers are mixed on Facebook
right after its IPO, with 50% saying buy and the oher 50% saying sell
This chart is about Facebook and shares, or stock, in the company.  It shows the different
close amounts for different days and how much each share was worth.  The chart begins showing
data for a Wednesday and moves on from there.
The graph shows the average daily rate of buying Facebook stocks since the stock began trading
on May 18th in the light of analysts now being offered to 'buy' stocks if they worked on the
original Facebook.
The image depicts analysts forecasting a positive future for facebook stock, and proactively
urging people to purchase fakebook stock based on earlier underwriting of the stock at the
initial IPO offering.
This chart describes Facebook fans. Specifically, starting Wednesday, analysts at firms that
underwrote Facebook's initial public offering can publish research.