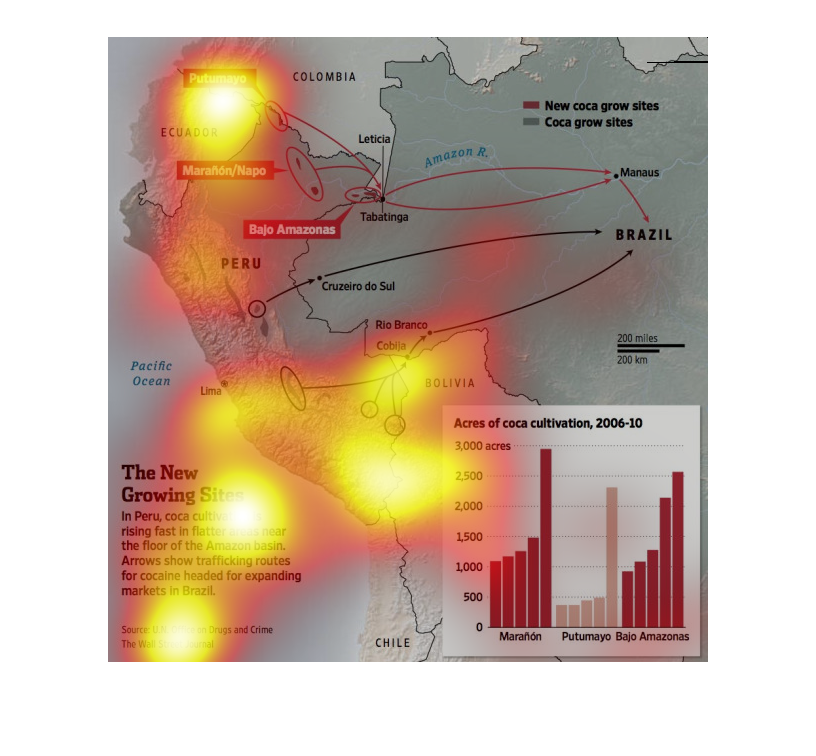
This is a map of Peru and it is describing the rate of coca that they are growing. There is
a small graph as well showing the amount growing over a certain timeframe.
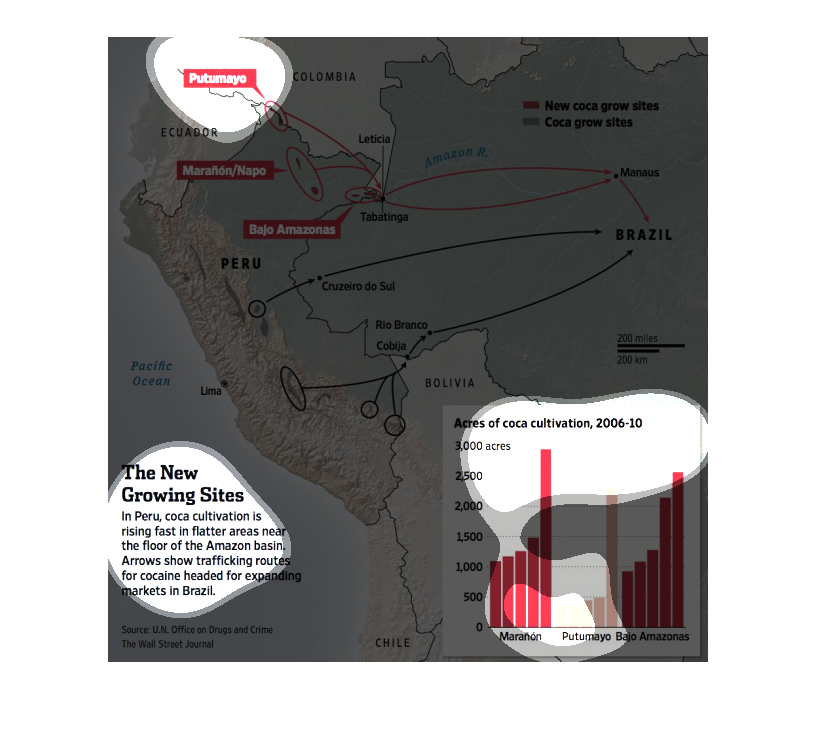
The image describes the new coca cultivation sites in Peru.  The trend shows a great increase
in cultivation in the areas over the last several years (2006 up to 2010).
This is a map illustrating coca cultivation rates for cocaine trafficking in Peru from 2006
to 2010 and what areas are expanding in cultivation as well as decreasing.
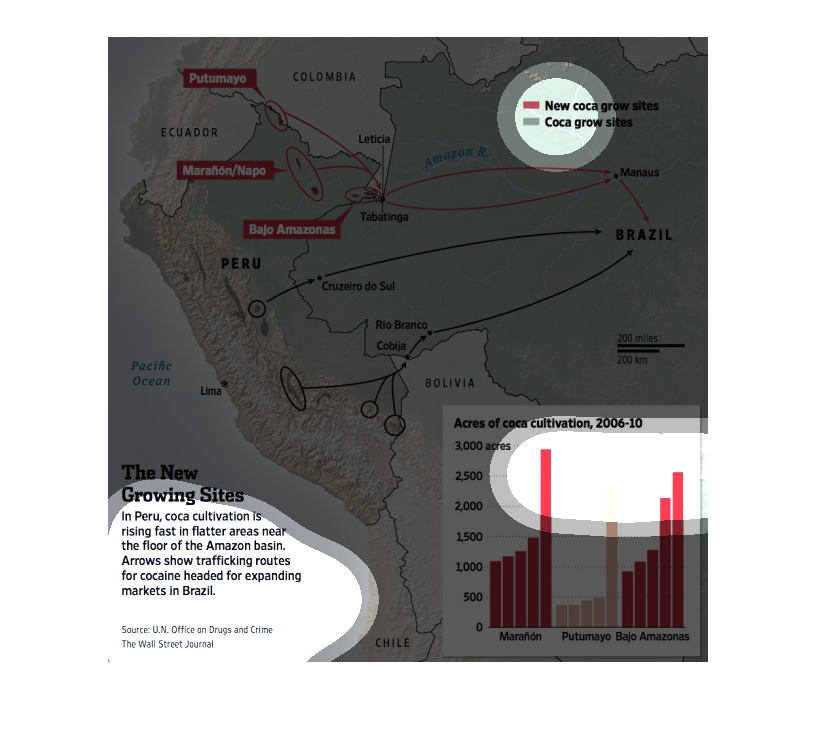
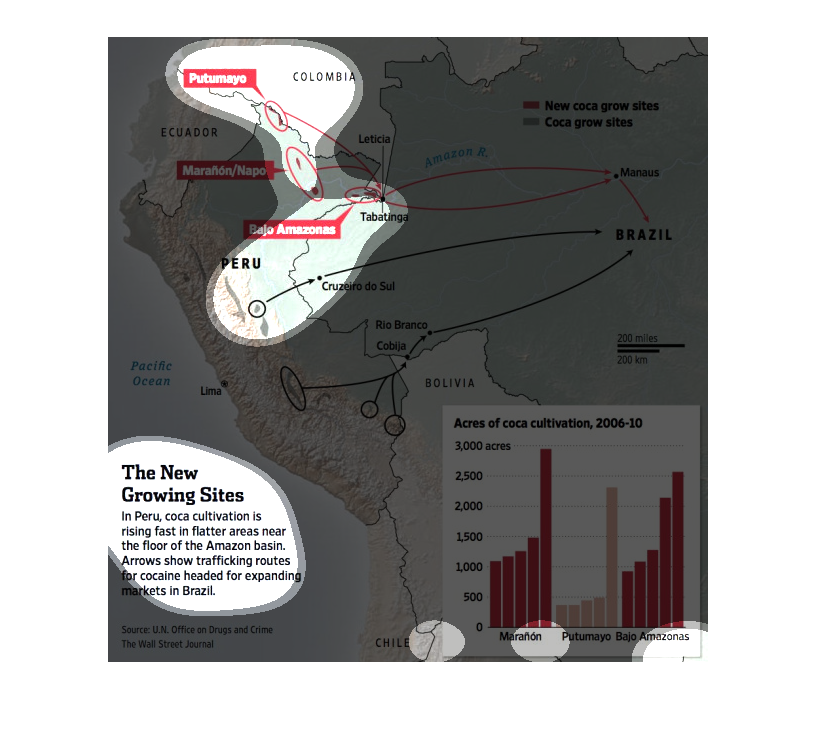
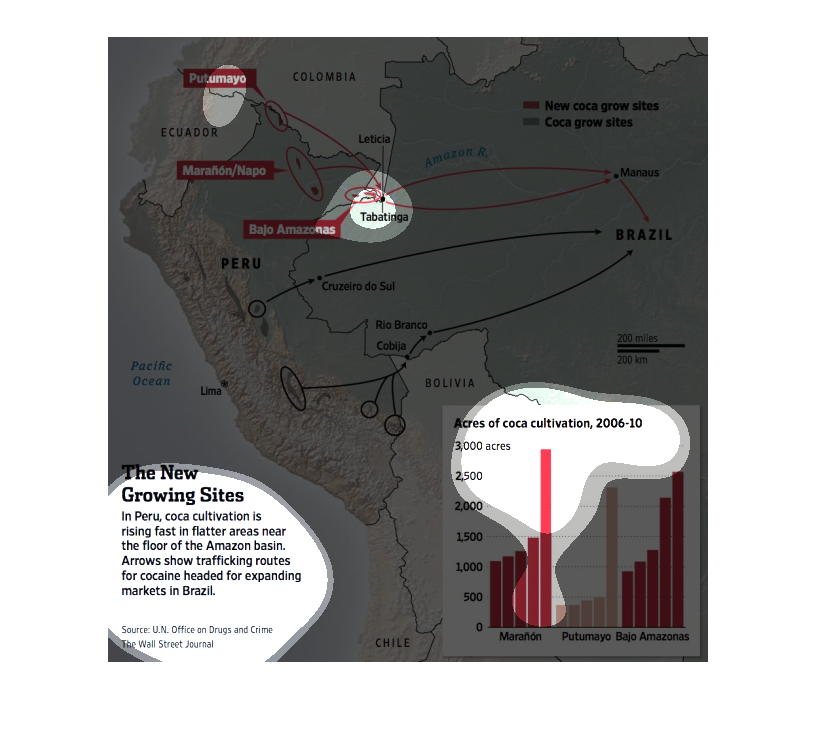
This chart describes the new growing sites. Specifically, In Peru, coca cultivation is raising
fast in flatter areas near the floor of the Amazon basin.
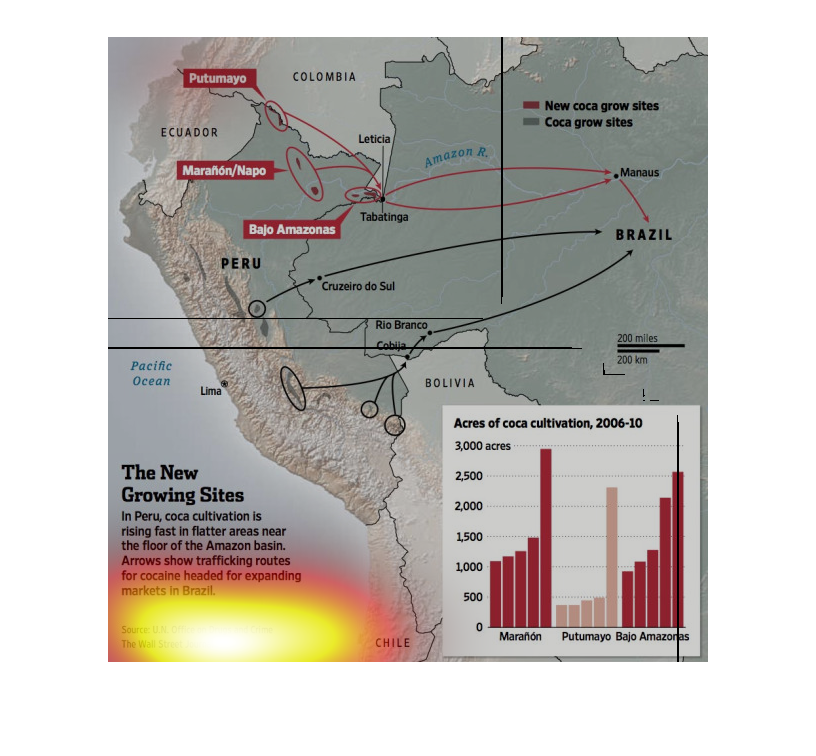
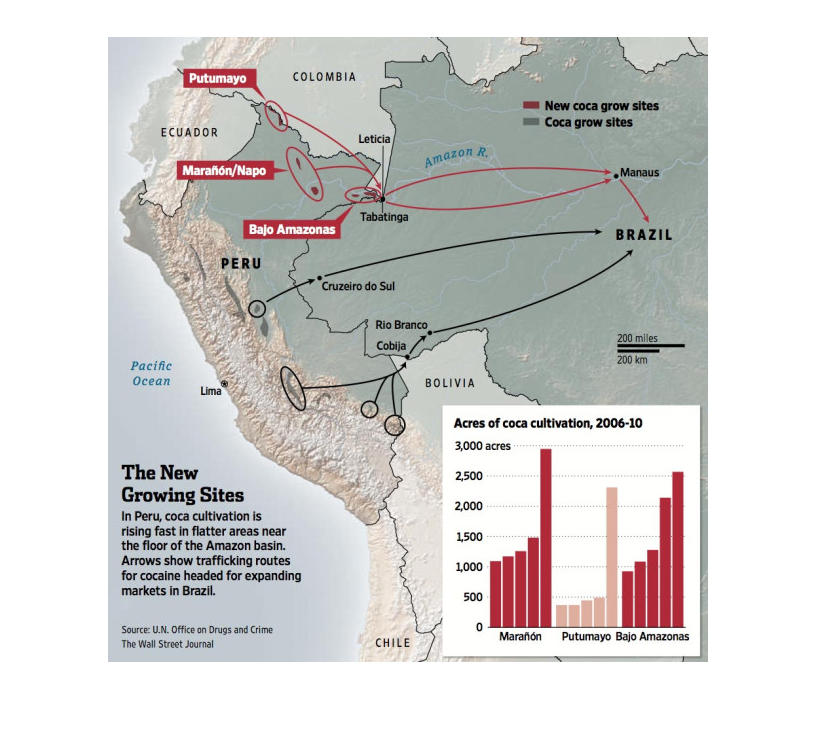
There are two figures in this graphic. There is a graph showing the acres of coca cultivation
from 2006-2010 in different cities in Ecuador. There is also a map showing the same..
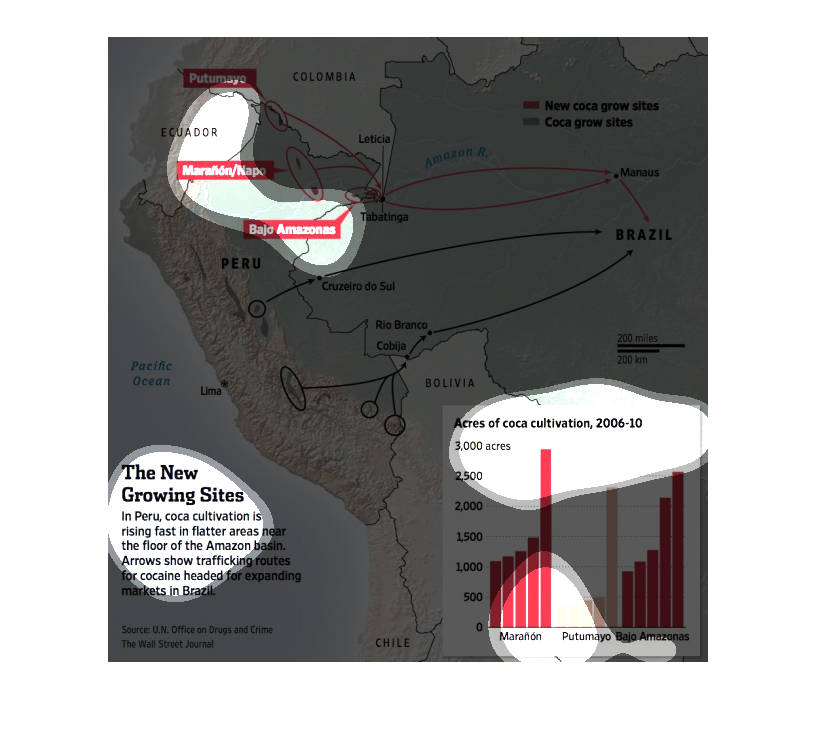
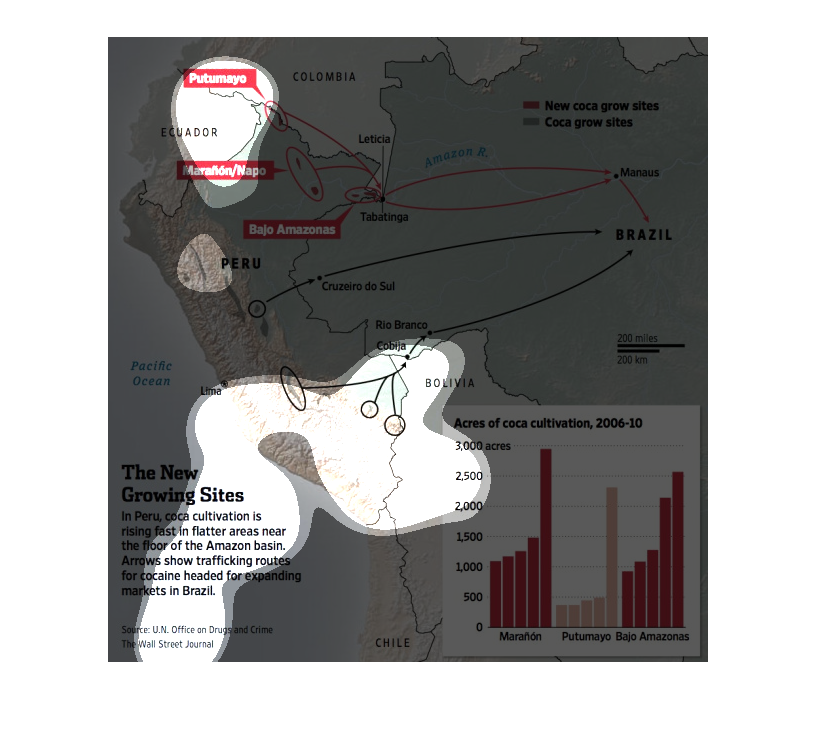
This image shows a map of Peru and popular sites for growing coca. It also uses arrows to
show routes for smuggling cocaine towards Brazil. Coca cultivation has increased.
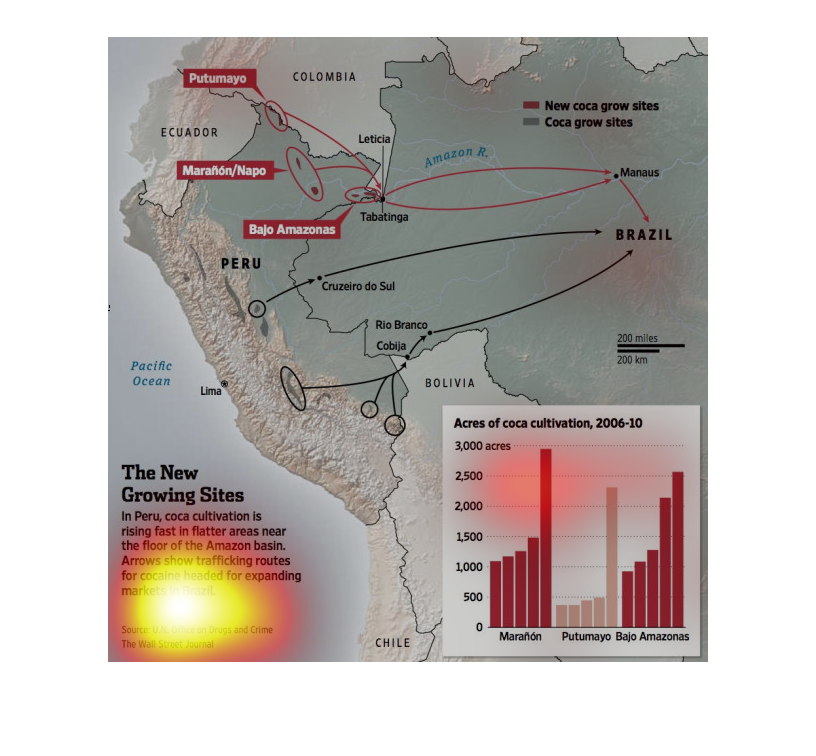
This study states that the production of Coca leafs is at an all time high in countries like
Peru, Brazil, and Ecuador. This has caused much strife as in the dealing of a lot of drugs.
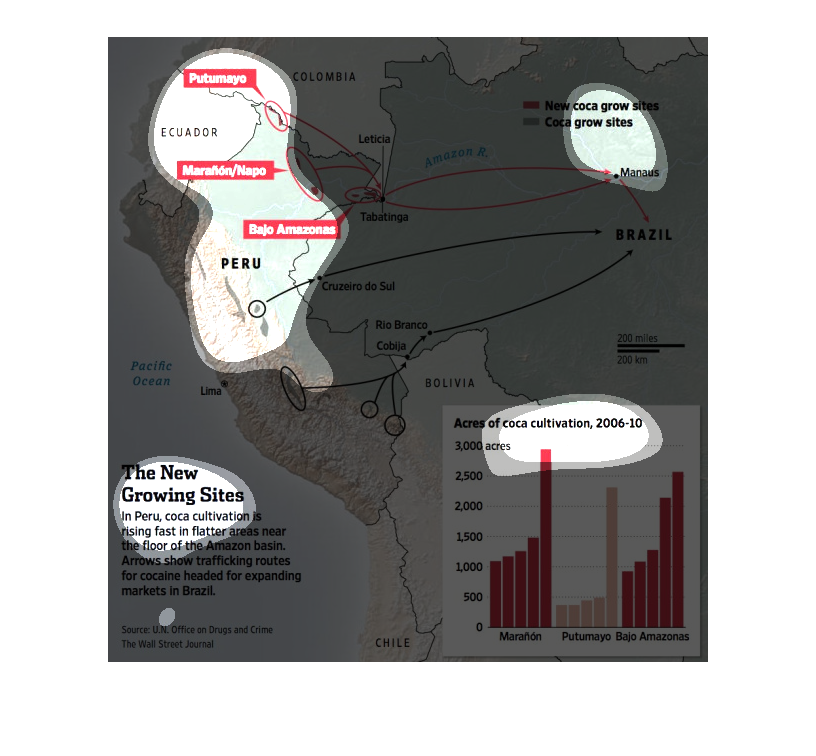
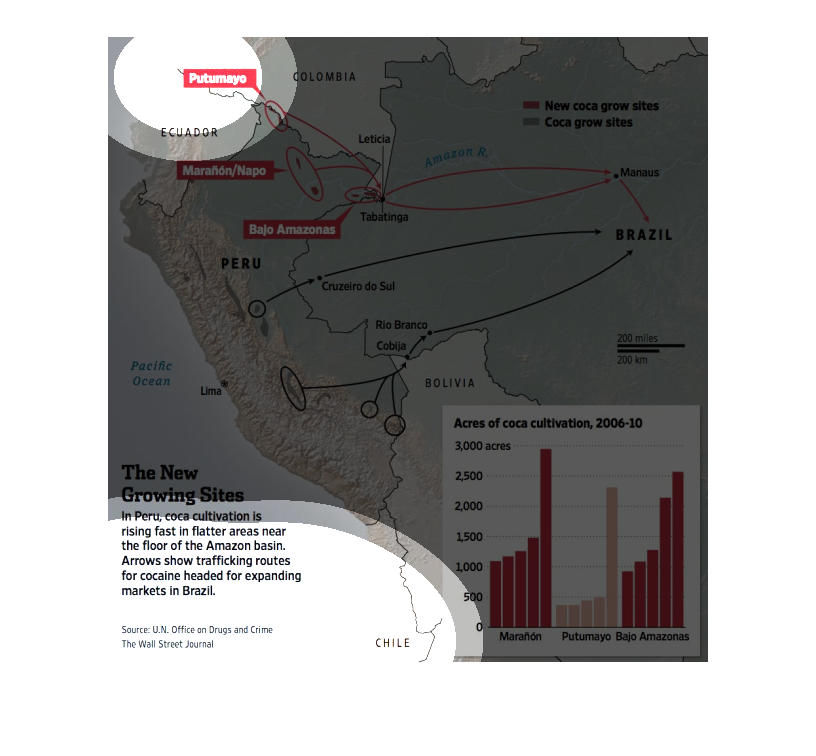
This is a map of the region around Peru and related statistics depicting that in Peru cocoa
cultivation was rising fast in flatter areas near the floor of the Amazon.
The image depicts coco cultivation in Peru rising fast in flat areas which are closer to the
Amazon basin. The image also shows the direction of expanding cocaine trafficking in the country.
Many routes lead to Brazil and to the east.
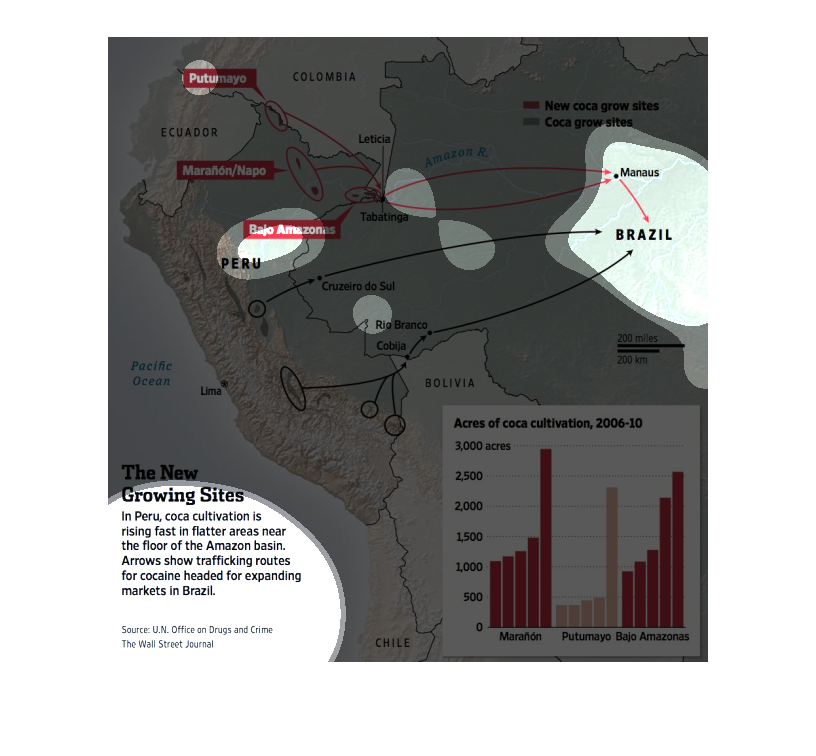
This chart describes the new growing sites. Specifically, in Peru coca cultivation is rising
fast. Different categories are represented by different colors.
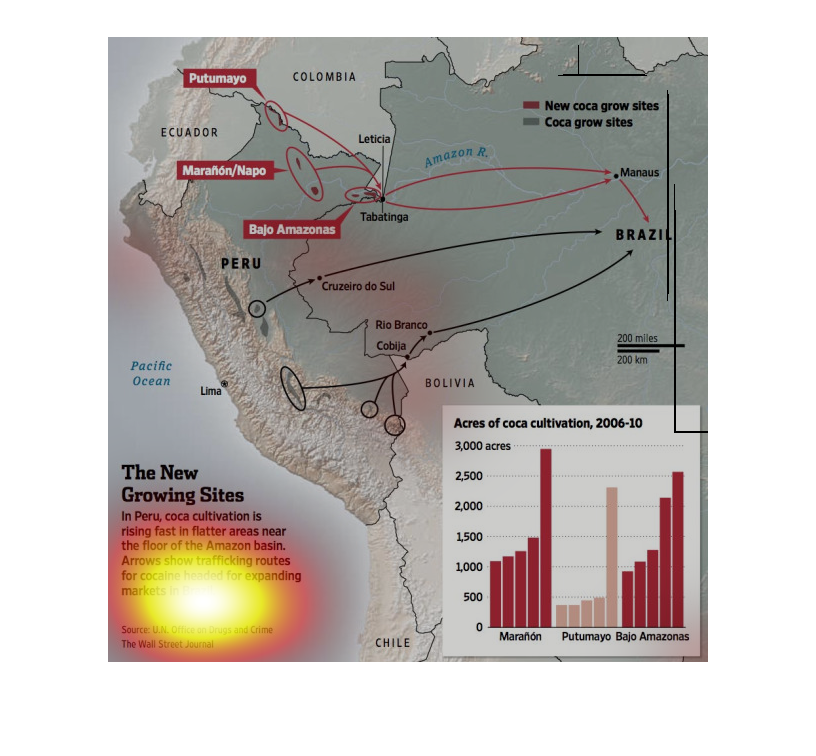
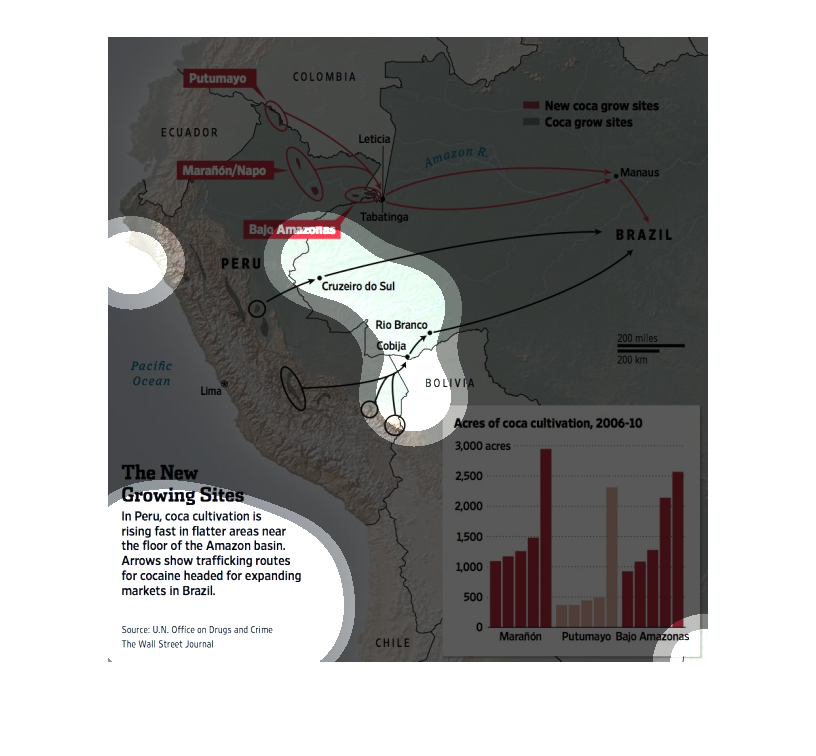
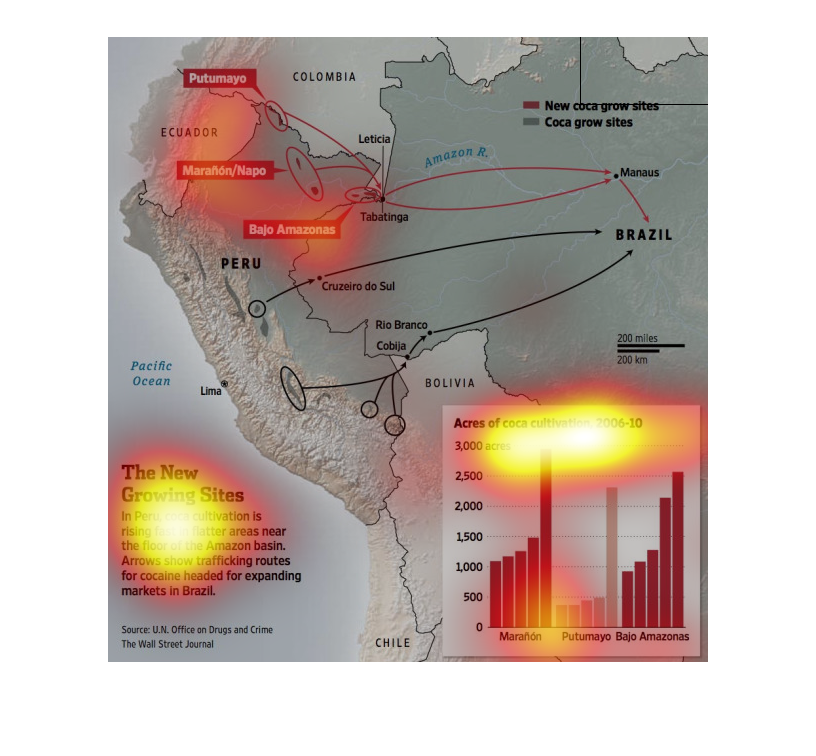
This chart from the Wall Street Journal shows how cocaine plant, or coca, is being grown in
Peru and how it is growing in prevalence in the country.
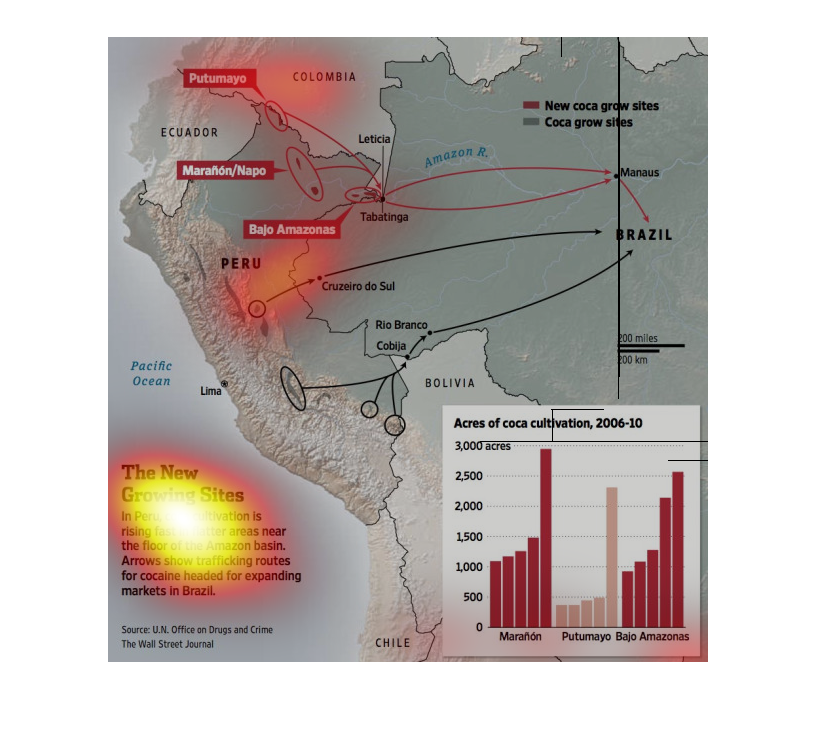
This chart from the Wall Street Journal shows how coca plant production is increasing in Peru,
which is a major precursor to cocaine production.,
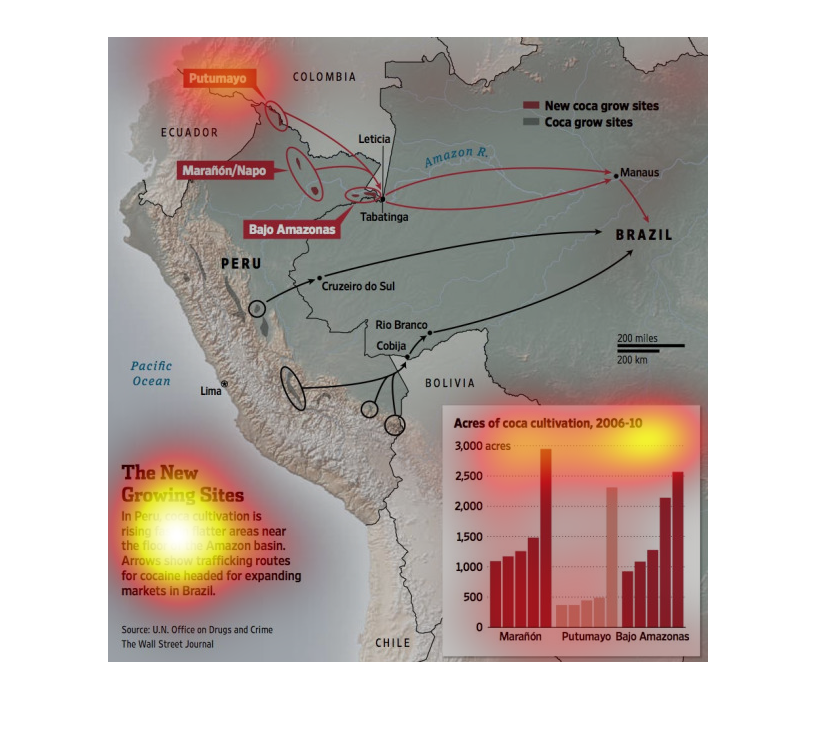
The image is a map with a legend chart that shows an increase in coca production in Peru between
2006-2010. Also depicted are traffic routes for cocaine headed towards Brazil
In this map provided by the Wall Street Journal- with various sources cited as contributing
to the research- we see that there is abundant supply of coca leaf production in South America.