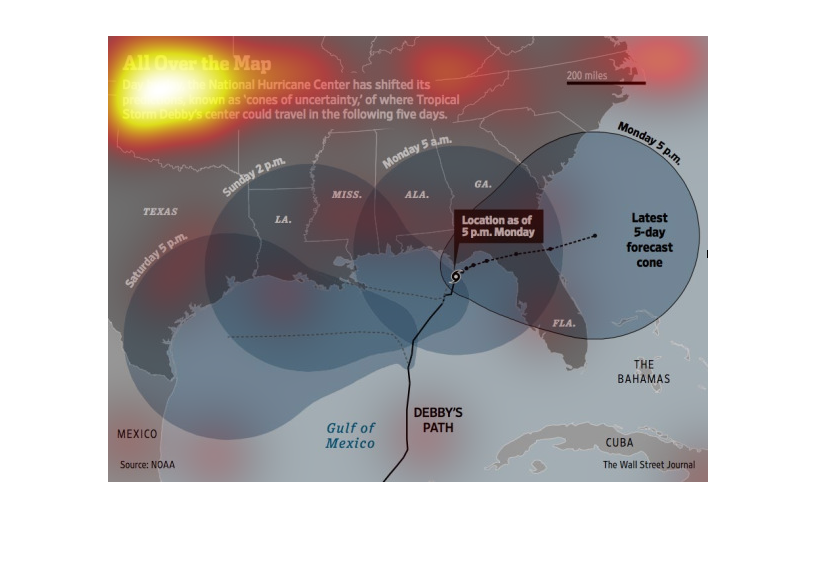
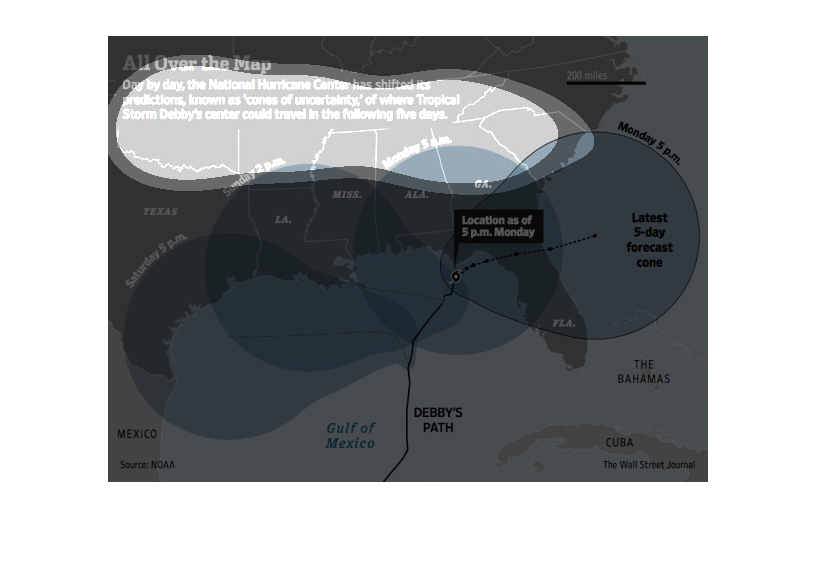
This chart is called All over the map. A day by day look at hurricanes. A look at Storm Debby.
 The National Hurricane center has shifted its predictions known as cones of uncertainty of
when Storm Debby could travel in five days.
This is a map of the predicted locations where the National Hurricane Center believes that
tropical storm Debby may travel in the future including its current path and prior locations
and times.
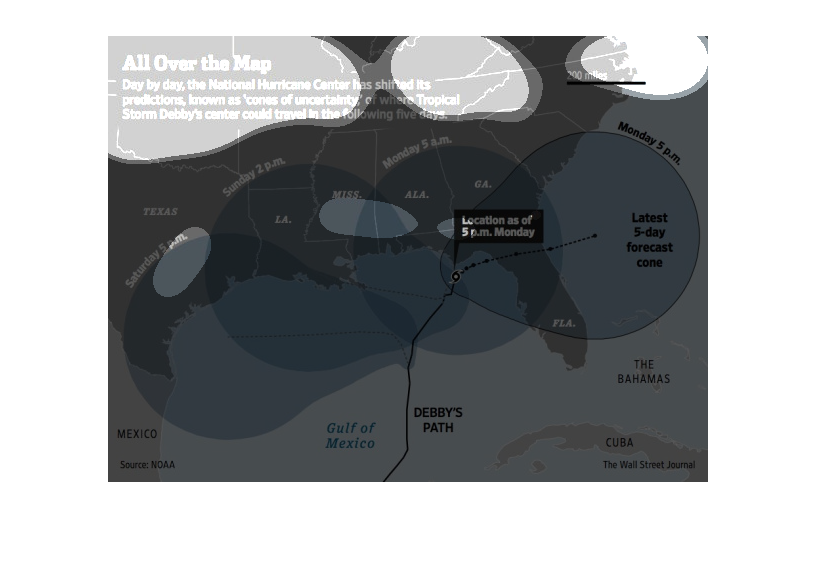
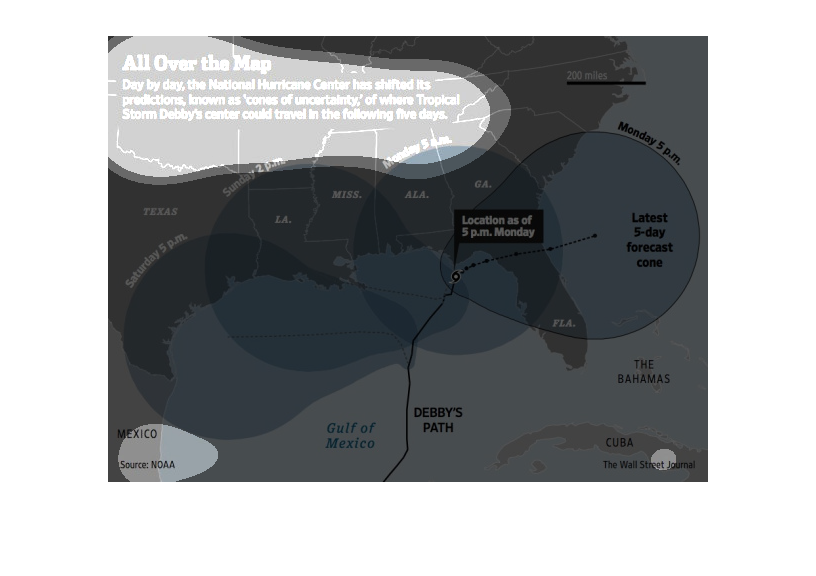
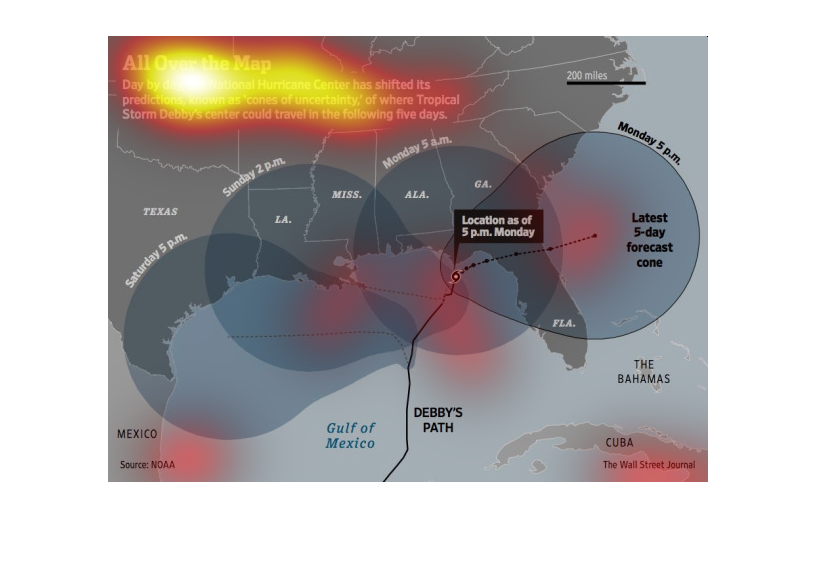
This chart describes all over the map. Specifically, day by day, the national hurricane center
has shifted its prediction known as "cones of uncertainty" of where tropical storm Debby's
center could travel.
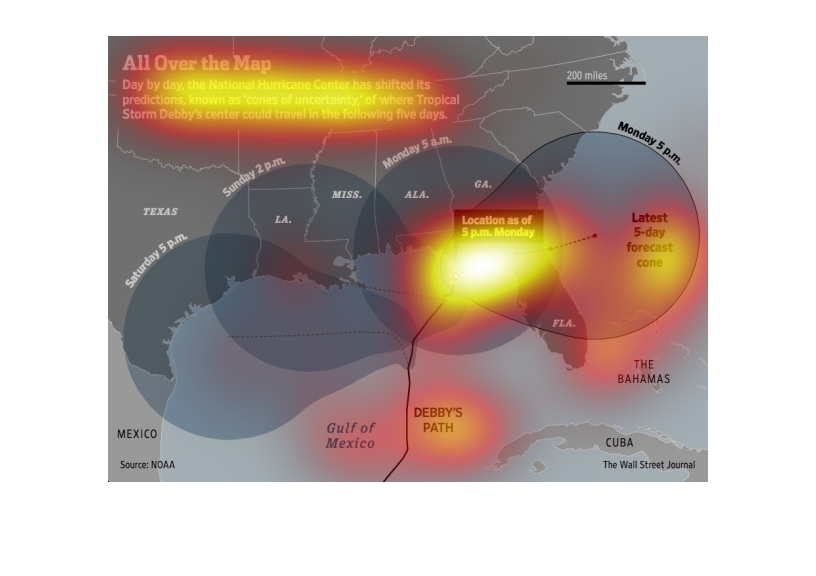
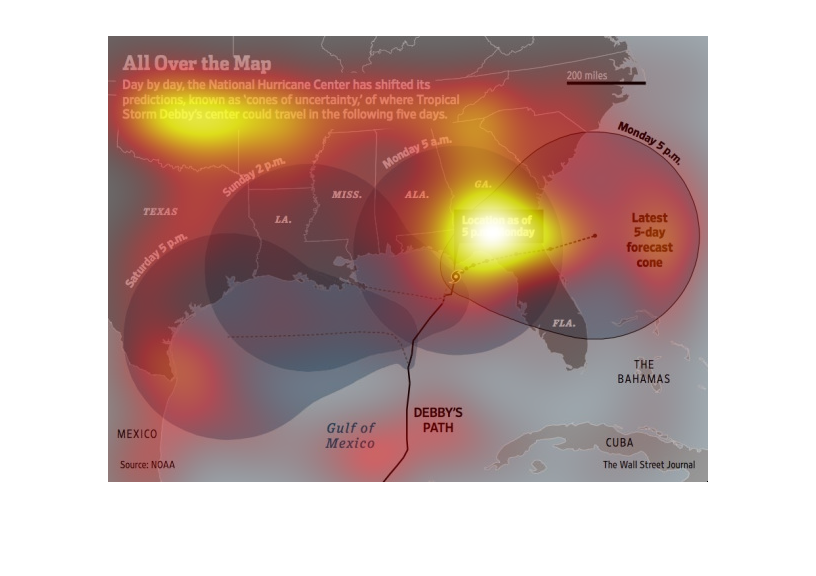
In this study conducted by the Wall Street Journal from resources obtained from the NOA, we
see the trajectory of the storm Derby, and how the storm with impact the southern states near
it.
The image here is of the Gulf of Mexico and the surrounding states in the United States.
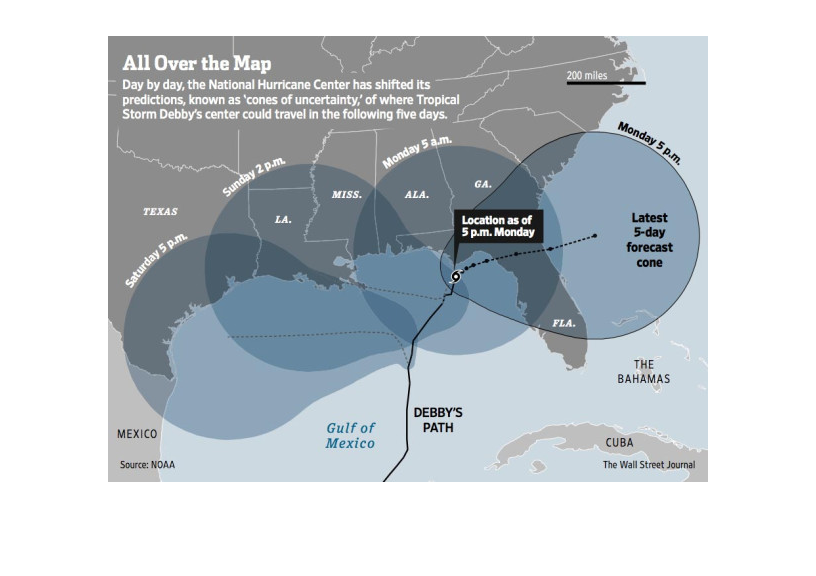
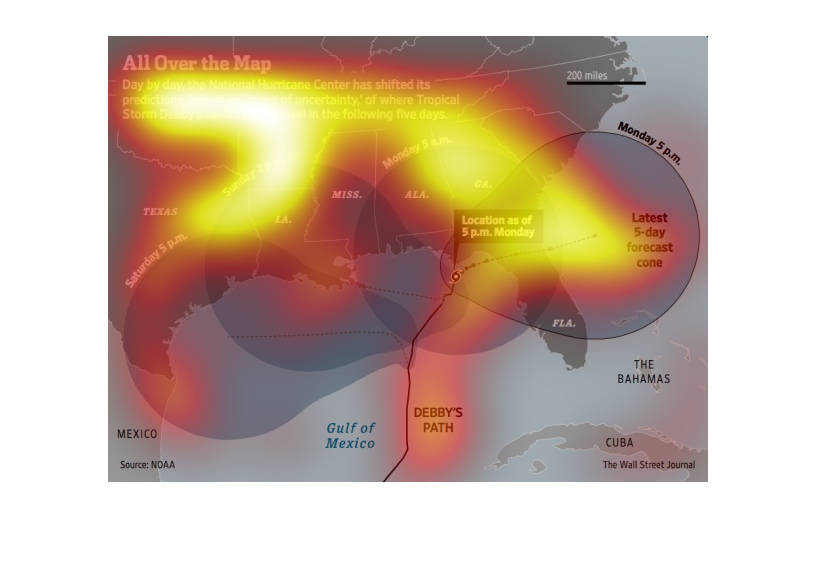
The caption for the image is, "All over the map". The information contained here displays
various possible route paths for hurricane Debby, as forecasted by the National Hurricane
Center.
This is a map of the Eastern United States with related statistics overlaid depicting the
forecast track for tropical storm Debby, which is noted as being a difficult track to narrow
down.
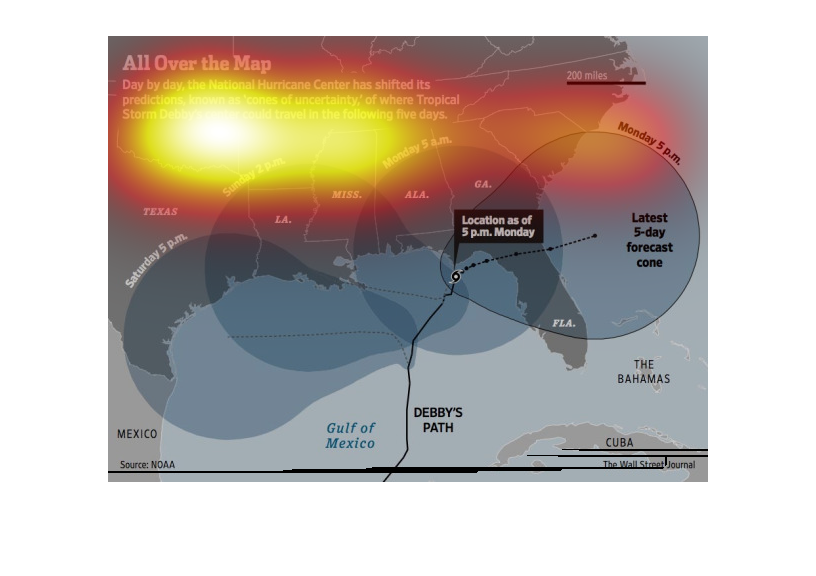
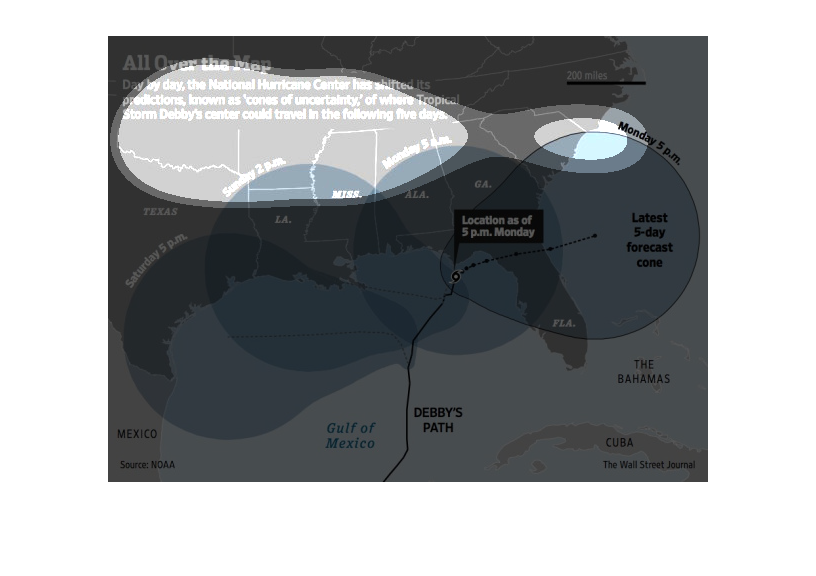
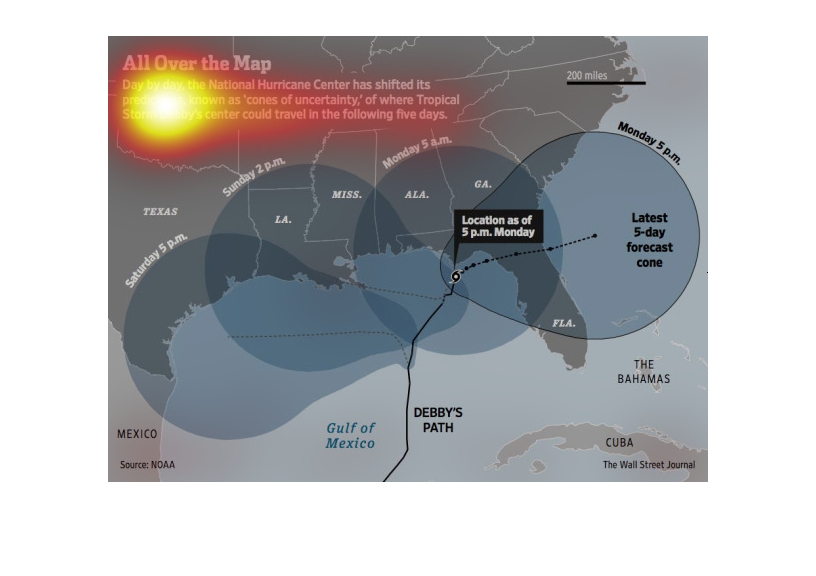
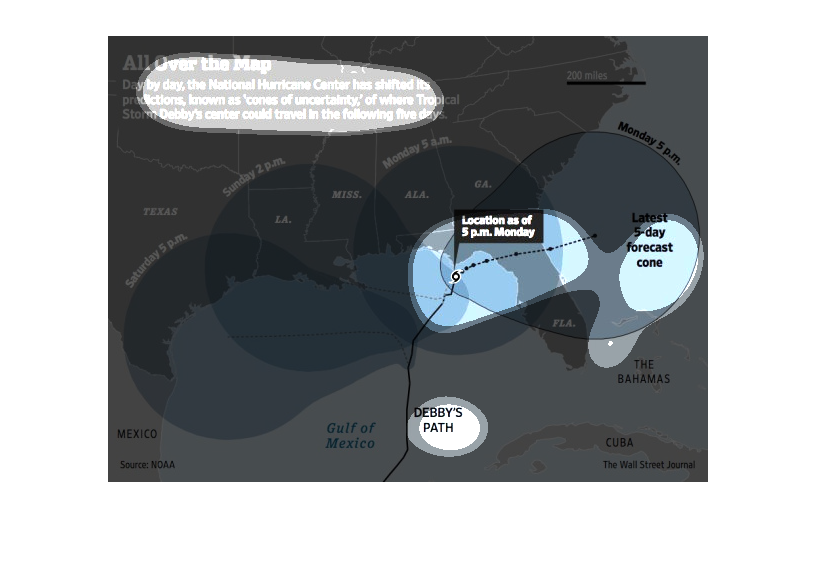
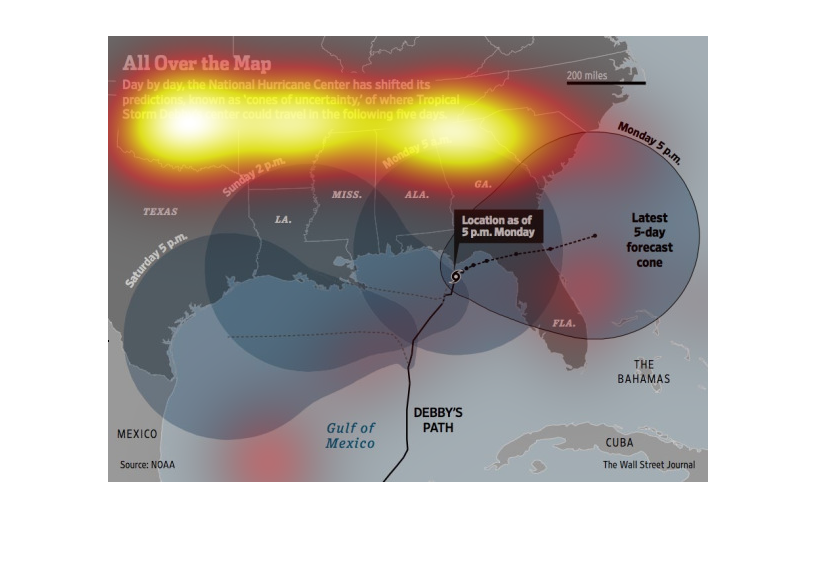
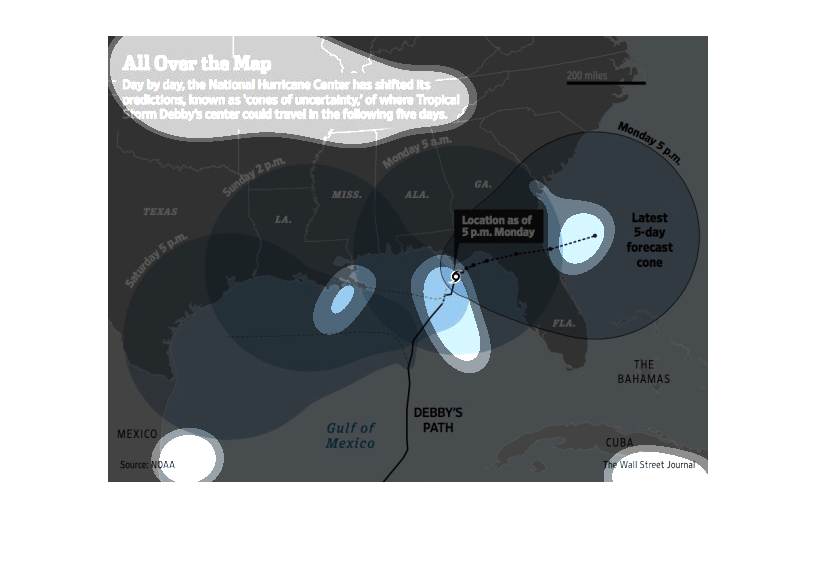
This chart shows a map overlaid with possible locations of Tropical Storm Debby's projected
path over five days. These cones of uncertainty show where the center of the storm might be.
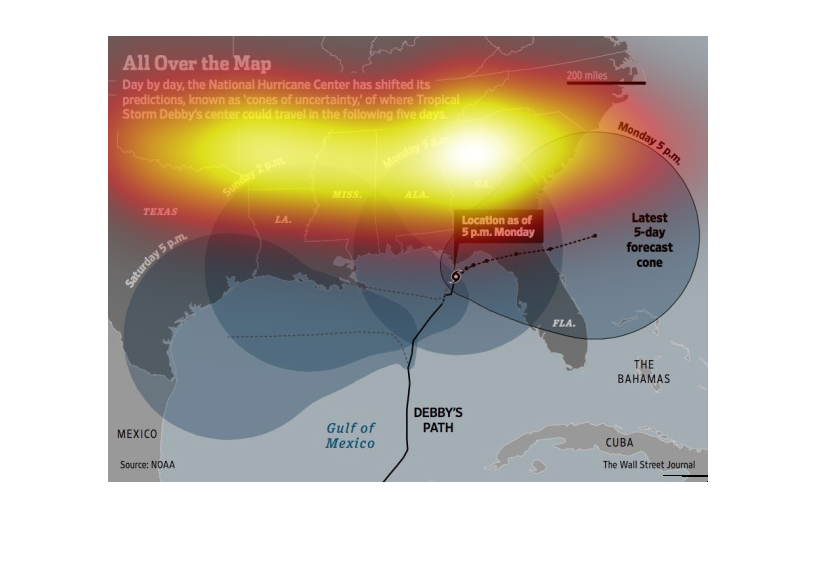
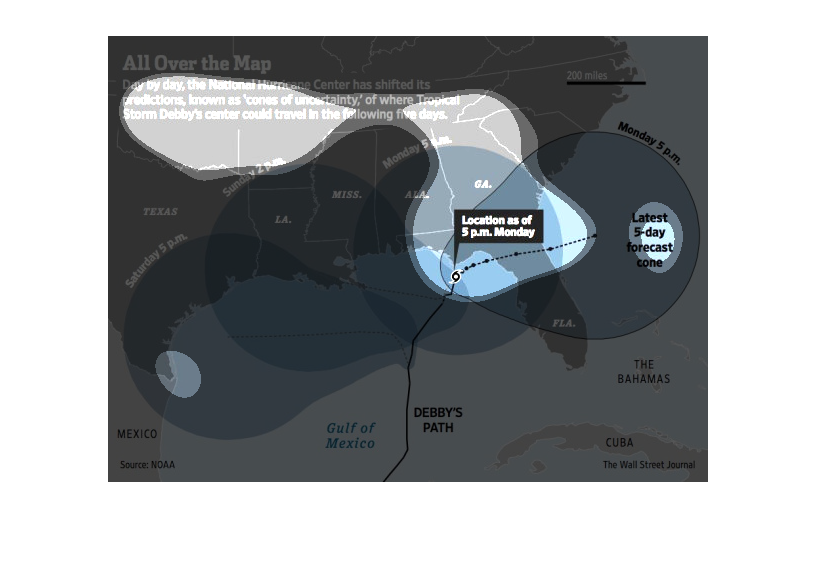
This chart from the Wall Street Journal shows how the national hurricane center projects hurricanes
and when they will hit the atlantic coast and where
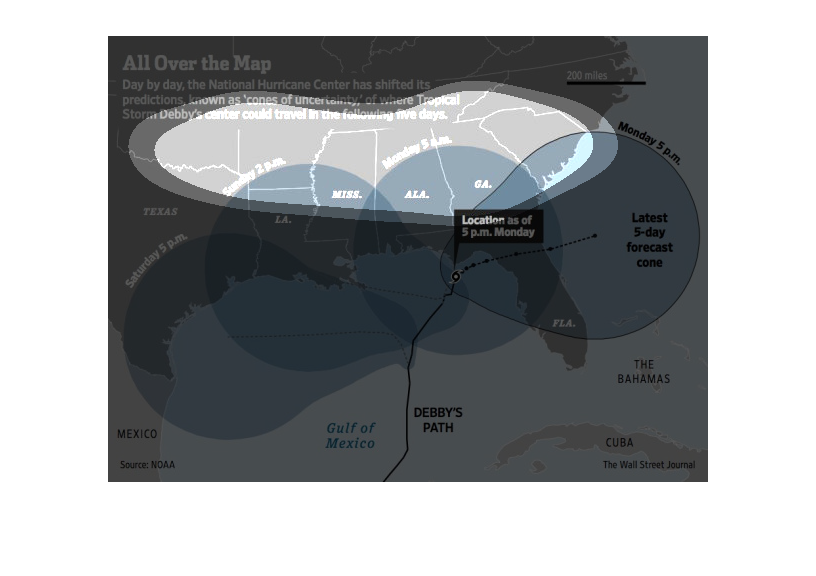
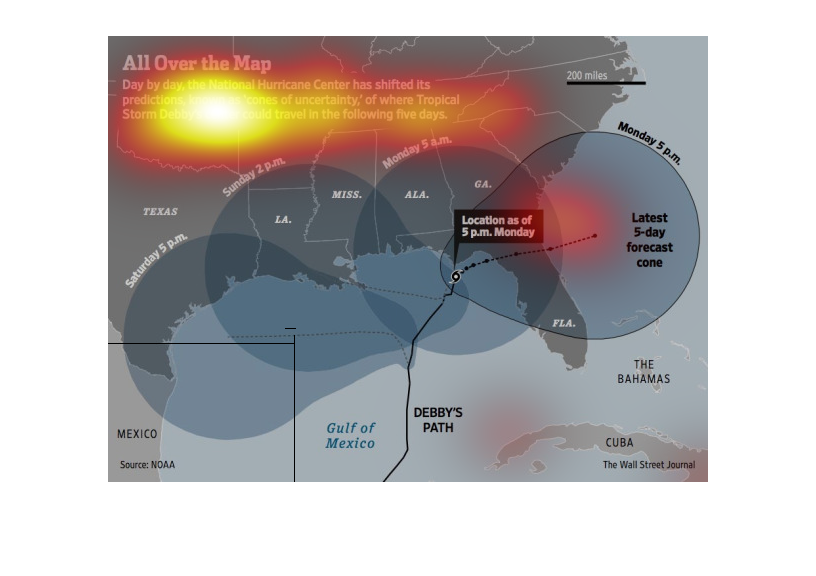
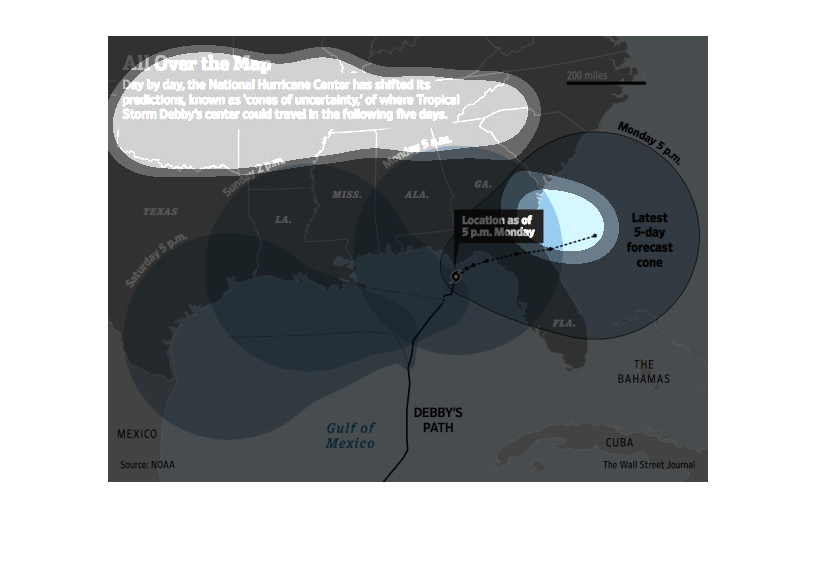
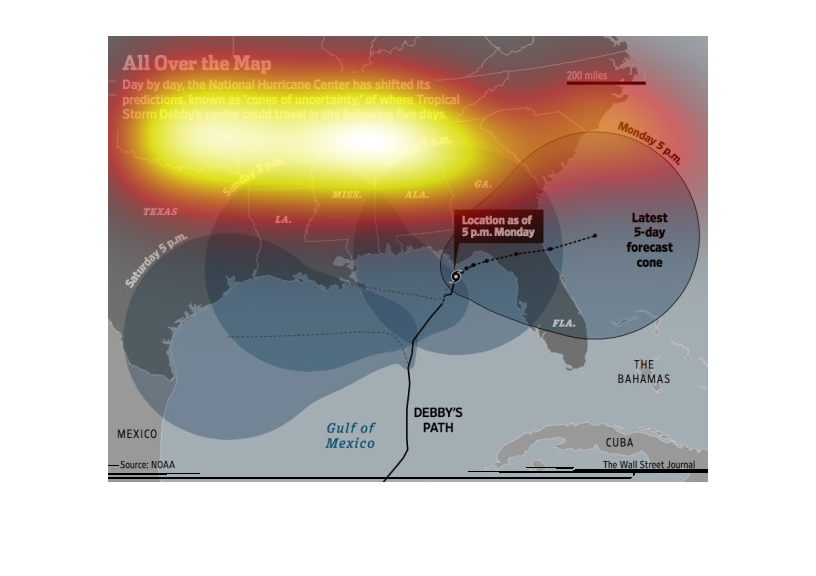
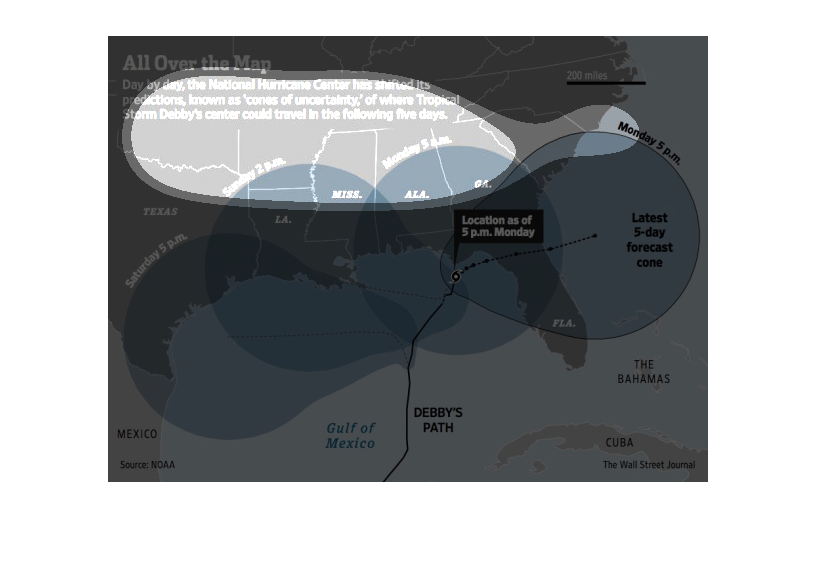
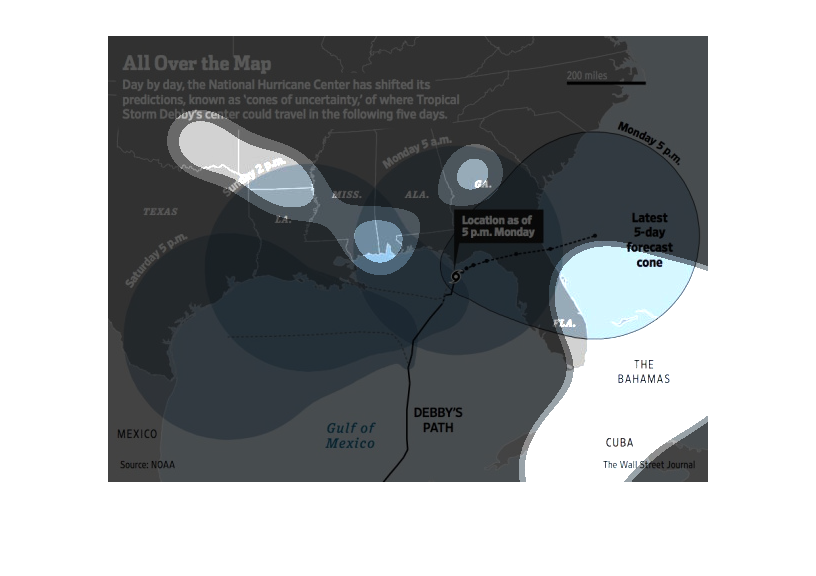
This graphic shows how the predicted path of Hurricane Debbie has changed over time.  From
Saturday at 5pm to Monday at 5pm, the predicted path shifted west. The chart shows 4 predictions:
Saturday at 5pm with the hurricane striking Texas, Sunday at 2pm over Louisiana, Monday at
5am over Alabama and Georgia, and Monday at 5pm on the Florida and South Carolina Coast.
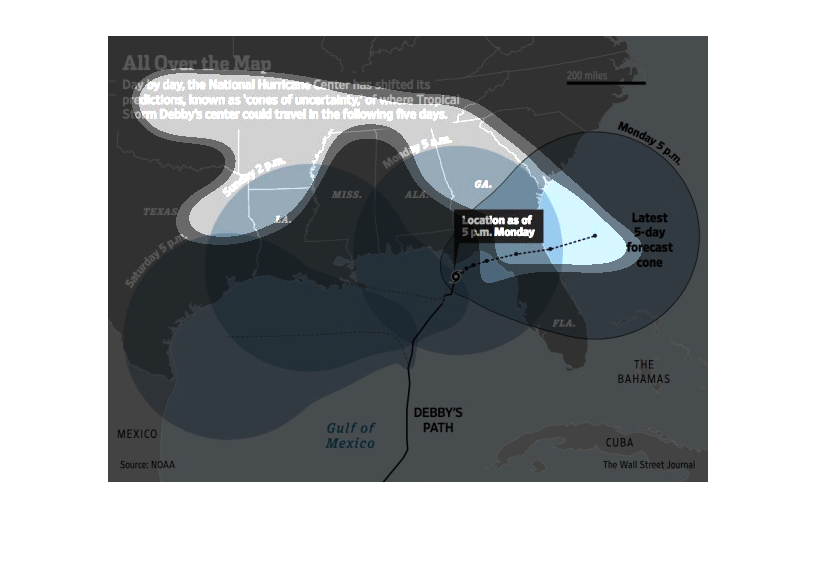
This chart shows the possible locations Storm Debbie's center could travel over five days.
 The storm seems to be traveling in a pattern  from the west to the east.
This chart from the Wall Street Journal shows how there was an incident near new york city
with a civilian airliner almost colliding with a US air force plane
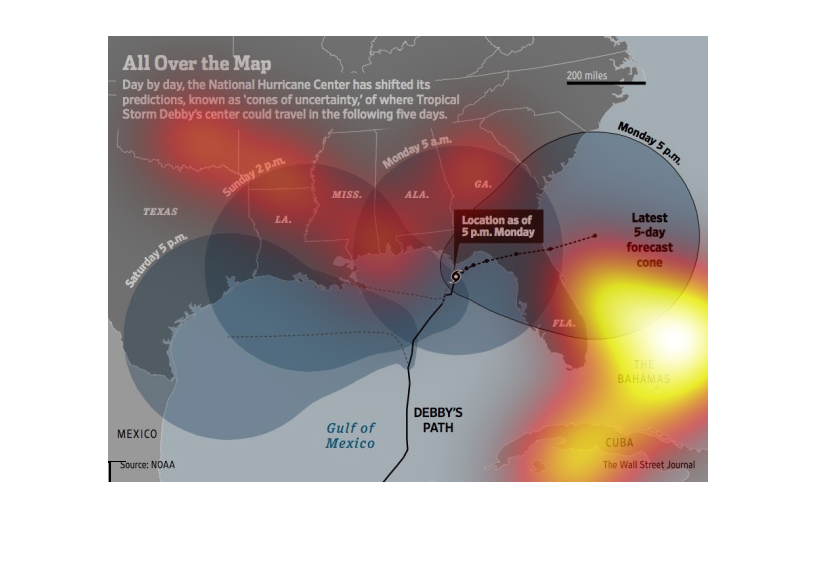
The chart is giving the predict course of tropical storm Debby.The chart shows the storm gaining
strength as it moves across the Pacific ocean from Mexico to the United States.