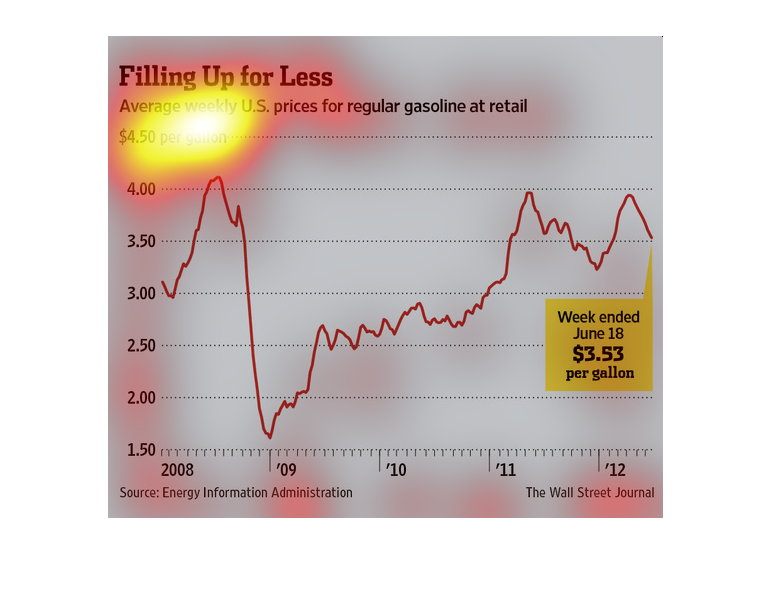
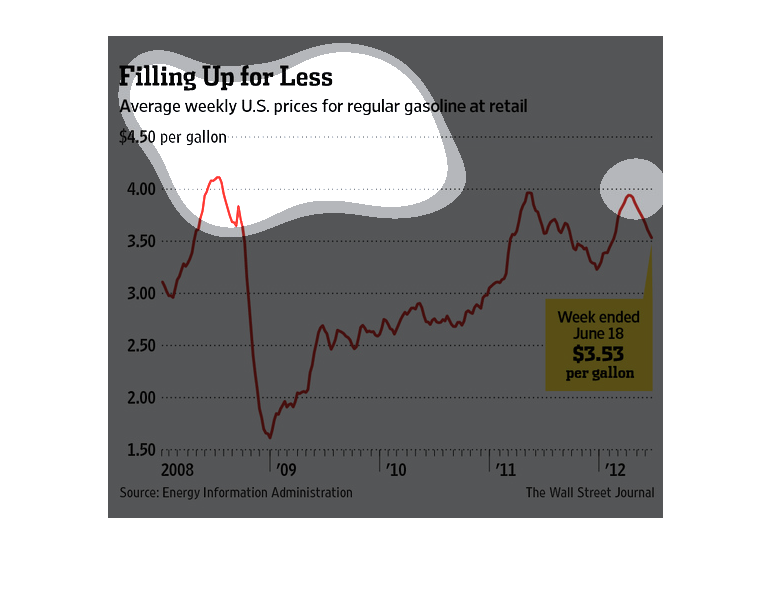
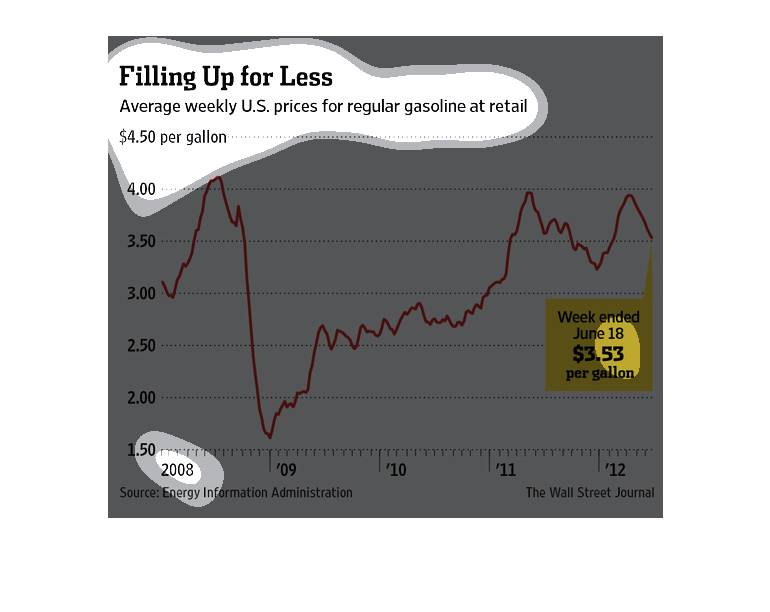
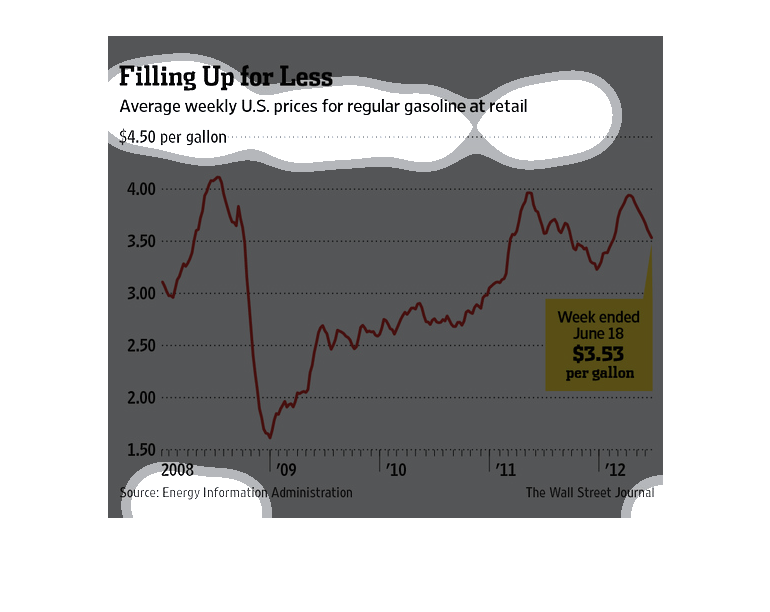
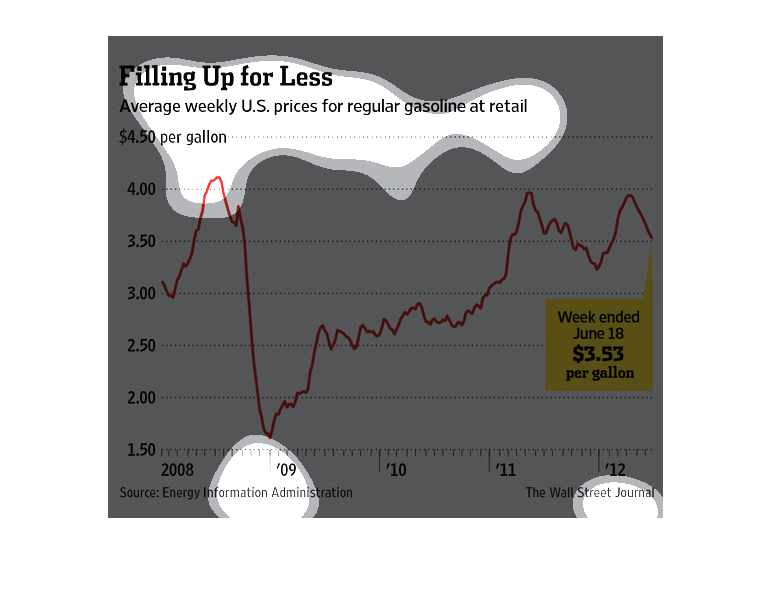
This chart describes filling up for less. Specifically, average weekly United States prices
for regular gasoline at retail. The highest spike comes in over the $4.00 mark.
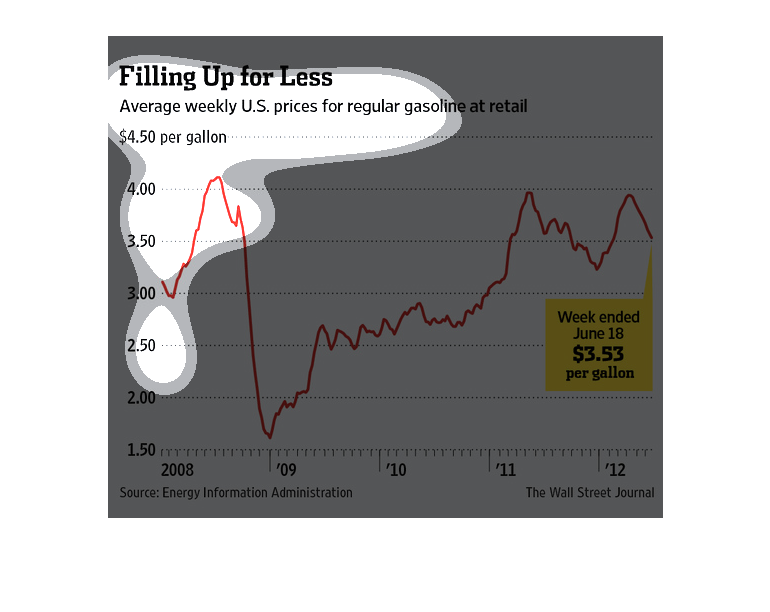
Filling up For Less | Average weekly price of Gasoline per gallon USD. A line graph with Y
axis showing $1.50 to $4, the X axis showing the week 2008-2012. A free fall in 2009 and a
slow steady rise.
This chart from the Wall Street Journal shows how the average price for regular gasoline on
a per gallon basis has dropped from record highs in the past
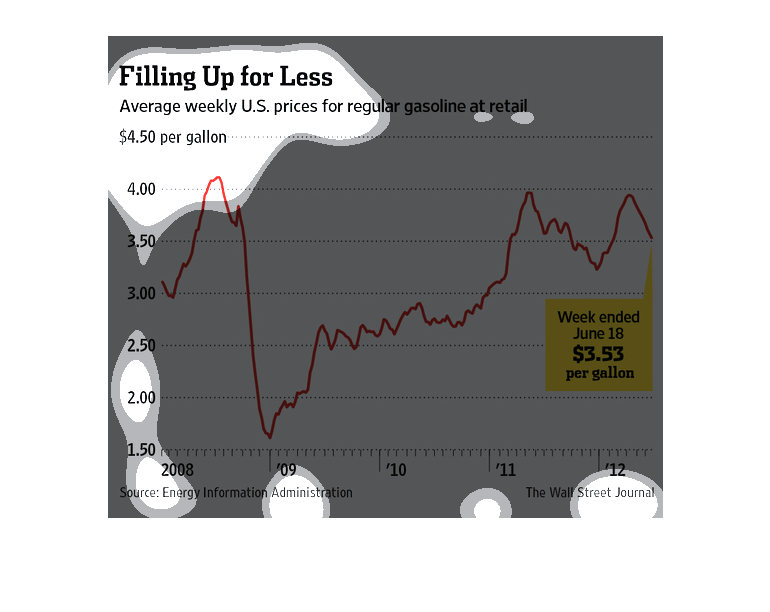
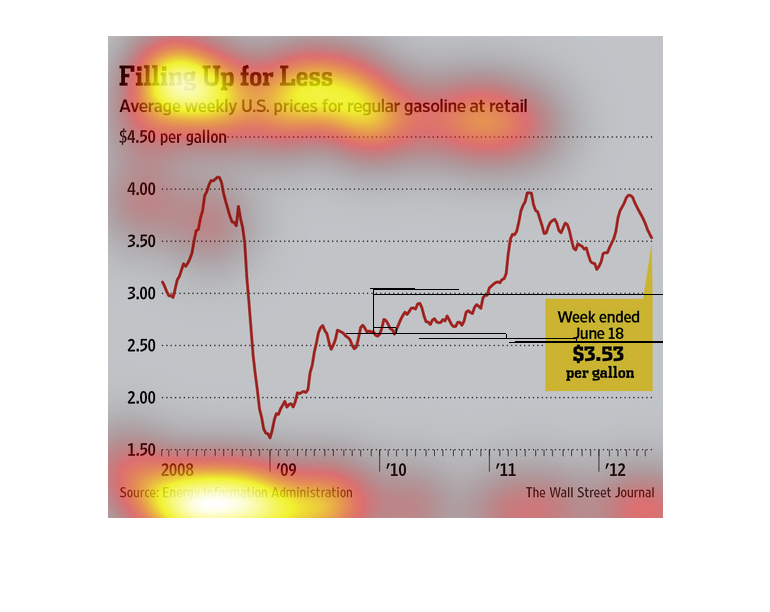
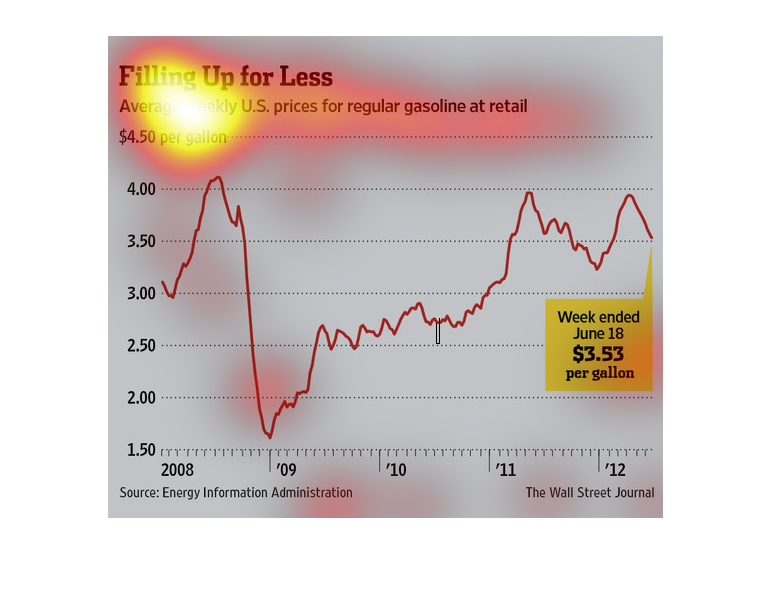
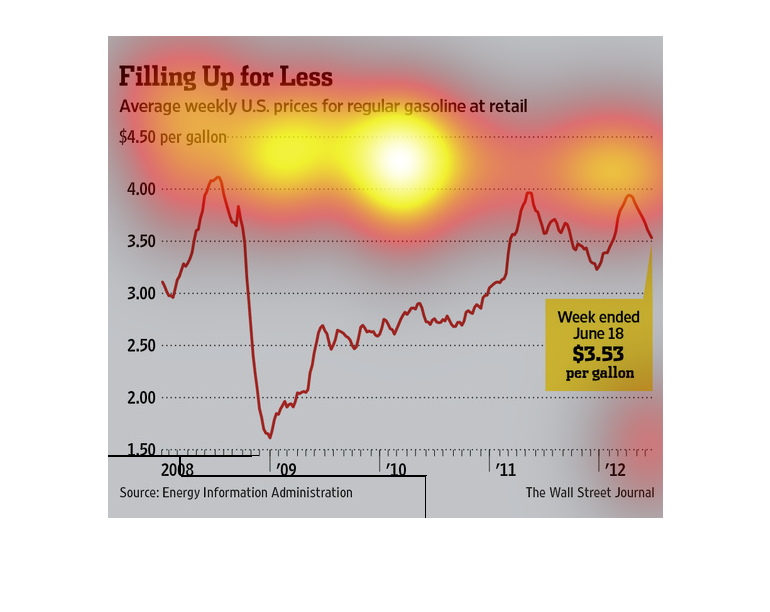
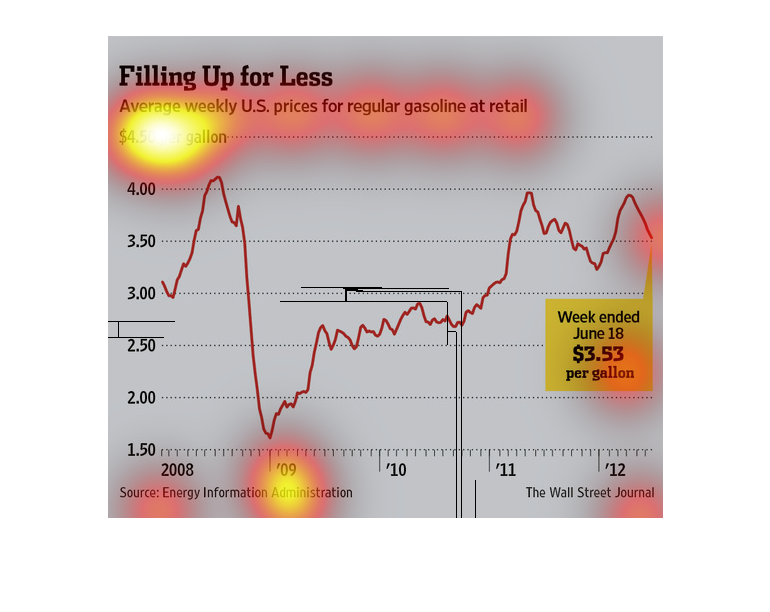
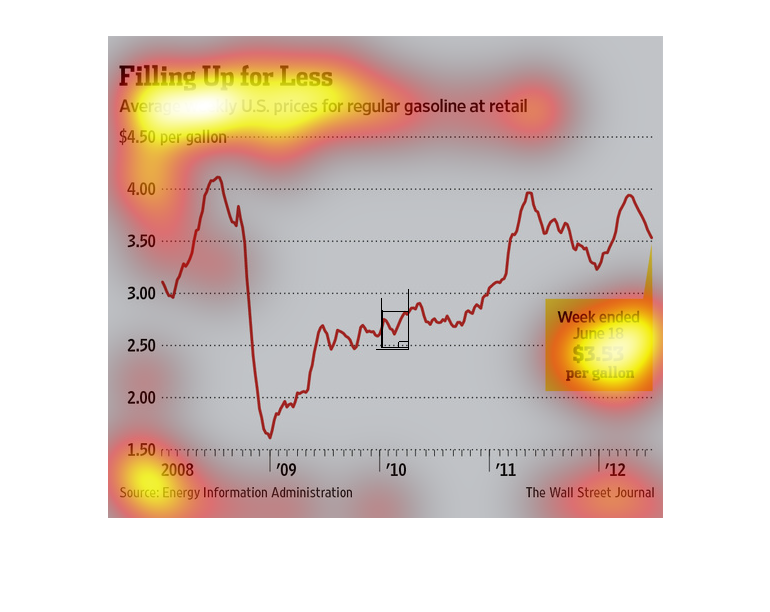
This chart describes filling up for less. Specifically, average weekly U.S. prices for regular
gasoline . The highest spike on the chart comes around the 4 dollar mark.
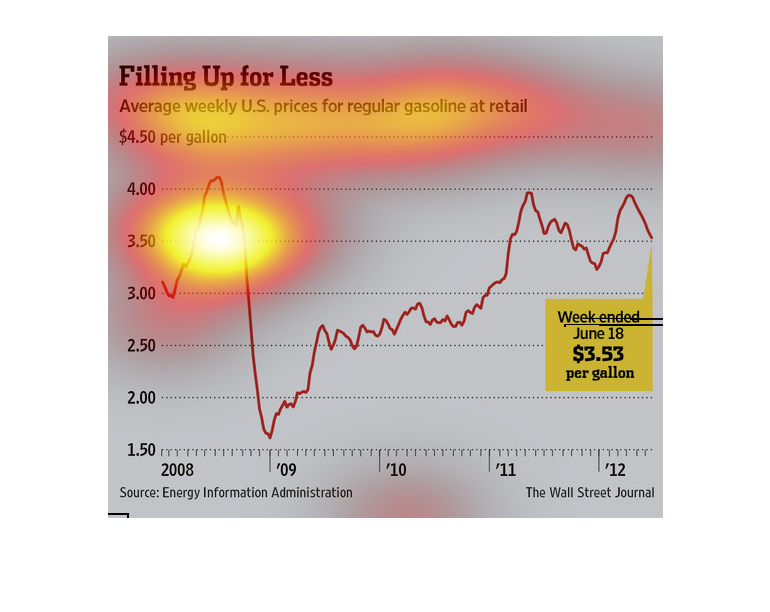
This chart shows the United Staes of America gas prices over time. It shows that from 2008
the gas prices were extremely high but then they dropped drastically and began rising again
from there.
This image shows or depicts in statistical line graph format information concerning how U.S.
citizens are filling up on gas for less based on regular gasoline prices.
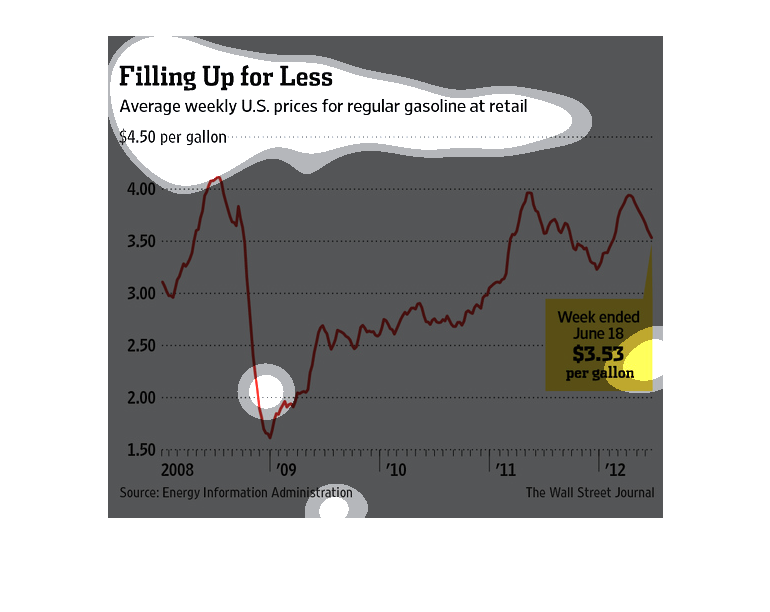
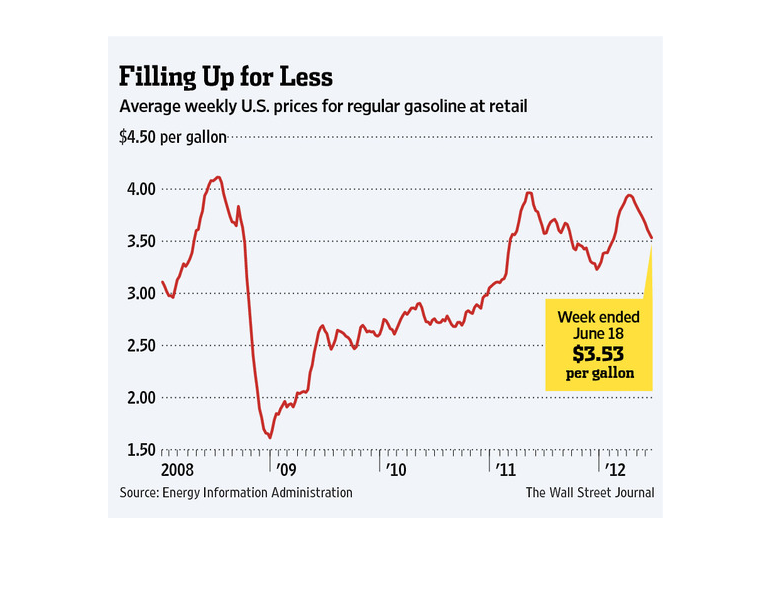
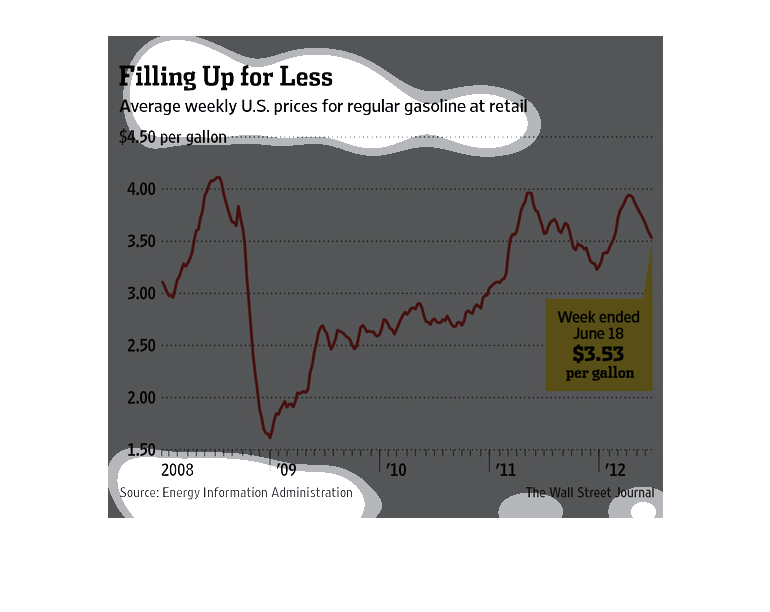
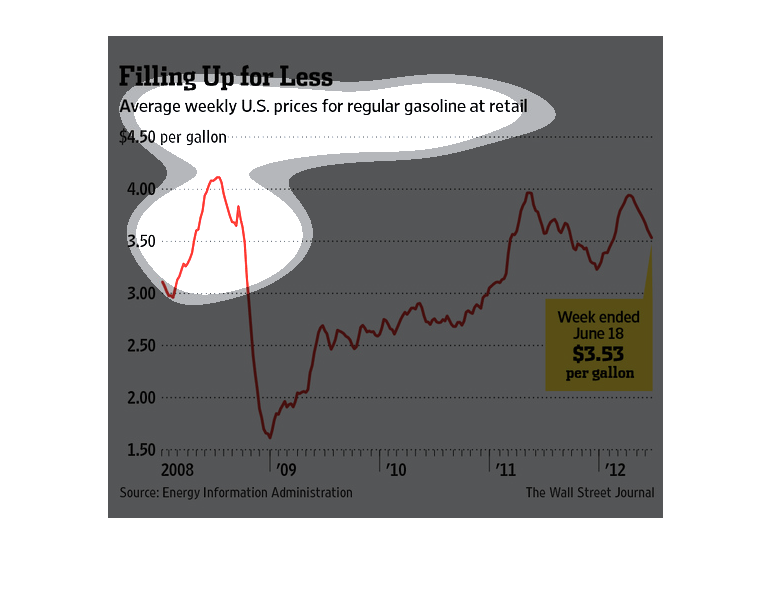
This is a chart with related statistics depicting the average weekly U.S. prices for regular
gasoline at retail from the years 2008 to 2012. It shows a sharp decline followed by steady
rebound in this period.
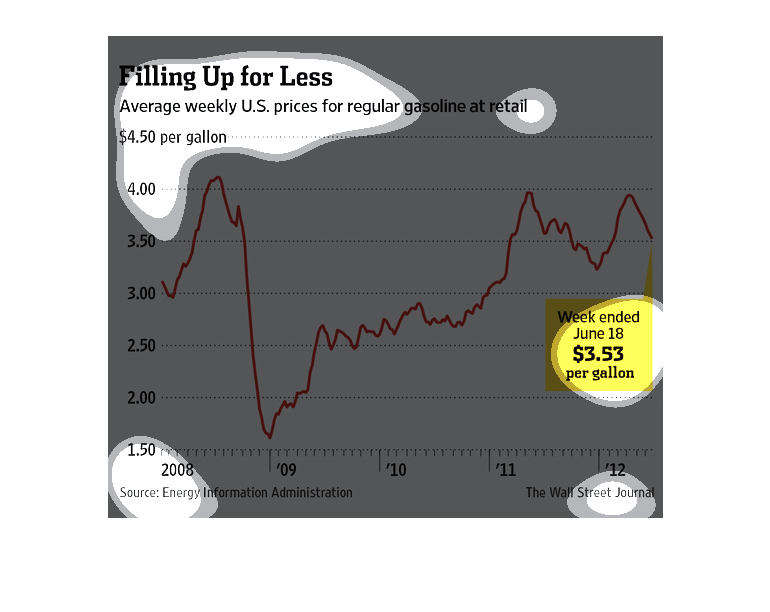
This chart from the Wall Street Journal shows how regular prices for gasoline per gallon have
started to level off or fall over time. it shows how it is good
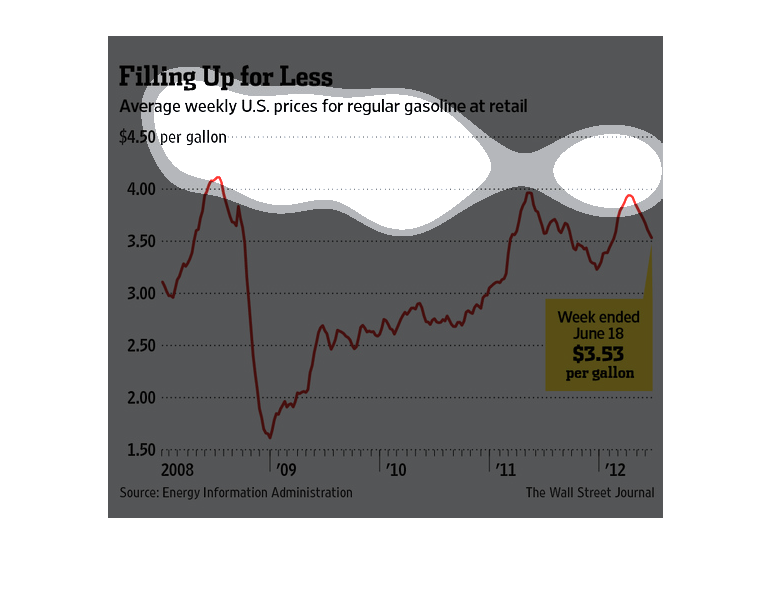
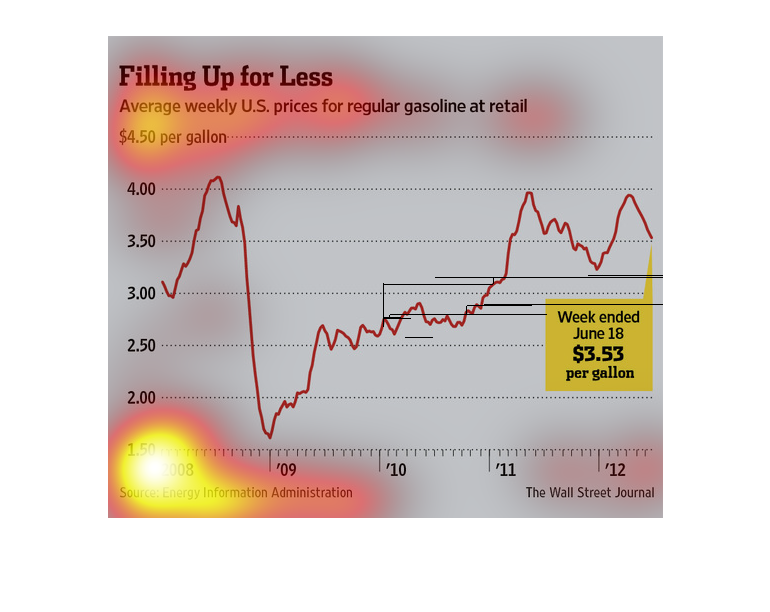
This image shows a line graph plotting the price of regular gas from 2008 to 2012 in the United
States. Prices dropped significantly in 2009, but have since risen.
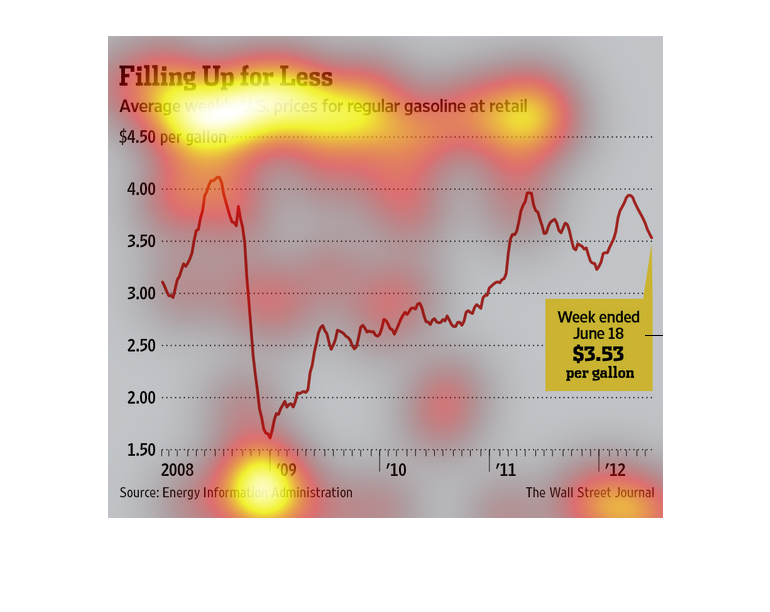
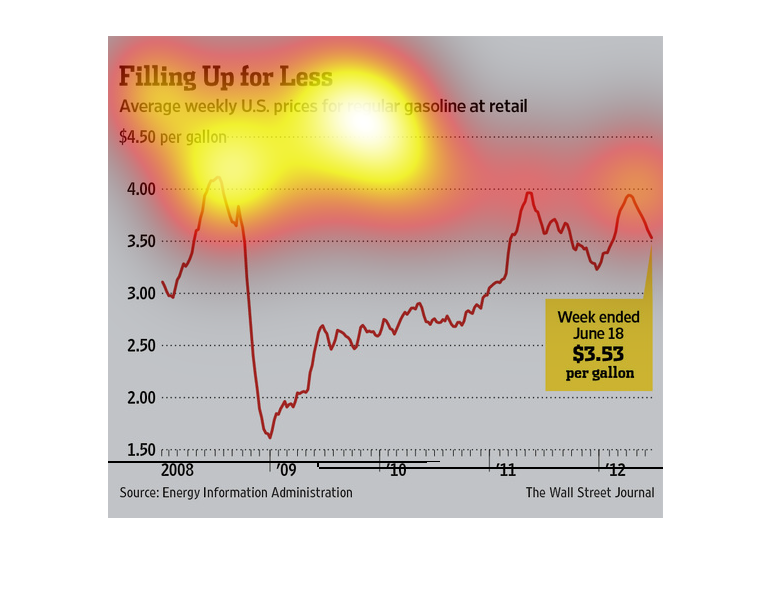
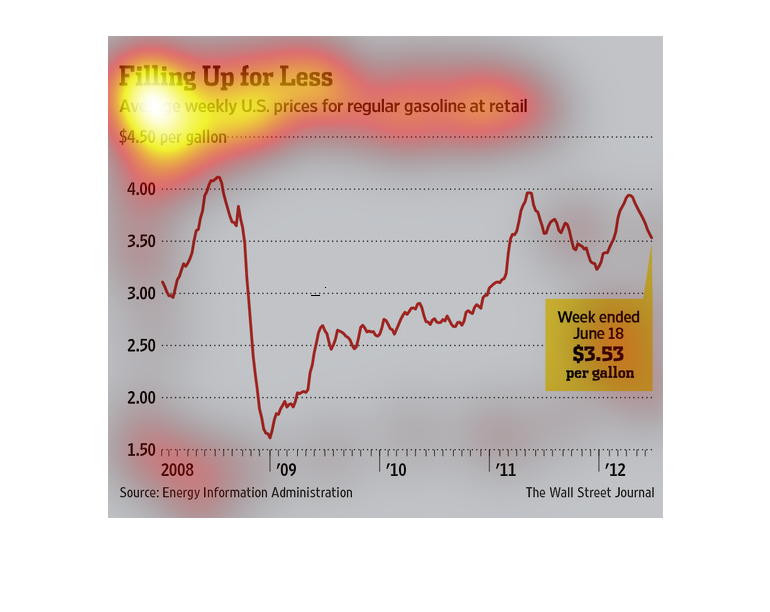
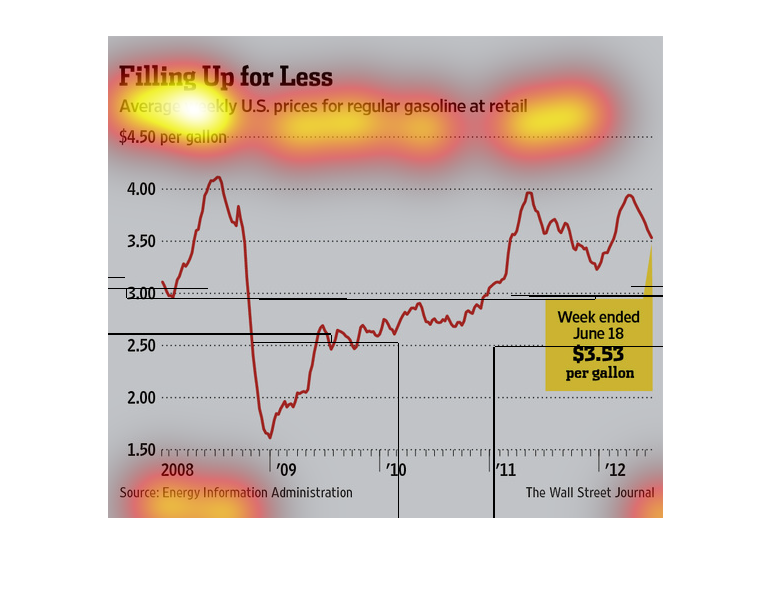
This chart illustrates the average weekly US prices for regular gasoline at retail stores
from 2008 to 2012 where the costs dipped in 2009 and have been steadily rising upwards since.
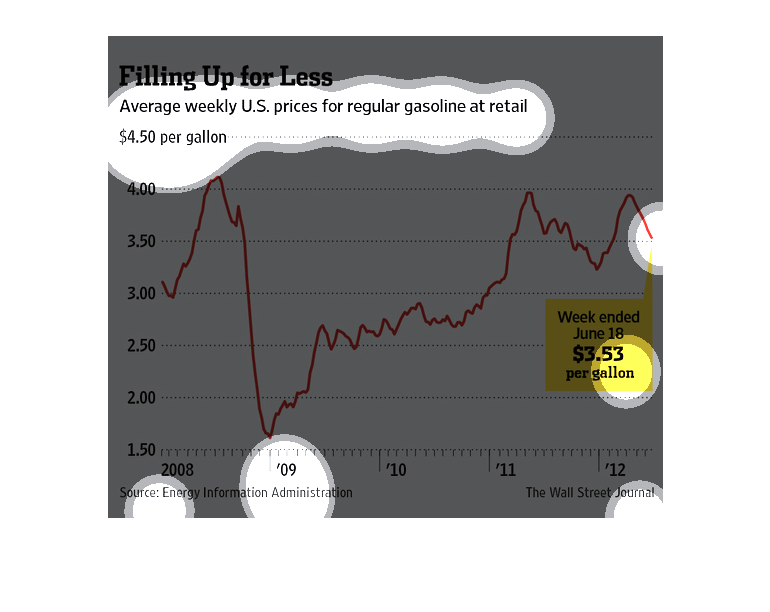
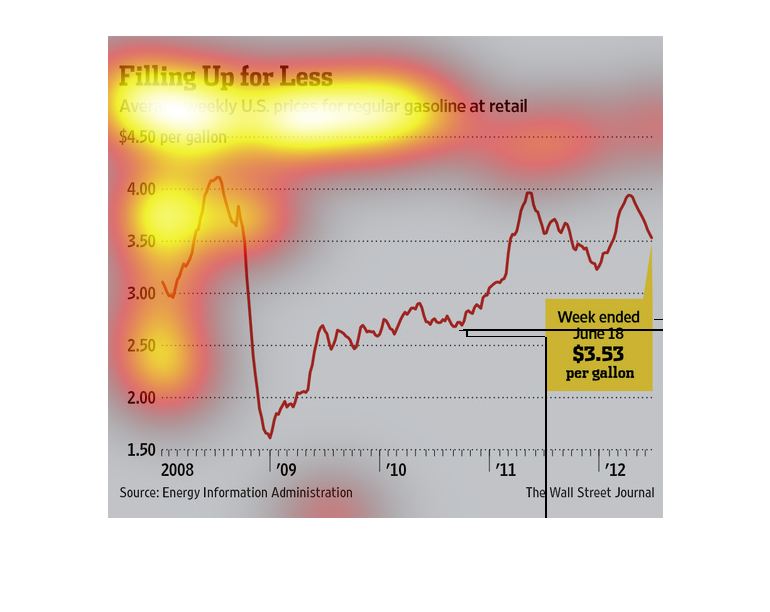
In this study conducted by the Wall Street Journal from information gathered from the Energy
Information Center, people are filling up their tanks for more money and less fuel.
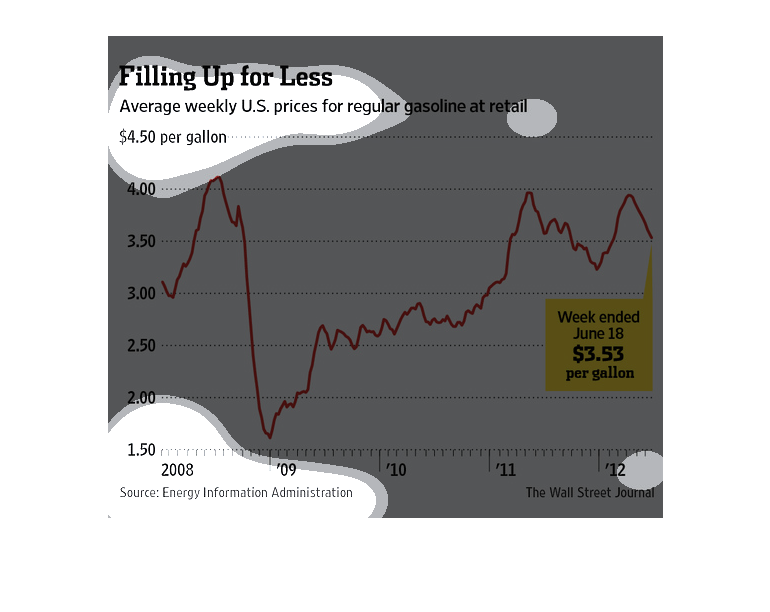
This image is entitled "Filling Up For Less."  It shows average weekly U.S. prices for regular
gasoline at retail.  The price ranges are from $1.50 to $4.50.  Dates range from 2008 to 2012.
 As of the week ended June 18, the price of U.S. regular gasoline was $3.53 per gallon.  Data
source is the Energy Information Administration.  The image appeared in The Wall Street Journal.
This image graphs the average weekly price for gasoline over the years from 2008 to 2012.
It shows that the average was $4.50 with the highest prices around 2008 a drop in 2009 and
rising into the 2010-11 and 2012