Canada was just as badly hit as any other place in the world when the big recession hit. In
this study- conducted by the Wall Street Journal- we see that every sector suffered because
of the unemployment rate.
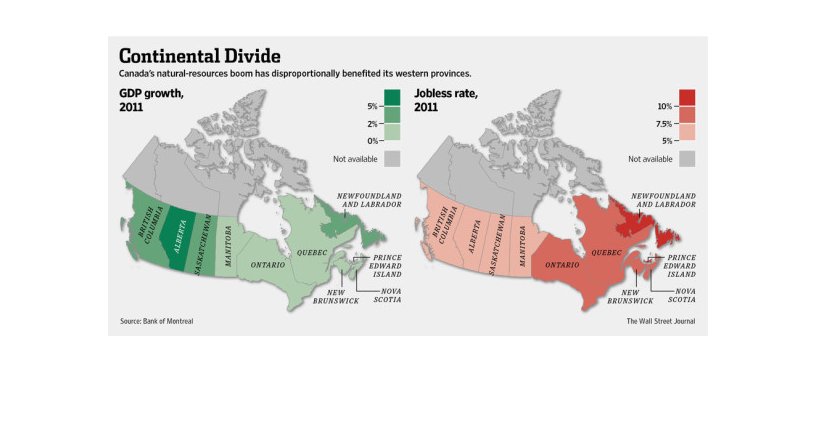
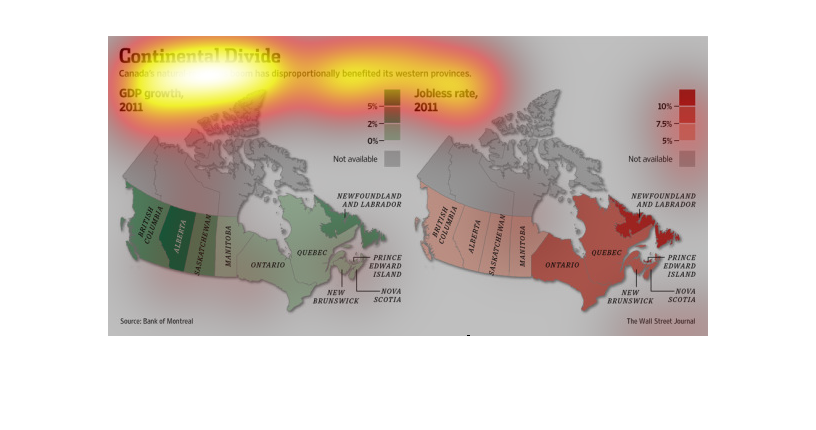
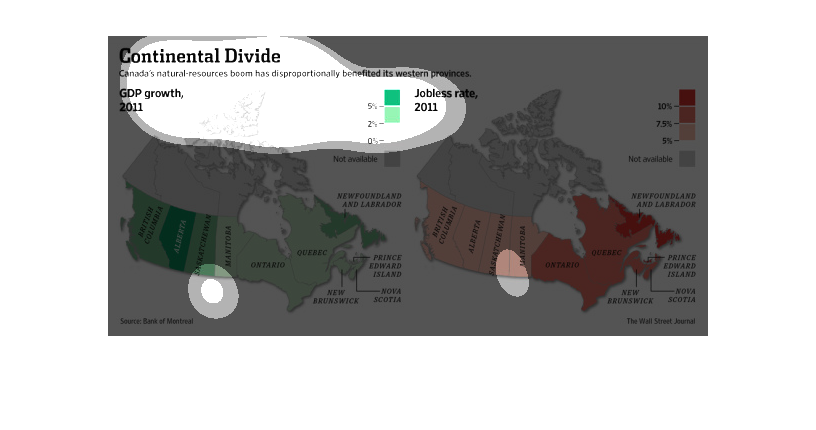
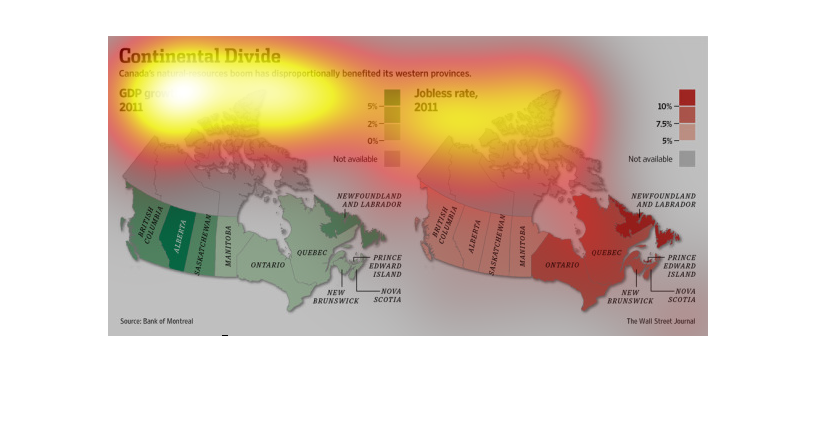
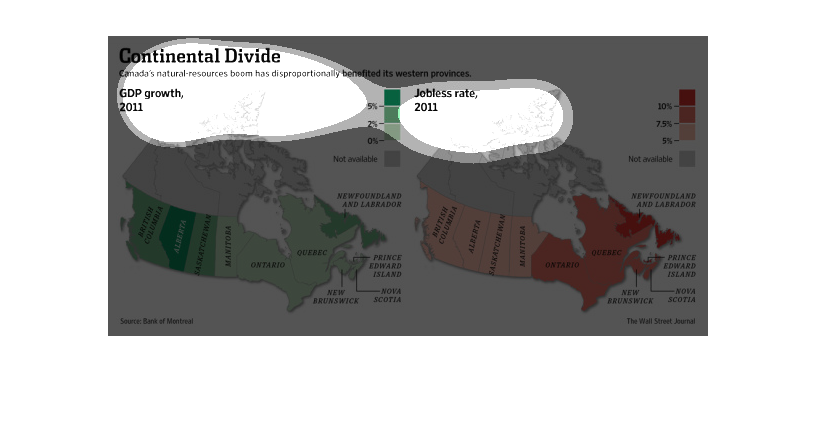
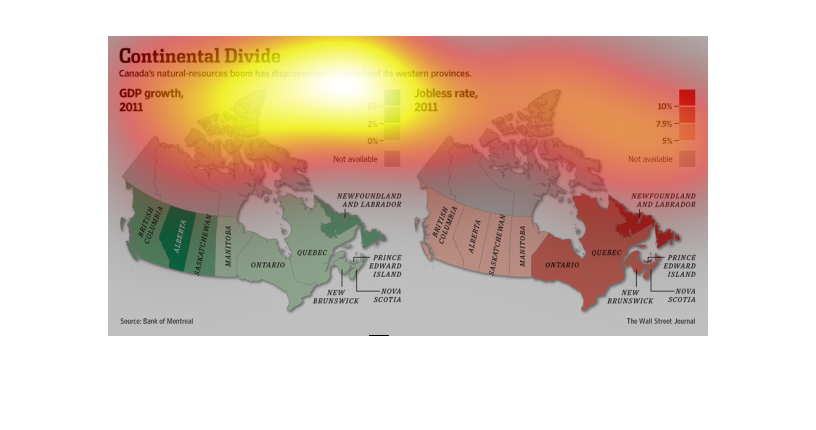
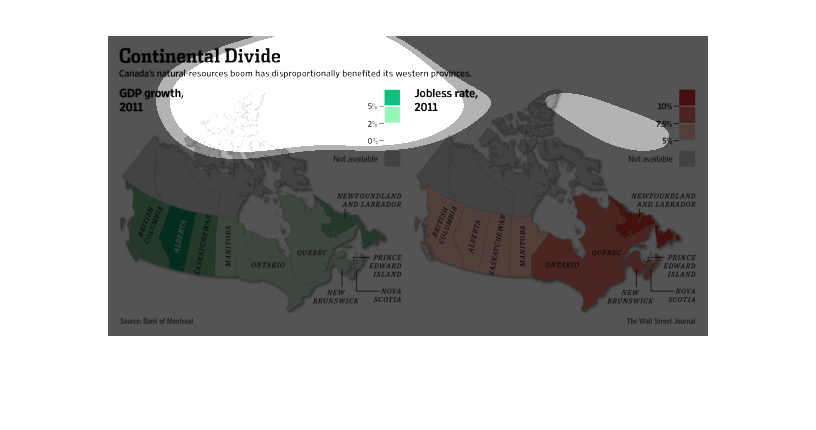
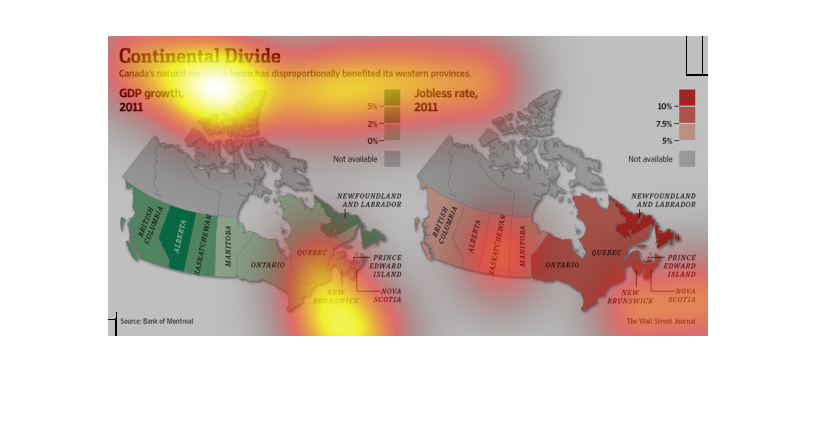
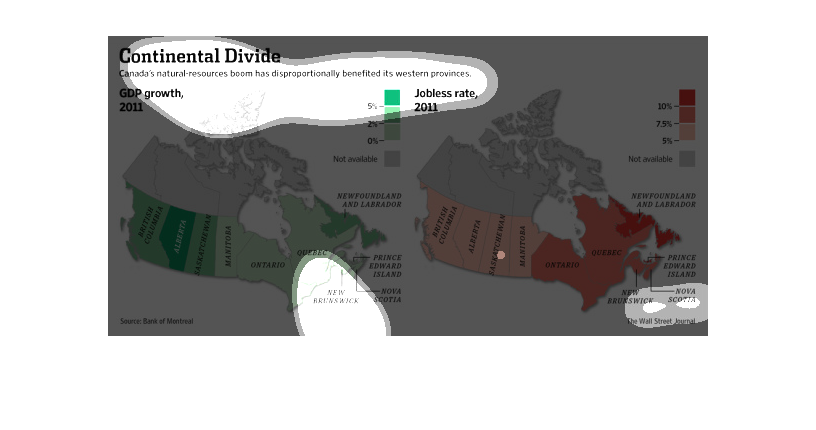
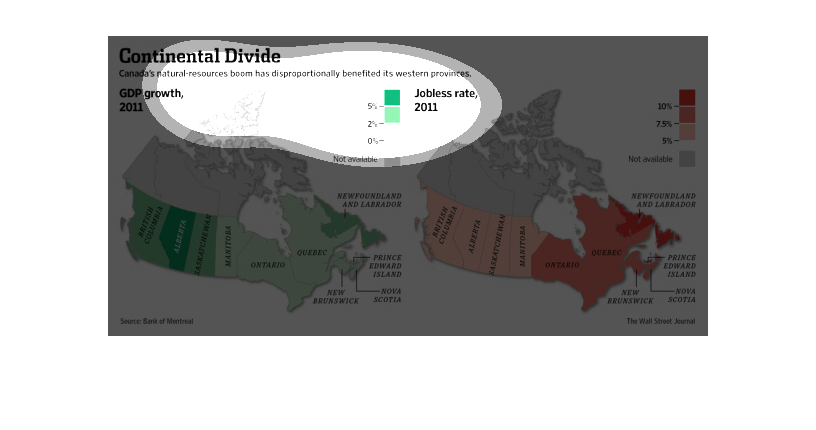
This chart from the Wall Street Journal shows how Canada's natural resource boom has unevenly
benefitted certain parts of the country, specifically the west
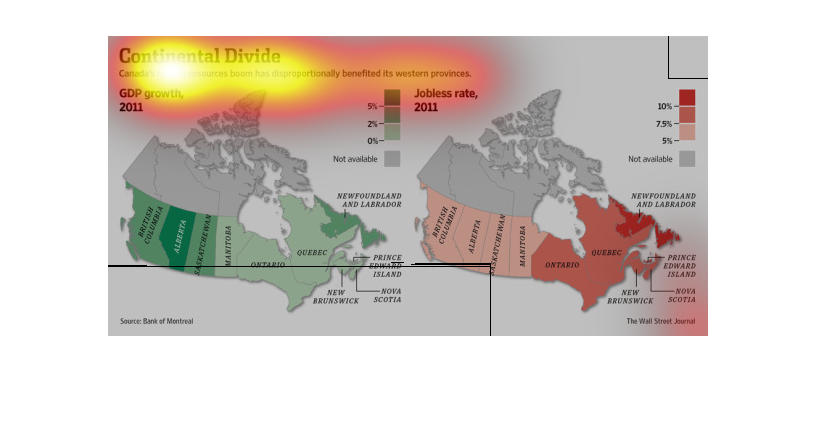
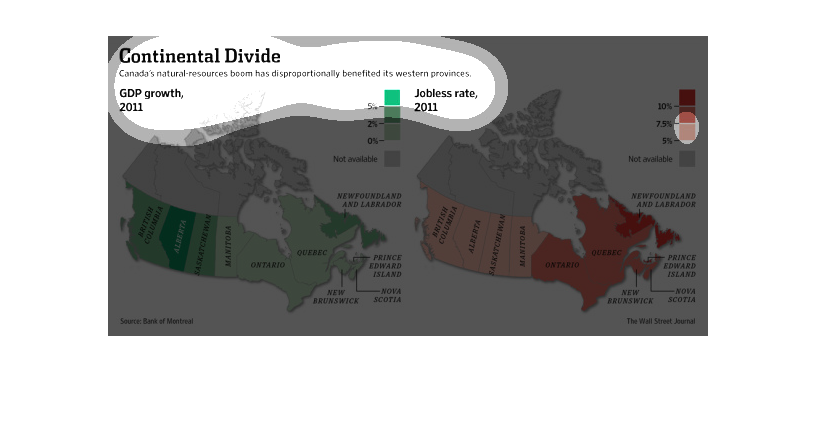
This chart describes continental divide. Specifically, Canada's natural resources boom have
disproportionately benefited its Western provinces. Categories are represented by different
colors.
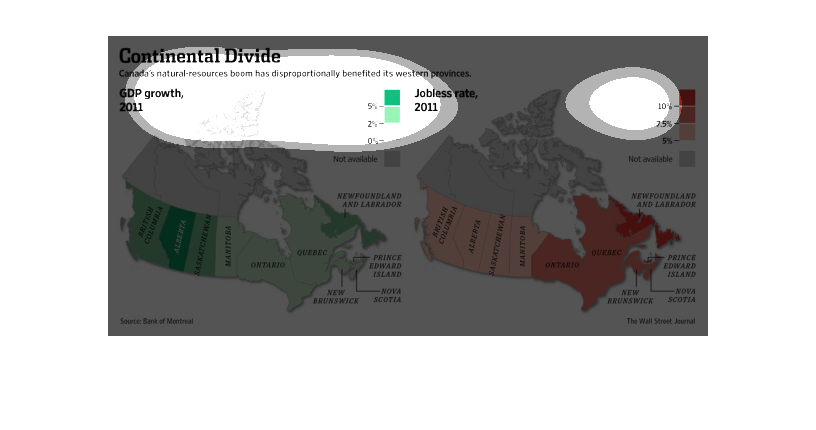
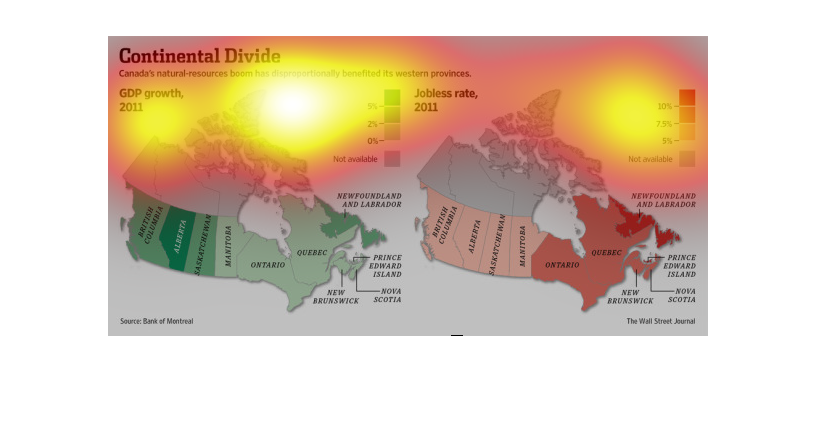
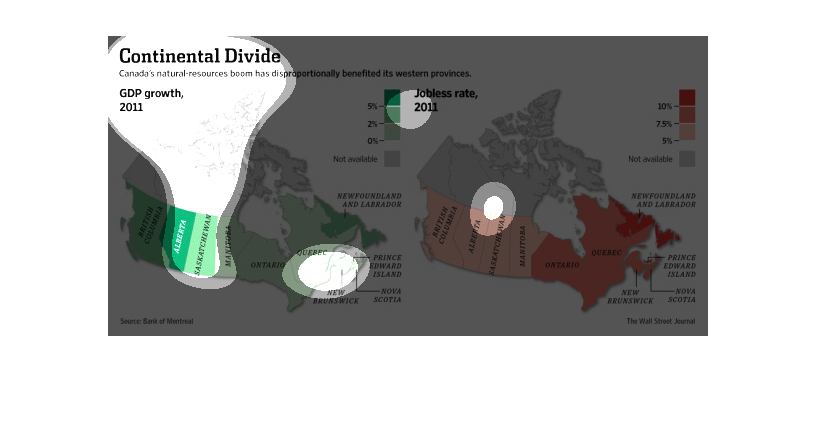
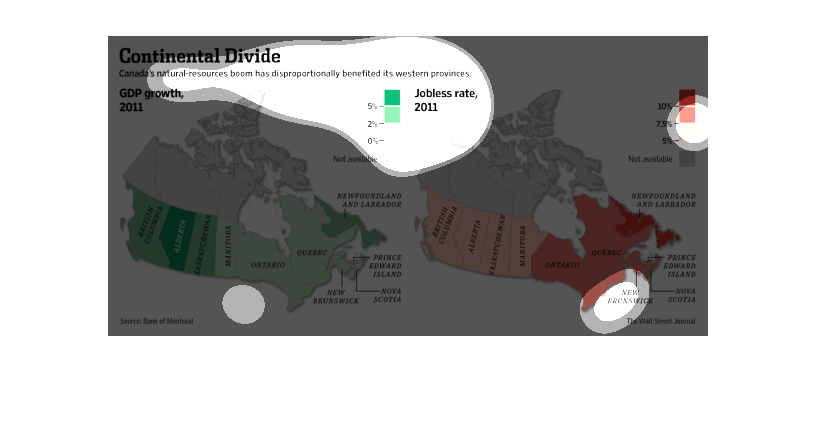
This image is entitled "Continental Divide."  Is shows Canada's natural resources have disproportionately
benefited its western provinces.  The left half of the image (shown in green) depicts GDP
growth in 2011.  The right half of the image (shown in red) depicts the jobless rate in 2011.
 Western provinces are shown in darker red or green to show which ones have received the disproportionate
amount of resources.  Data was obtained from The Wall Street Journal.
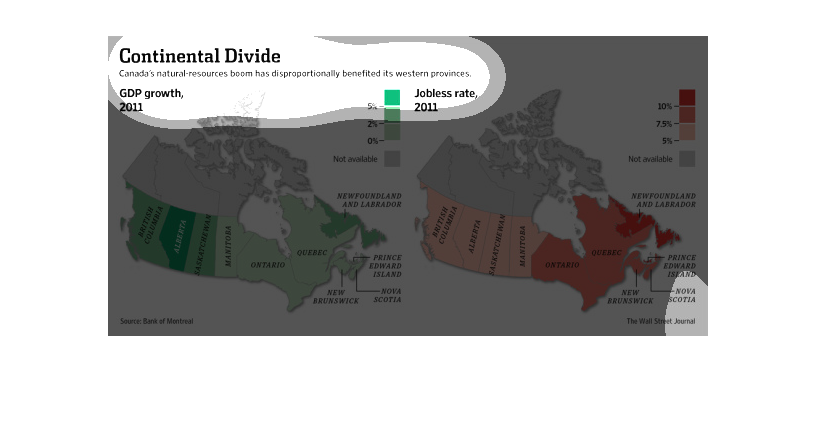
This chart shows how Canada's profits from selling its natural resources has benefited the
Western provinces of Canada more than the eastern provinces.
Canada seems to be doing well economically. If you ever visited, gas is astronomical and a
12 pack of beer is like 30 bucks. But they seem to be doing there thing, so you can't really
hate on them.
This chart describes continental divide. Specifically, Canada's natural resources boom has
 benefited its western provinces.Different categories are represented by different colors.
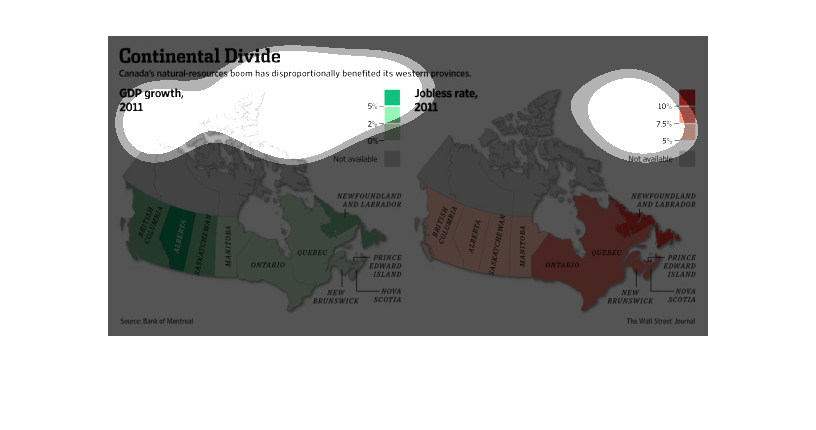
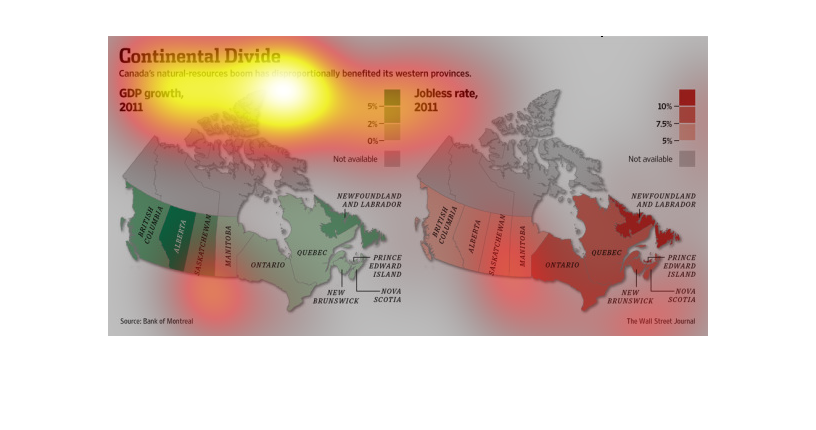
This is a series of color coded maps of Canada with related statistics depicting that Canada's
natural resources boom had disproportionally benefitted it's western provinces.
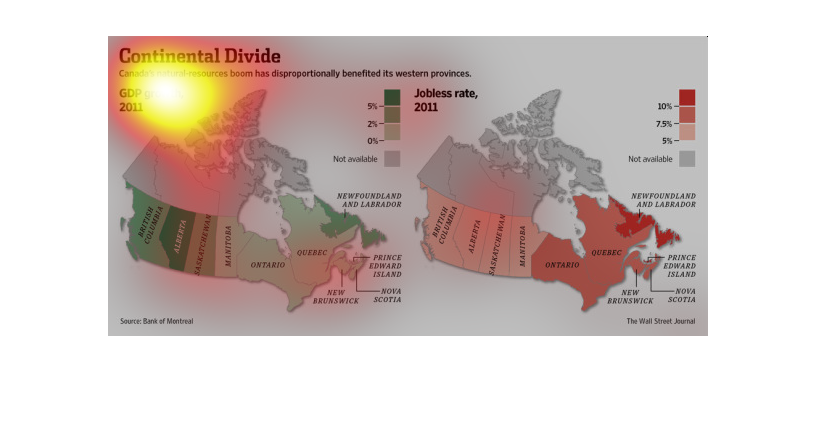
The title of this graphic is continental divide It says that Canada's natural- resources has
disproportionately benefited from western provinces, and provides a map.
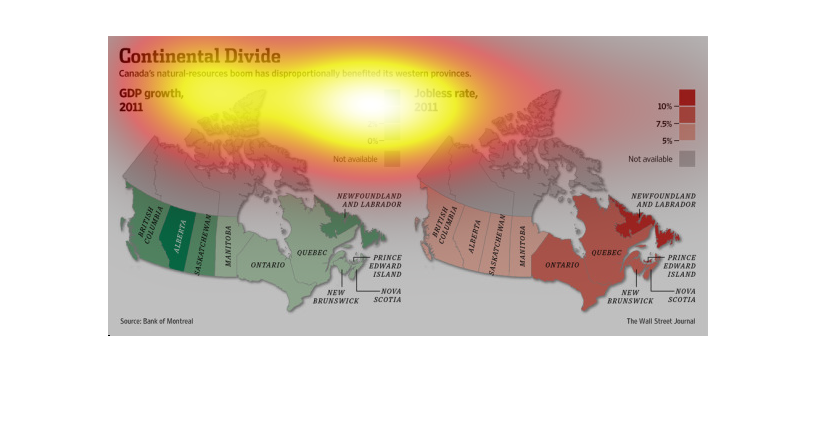
The image depicts Canada's natural resources boom has disproportionately benefited it's western
provinces. The jobless rate in the west is considerably lower than in the east.
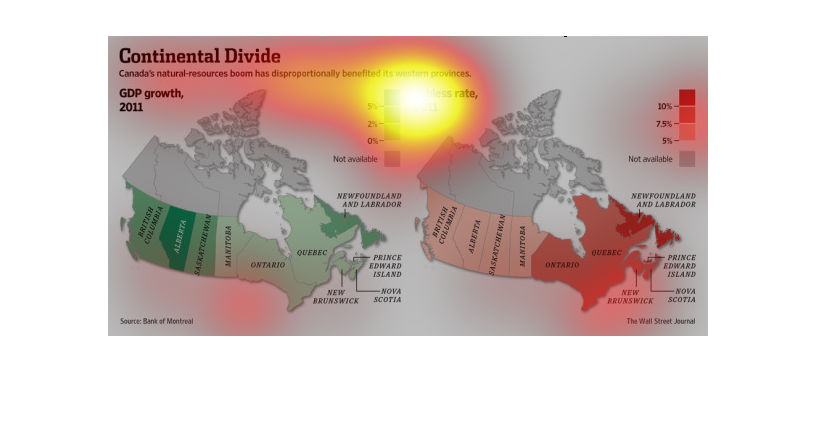
These charts display how Canada's natural resources boom have disproportionately benefitted
the Western provinces and it illustrates GDP growth and job rate in 2011.