This chart is your typical graph chart that sets up one or a number of categories, which is
illustrated by either a map, a graph, an illustration, or photographs, etc.
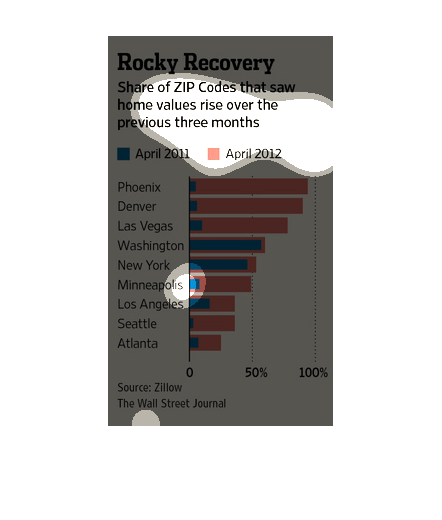
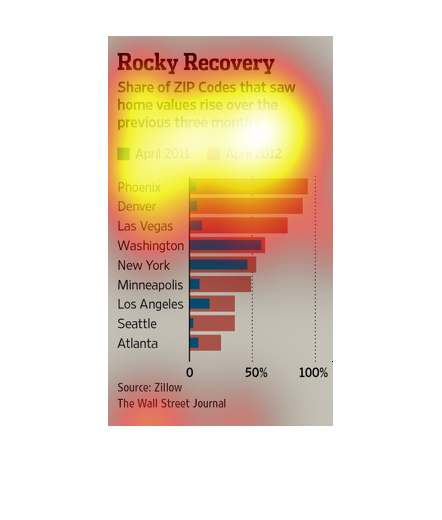
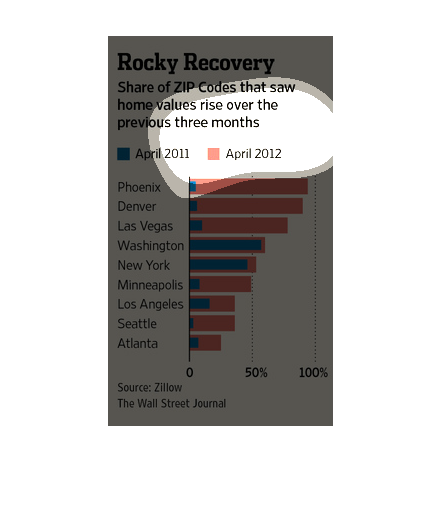
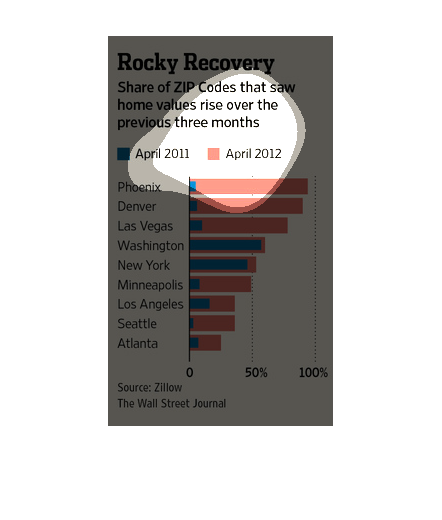
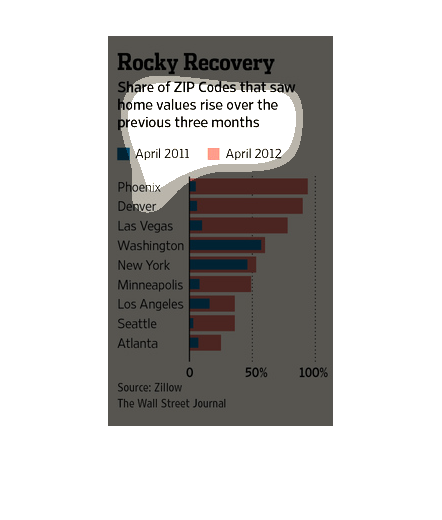
The figure presented is titled Rocky Recovery.  The figure is a representation of the statistical
data for the share of zip codes that saw home values rise.
this chart documents the value of homes in several large cities such as phoeix , denver, las
vegas, washington , new york, minneapolis, los angelas, seattle and atlanta
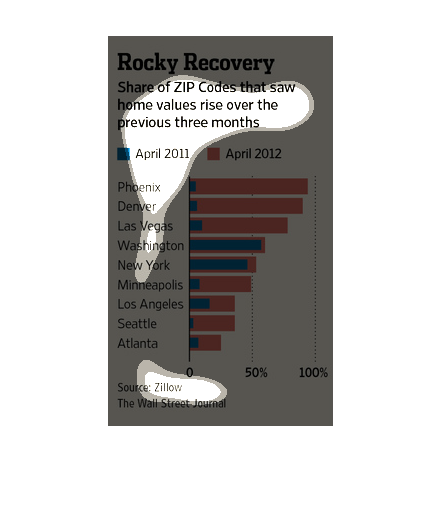
The image depicts the share of zip codes that saw home values rise over the previous three
months. Home values increased dramatically based on the data available across multiple zip
codes, except for two zip codes.
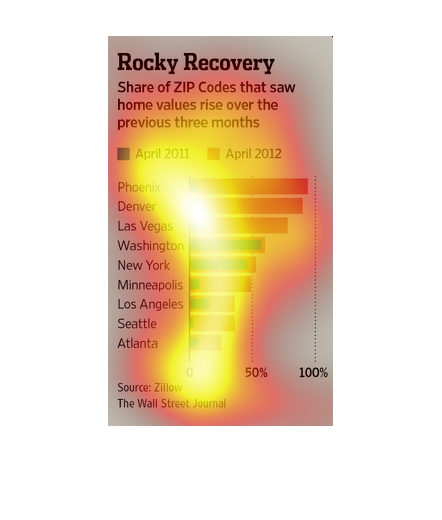
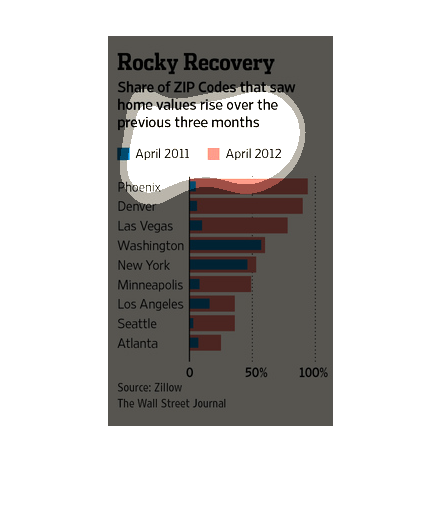
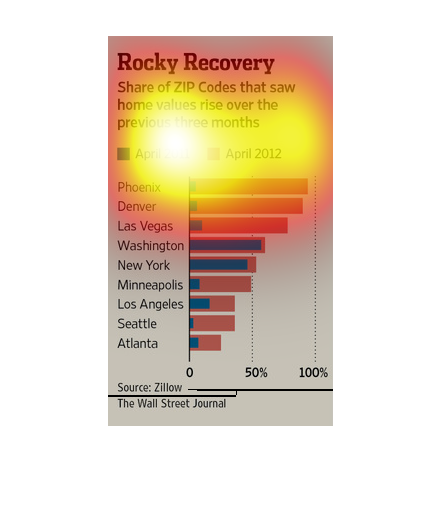
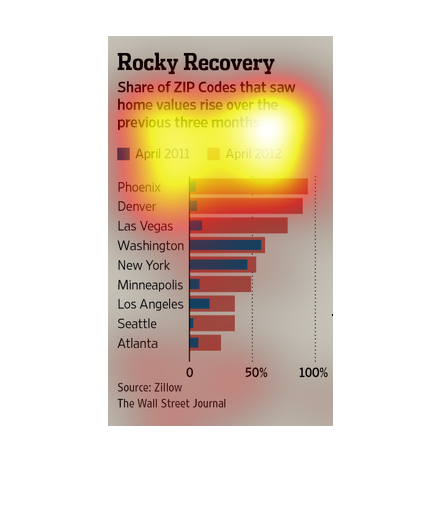
This chart from the Wall Street Journal shows how  certain zip codes are experiencing faster
recoveries in home prices than other parts of the country.
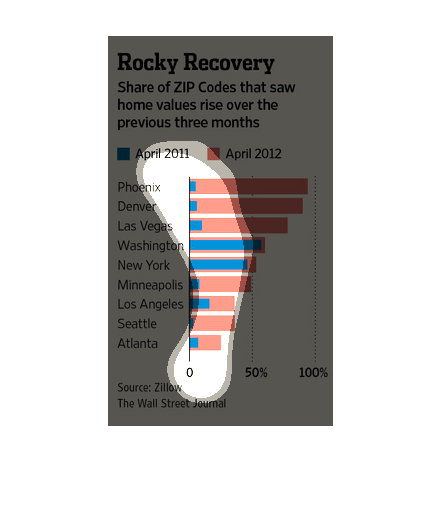
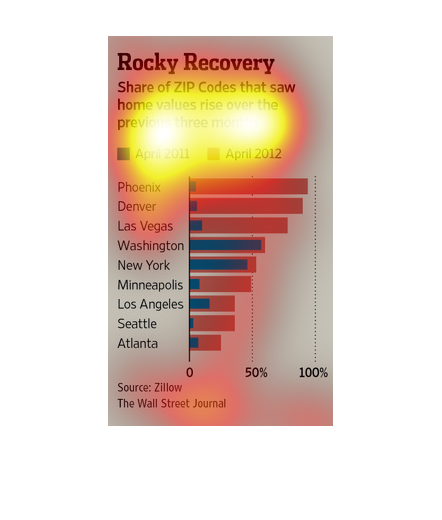
The image depicts the share of zip codes that saw home values rise over the previous three
months. All zip codes except for two saw noticeably high increases in home values.
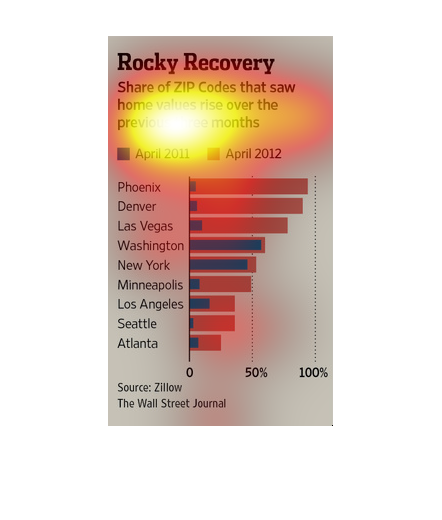
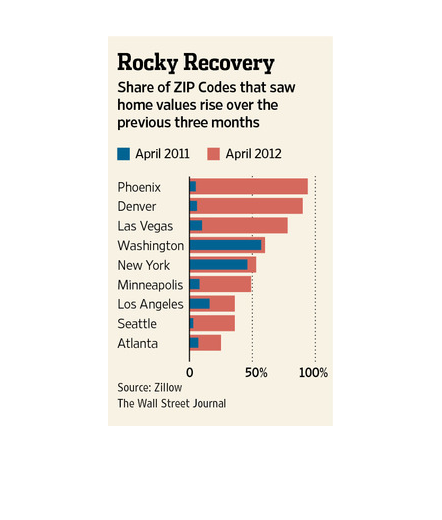
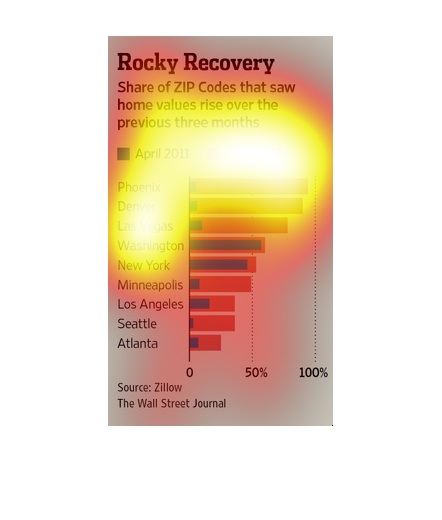
This chart illustrate the share of zip codes that have seen home values rise including Phoenix,
Denver, Las Vegas, Washington and New York based on Zillow figures.
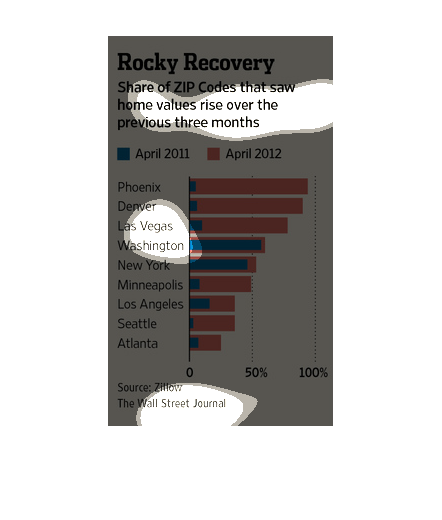
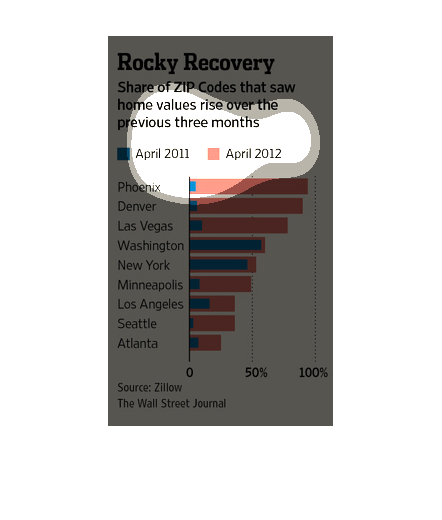
This chart represents the share of zip codes that saw home values rise over a three month
period in April of 2011 and 2012 respectively. Phoenix and Denver showed the biggest rise
over time.
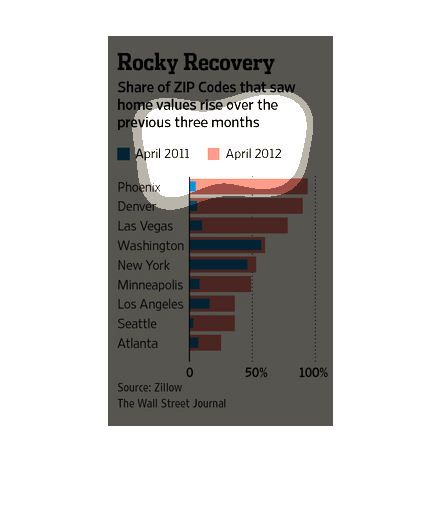
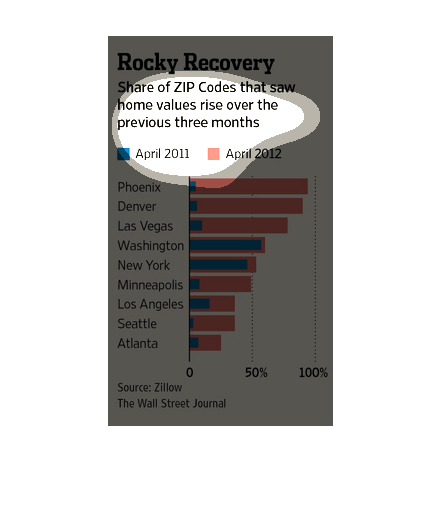
The figure presented to the left is titled Rocky Recovery.  The figure is a representation
of the statistical data for Home value rise in various zip codes.
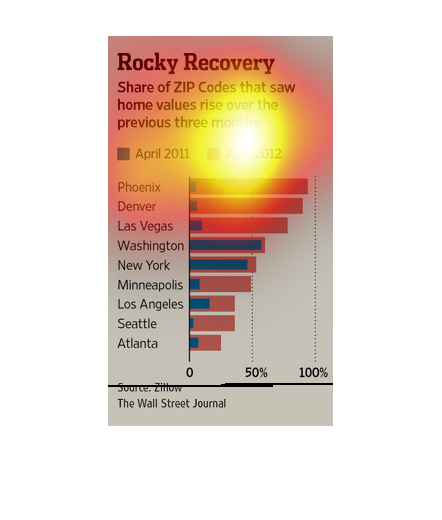
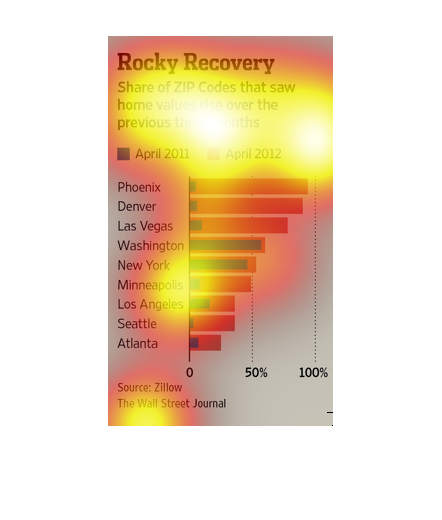
This chart from the Wall Street Journal shows how the real estate recovery is uneven and some
zip codes are experiencing faster growth in home values
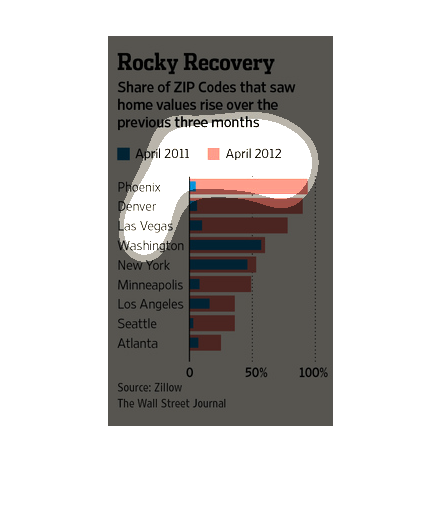
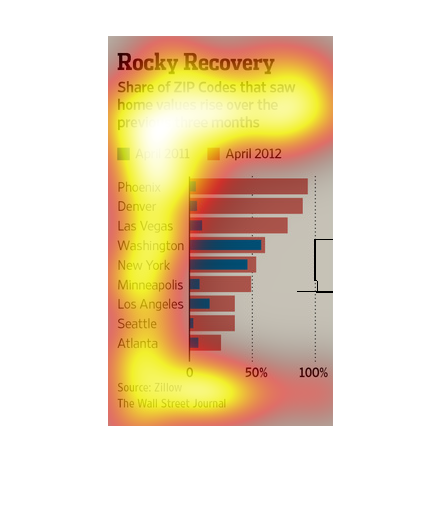
Different zip codes that saw home values rise in a three month span, starting in april of
2011. The top three cities are Pheonix, Denver and Las Vegas.
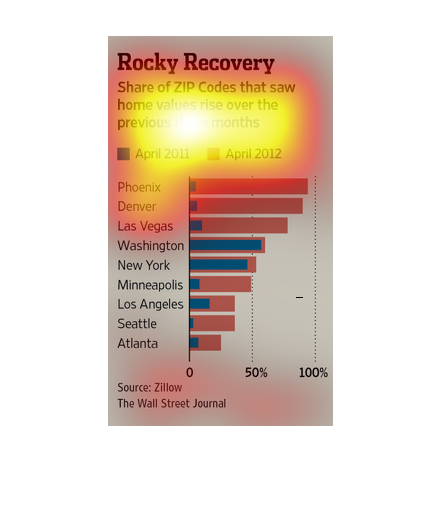
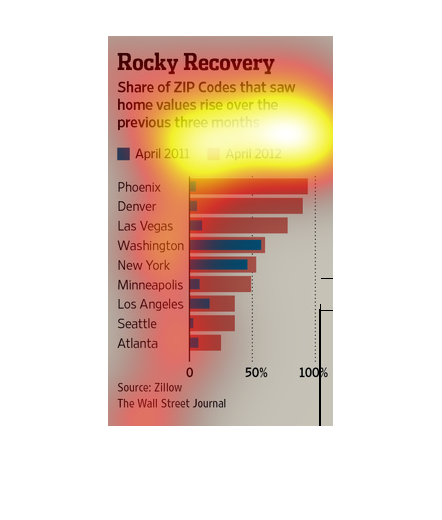
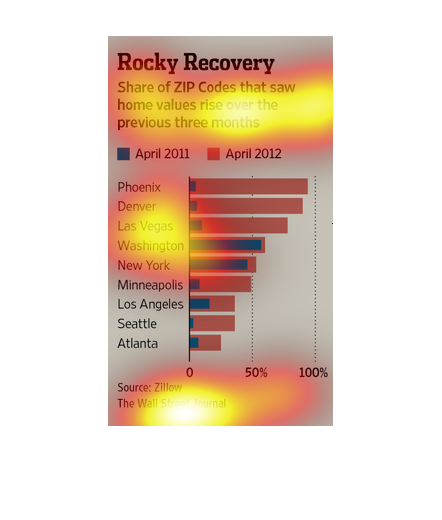
This is a bar graph comparing American cities in terms of how quickly their housing markets
have recovered from the 2008 Great Recession. It shows that cities such as Phoenix have recovered
more quickly than other cities such as Atlanta, which have not recovered.
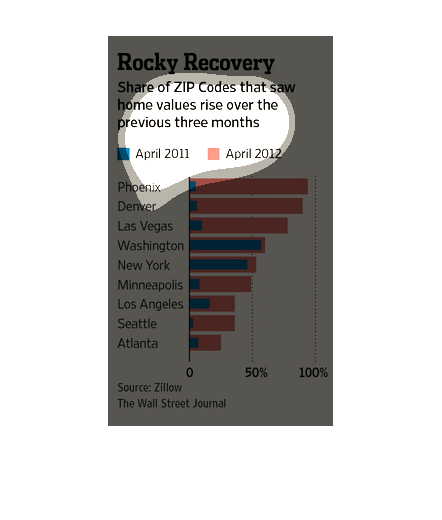
This is a line graph measuring the recovery of home prices a few years after the 2008 economic
recession. It compares 2011 prices to 2012 prices. Home prices in places like Phoenix are
recovering much more quickly than home prices in places like Atlanta.