The image depicts how Switzerland's central bank has discouraged investors from fleeing to
France as a safe haven during the eurozone crisis. Traders are skeptical. The foreign exchange
rate is hovering at 28%.
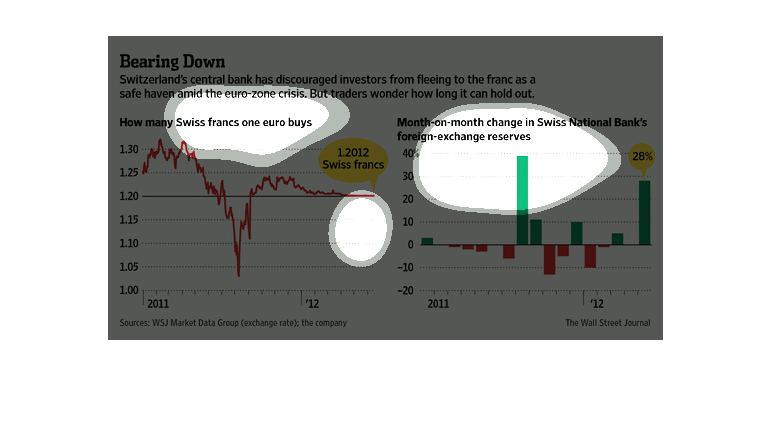
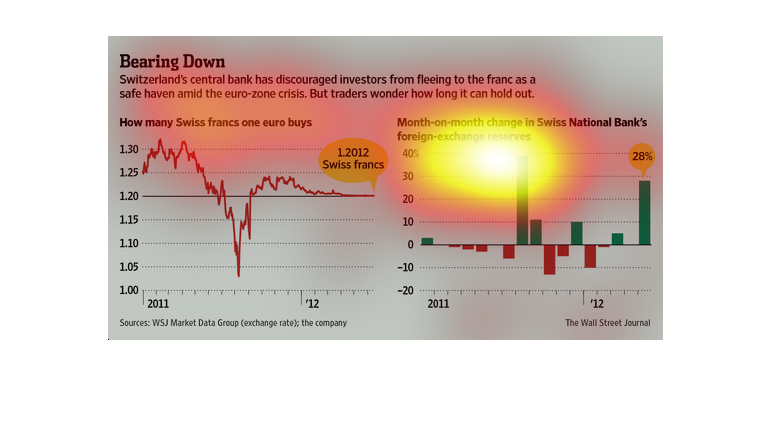
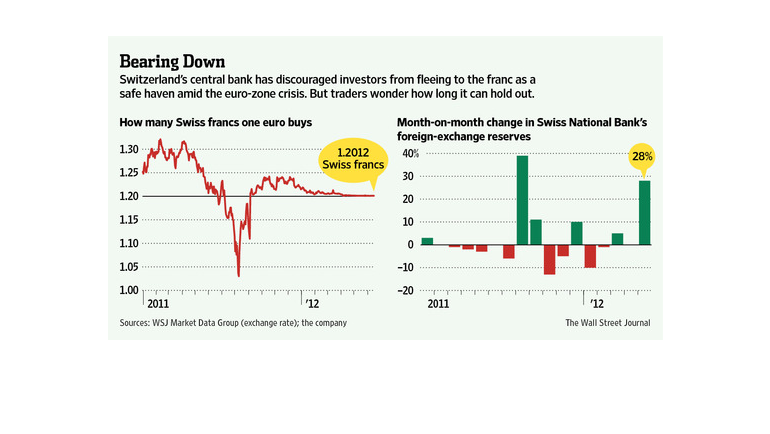
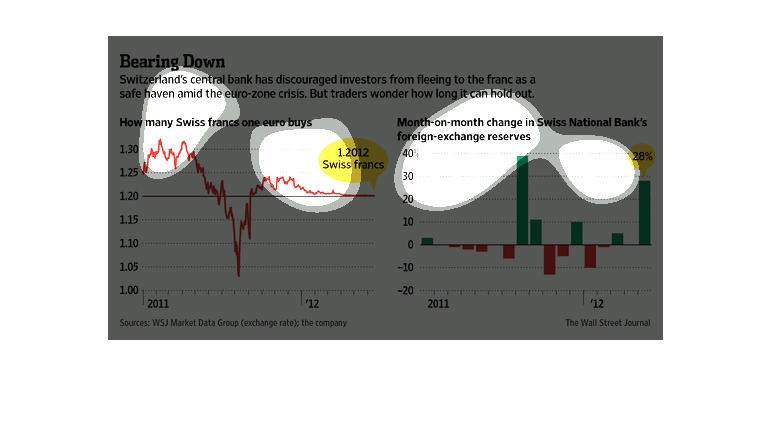
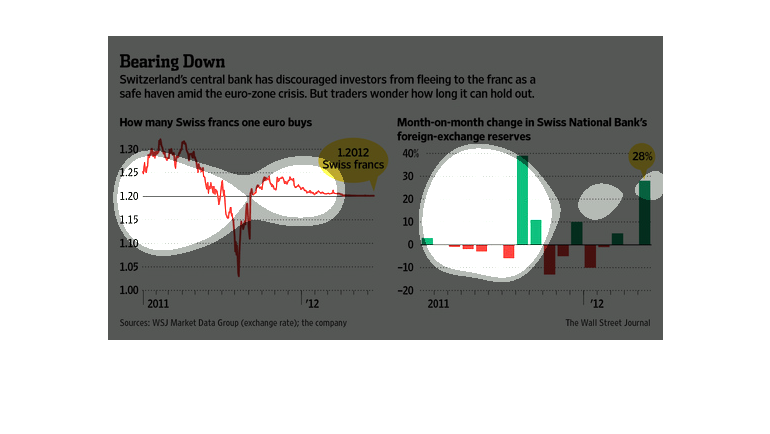
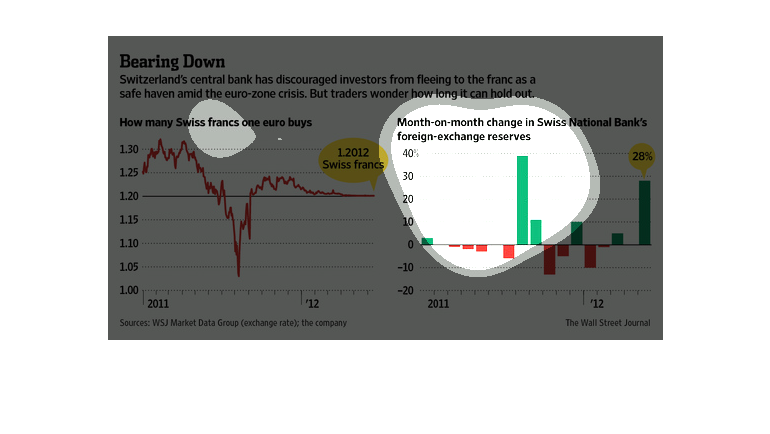
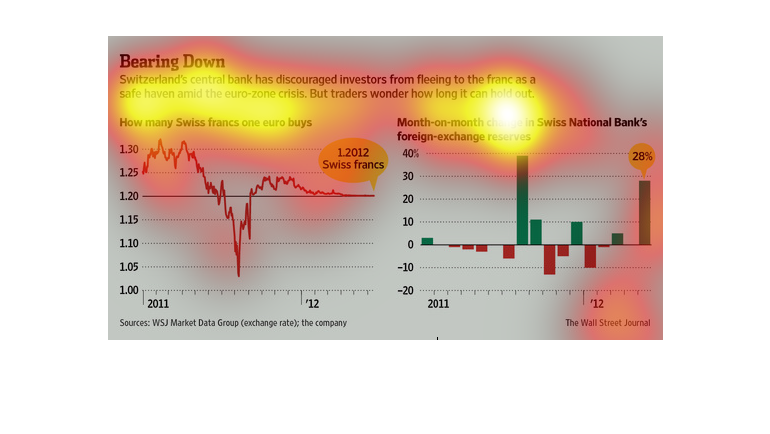
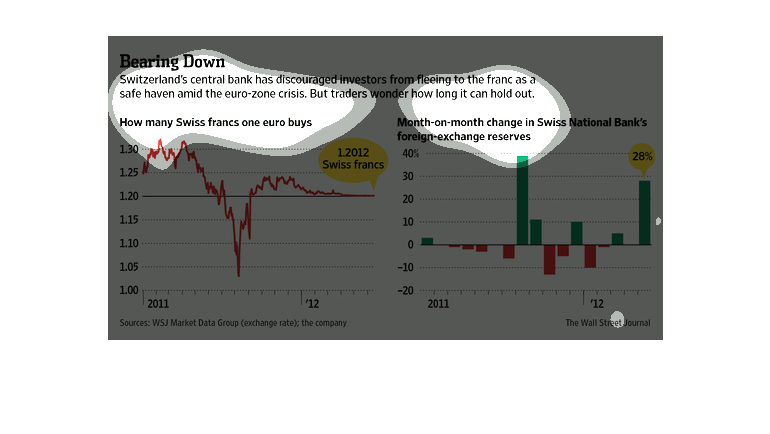
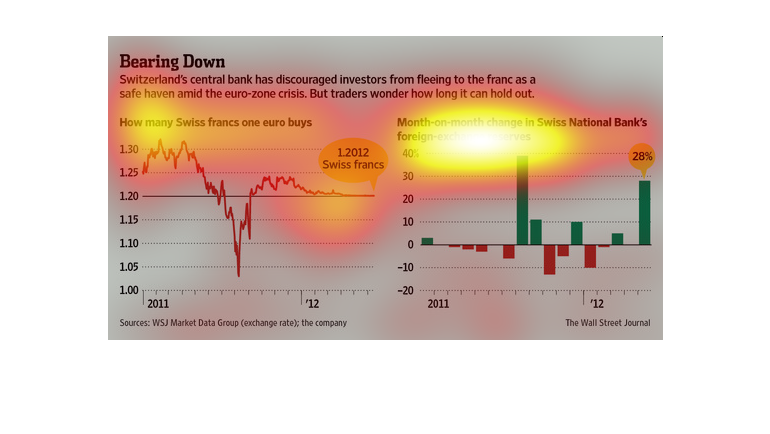
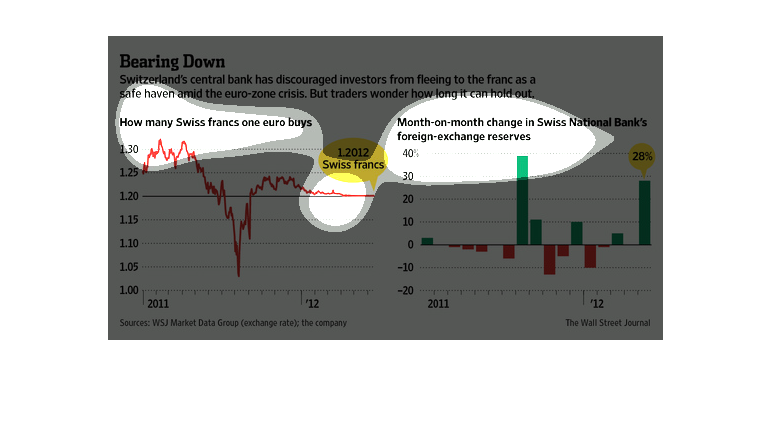
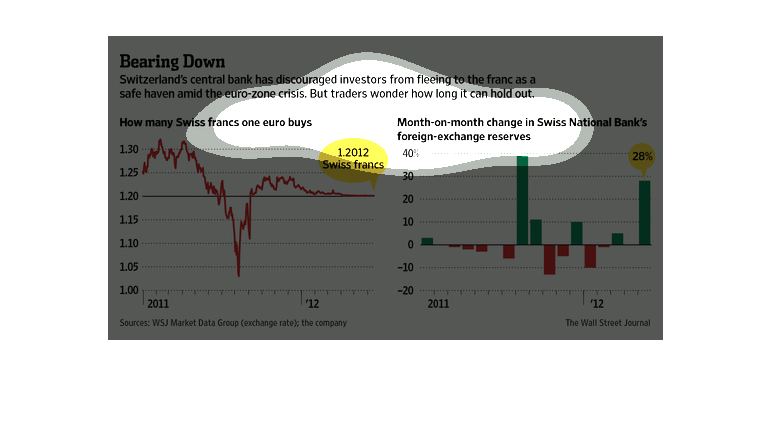
The caption for this image is, "Bearing Down, Switzerland's central bank has discouraged investors
from fleeing to the franc as a safe haven amid the euro-zone crisis.  But traders wonder how
long it can hold out."  One of the two present graphs displays how many Swiss francs one euro
can buy.  The other graph shows month-on-month changes in Swiss National Bank's foreign exchange
reserves.
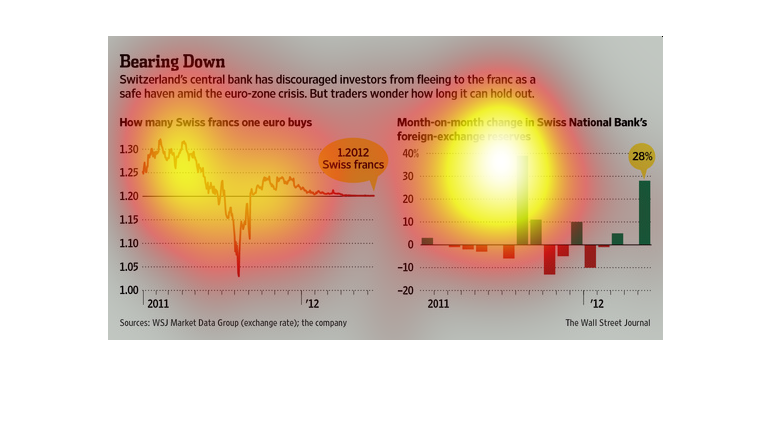
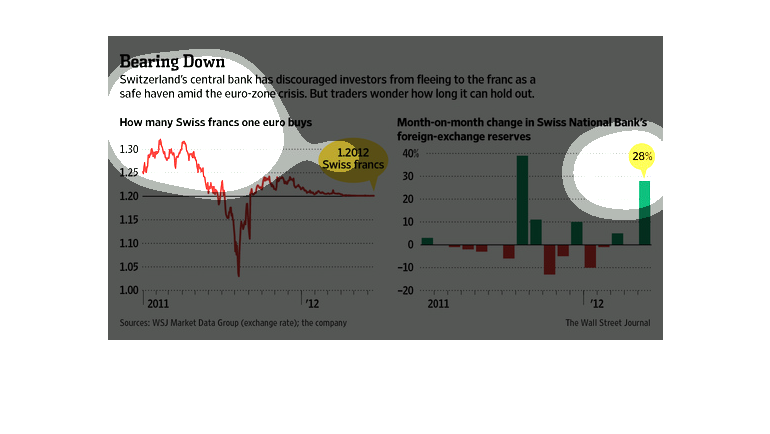
This chart shows two graphs depicting the exchange rate for francs and euros over time. Overall,
the rate has decreased over time. The image also explains how bankers are reacting.
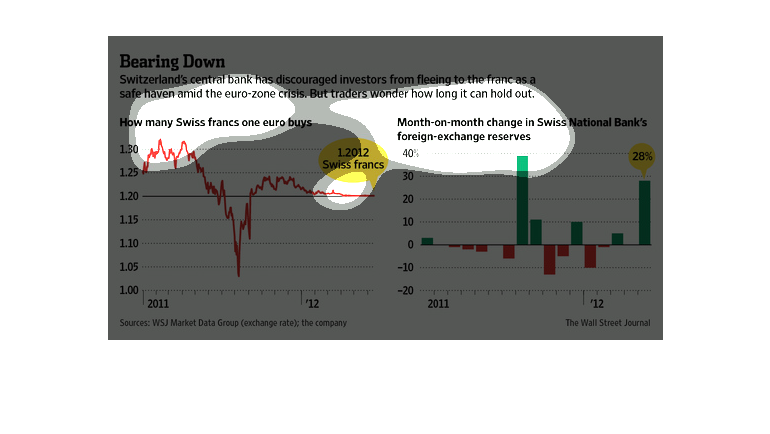
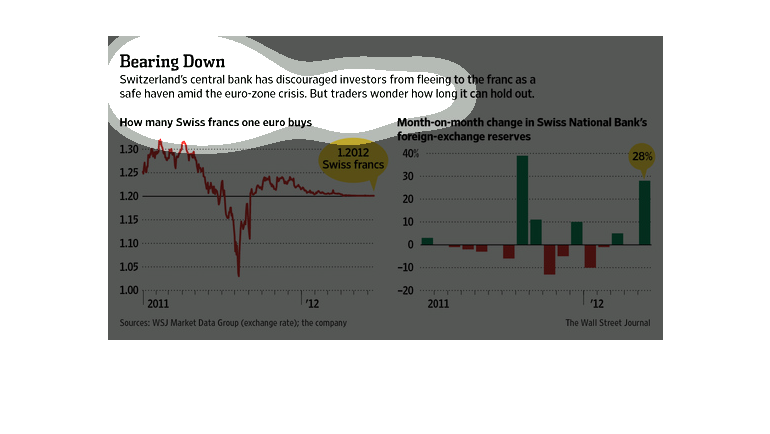
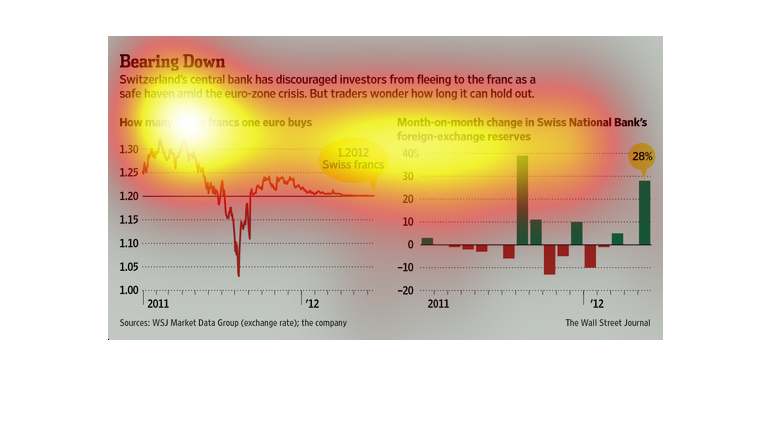
The first chart shows the exchange rate from Swiss Francs to Euro from 2011-2012 with a sharp
decline in the center of the time period and a stagnantion around 1.20.  The second chart
shows the corresponding deposits in the swiss national bank.
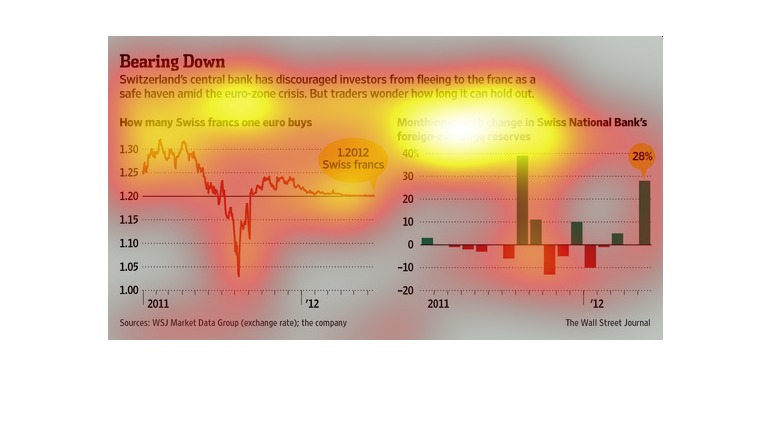
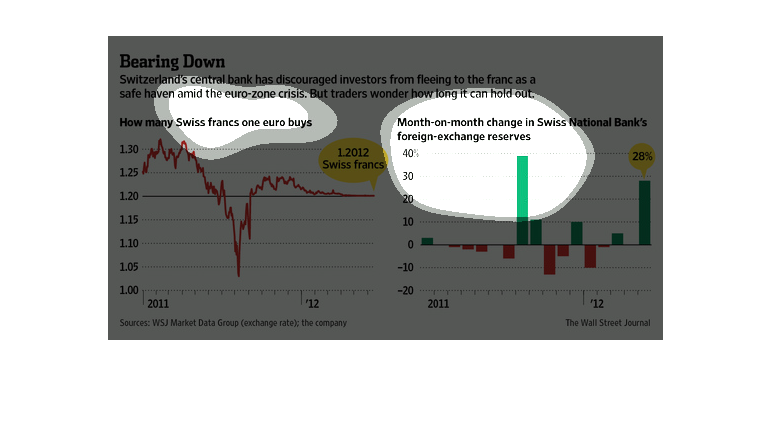
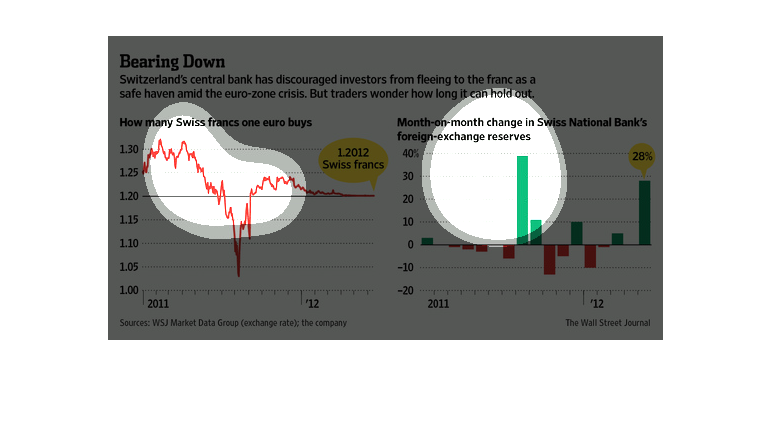
The graph on the left shows how may Swiss francs one Euro buys and the right shows the month
over month change in Swiss National Bank's foreign exchange reserves.
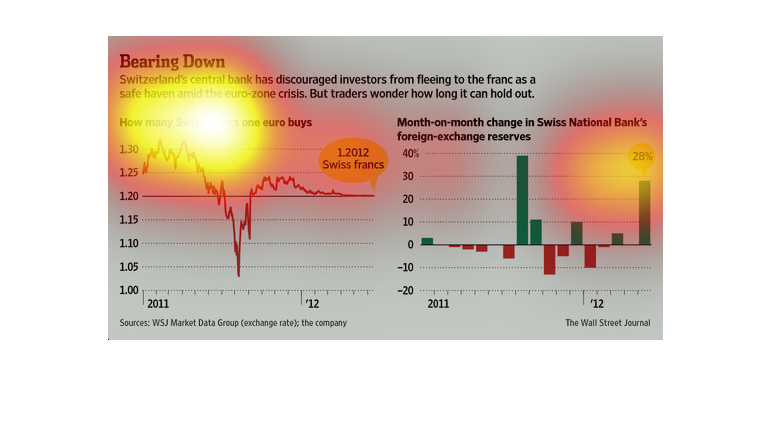
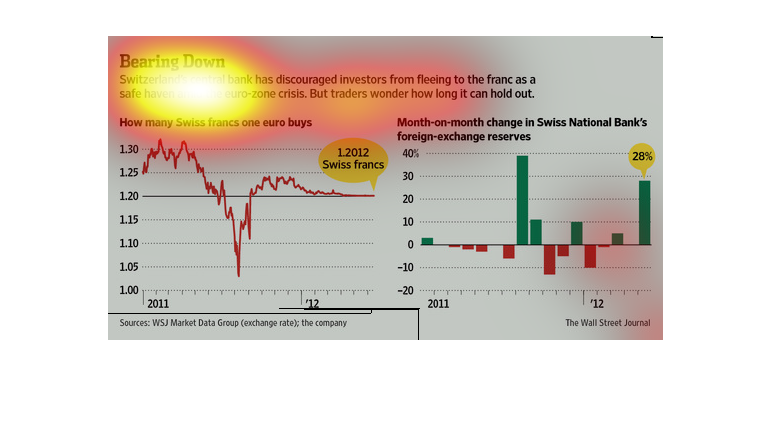
This chart from the Wall Street Journal shows how the Swiss central bank is trying to stem
the capital inflow into the currency to prevent it from getting too strong
This image discusses Switzerland's central bank discouragement of investors in fleeing the
Swiss franc as a safe haven amid the Eurozone crisis. But traders worry that it may not last
long.  Two graphs back up this claim. One does this by tracking foreign exchange reserves.
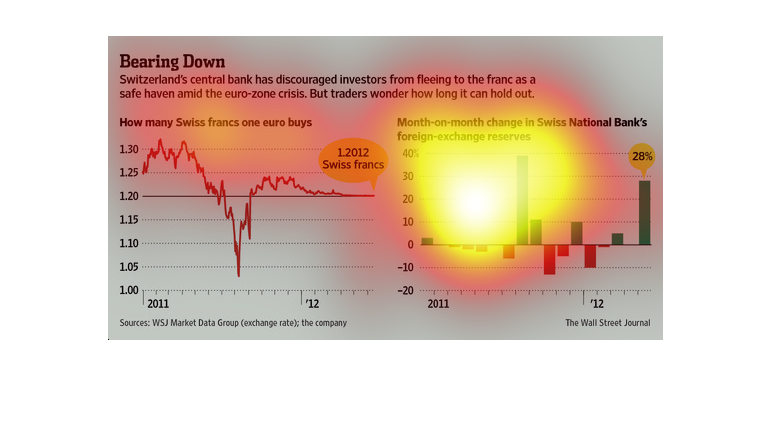
This is a set of graphics evaluating the state of the Swiss economy, particularly the Swiss
franc, in light of crises in the Euro Zone, to which Switzerland is not directly connected
in terms of currency. The graphic shows that Swiss investors are emphasizing the franc.
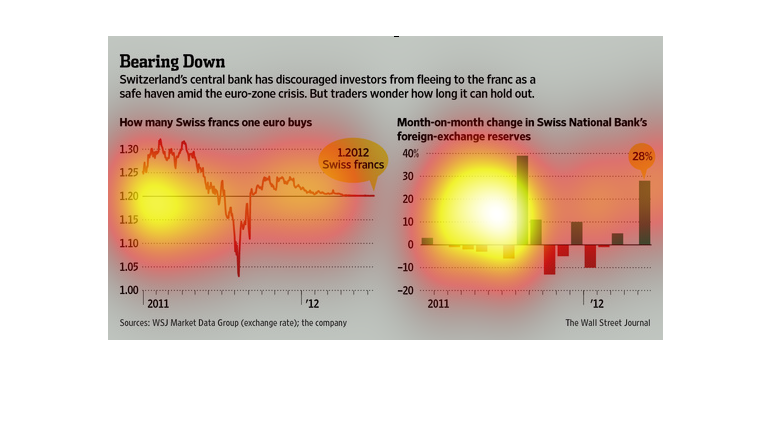
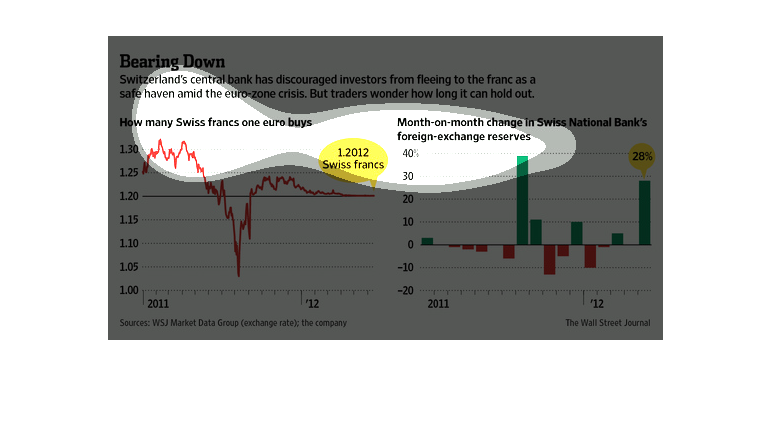
The first graph shows the  relation between the Swiss Franc and the Euro between 2011 and
2012. The second graph details changes in the Swiss National Bank's foreign exchange reserves
in the same year.
This chart describes bearing down. Specifically, Switzerland's central bank has discouraged
investors. Different categories are represented by different colors.
The figure presented is titled Bearing Down.  The figure is a representation of the statistical
data for Switzerland's Central bank discouraging investors.
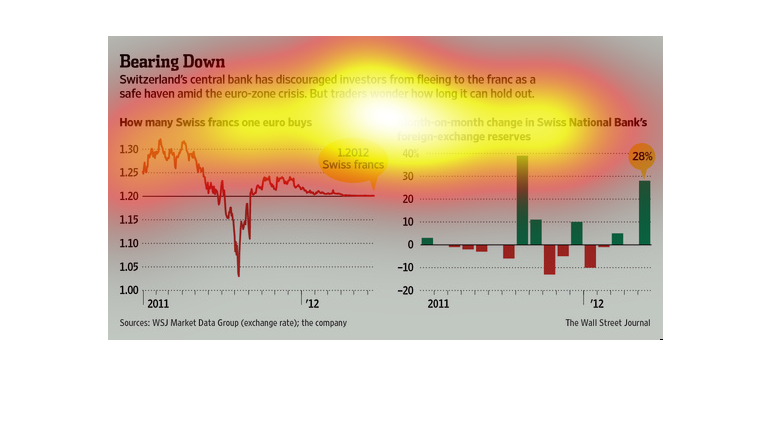
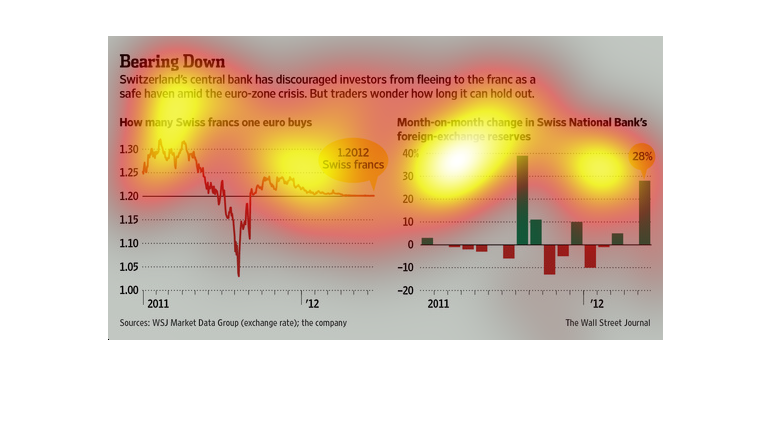
This chart from the Wall Street Journal shows how the Swiss central bank was trying to stem
the flow of money into the franc, which was pegged to the euro
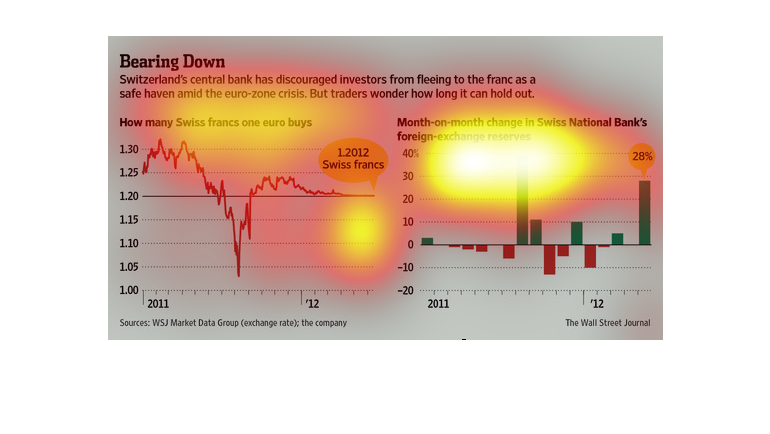
This image shows one chart depicting the change in how many Swiss francs one euro can buy
over time and another showing a monthly change in the Swiss National Bank's foreign exchange
reserves.