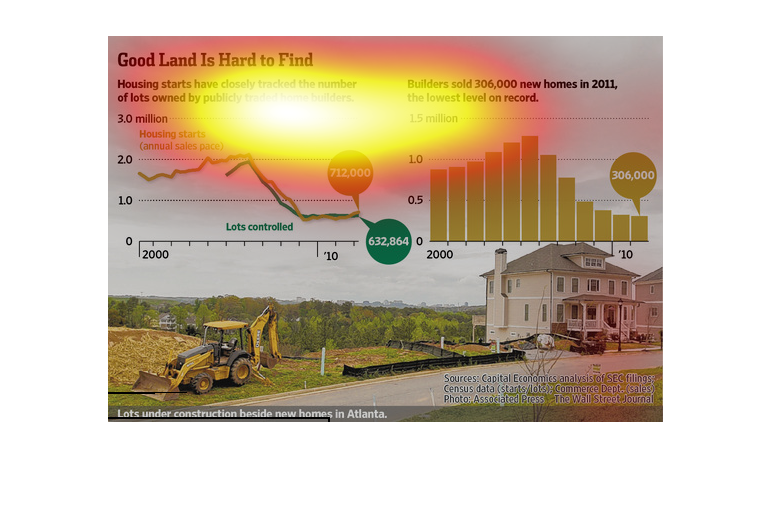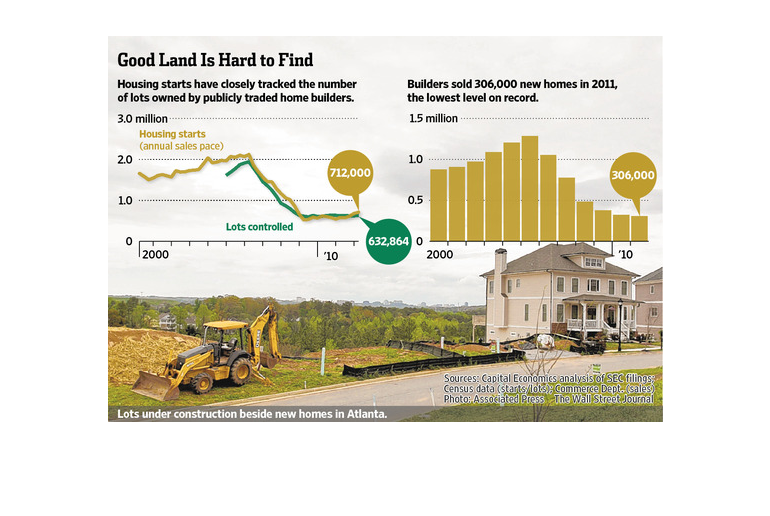
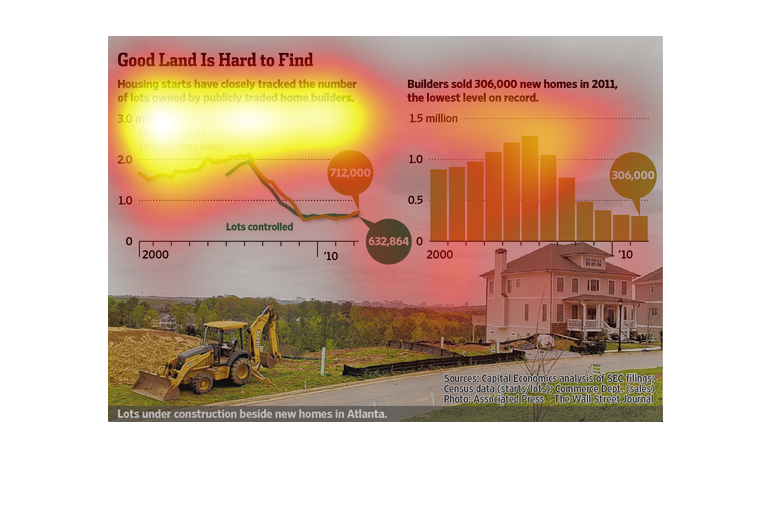
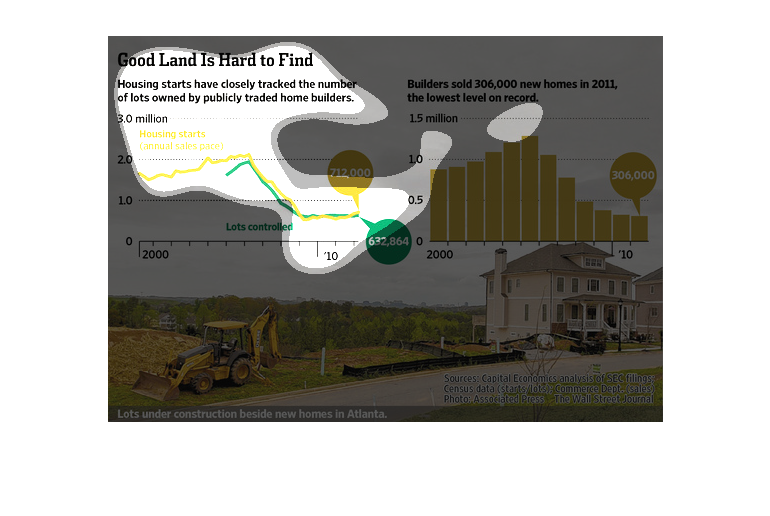
Good land is difficult to find.  Housing starts have closely tracked the number of lots owned
by publicly traded builders.   Builders sold 306,000 new homes in 2011, the lowest level on
record.
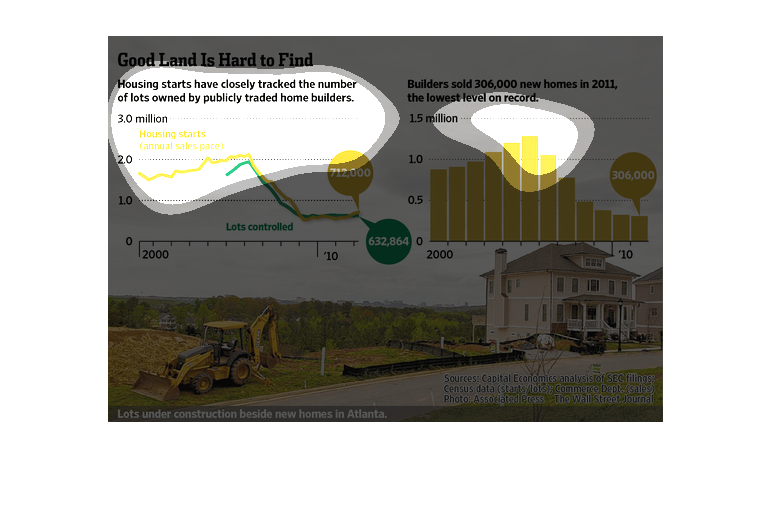
This graph is entitled "Good Land Is Hard to Find" and  show how many new homes are being
built and how many were sold. The graphs show steady decreases in both categories between
2000 and 2011 The bottom show a graphic of a construction site with a bulldozer.
This is graph is illustrating the number of housing lots owned by publicly traded home builders.
The graph depicts the amount of lots and the number of lots owned.
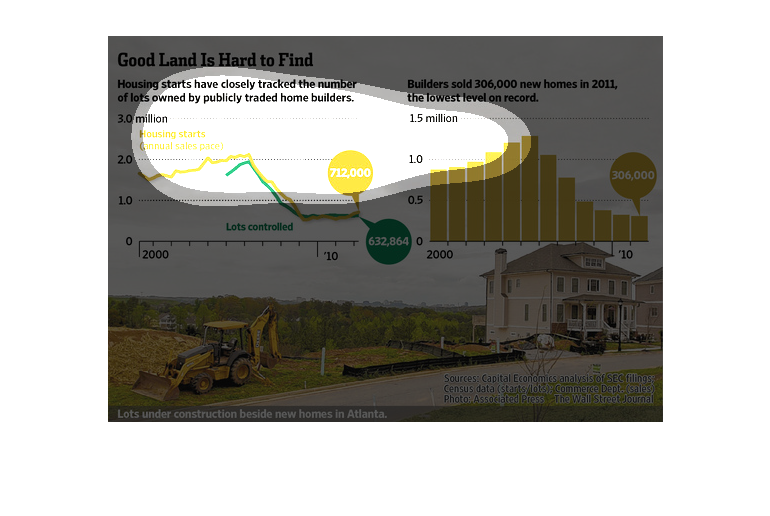
This image is entitled "Good Land is Hard to Find."  It shows a new home in Atlanta next to
a lot that is under construction.  The graph shows how housing starts have closely tracked
the number of lots owned by publicly traded home builders (2000-2010).  The image appeared
in The Wall Street Journal.
These graphs depict the difference between Housing starts v.s. lots owned by publicly traded
home builders with a decrease of starts over increase of lots and on the right the number
of new homes that builders sold with the lowest showing in 2010.
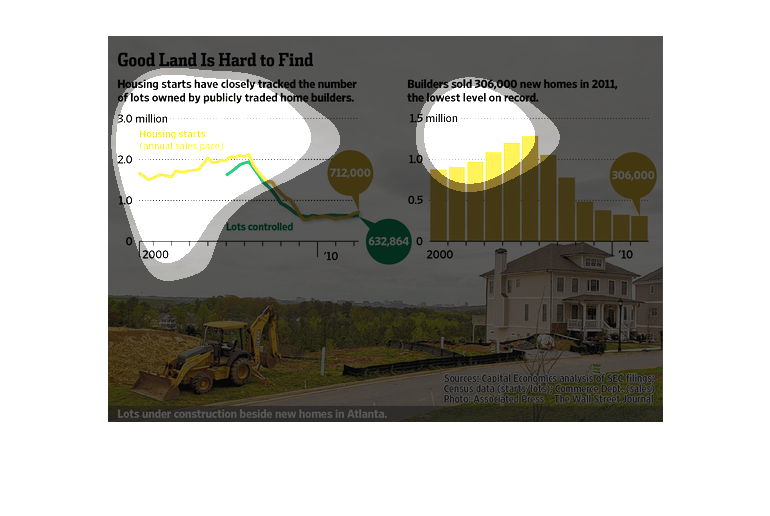
2 graphs showing the decline of controlled building from 2000-2010. It also shows an image
of a lot I de construction. In the corner the image sites it source for the information and
the picture.
This image here depicts how land is hard to find in today's society due to the construction
on local areas for housing and building of neighborhoods. With an increase of housing demands,
people would want more and contractors would comply taking down the land and converting it
to space for housing effectively destroying it.
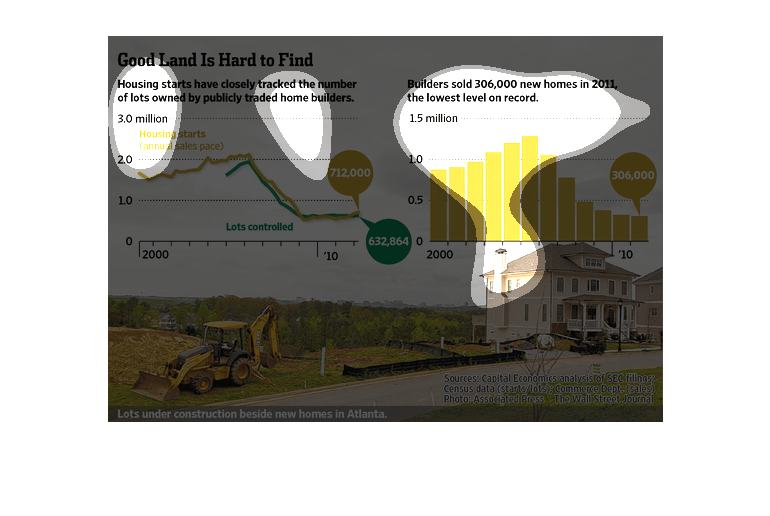
The figure presented to the left is titled Good Land is Hard to Find.  The figure is a representation
of the statistical research data for housing starts.
This image is entitled "Good Land is Hard to Find."  It shows housing starts have closely
tracked the number of lots publicly owned by publicly traded home builders.  It also shows
builders sold 306,000 new homes in 2011, the lowest level on record.  The lower half of the
graphic shows a backhoe clearing an empty lot for a new house, and a completed house on the
lot next door (in Atlanta).  Data was compiled for and appeared in The Wall Street Journal.
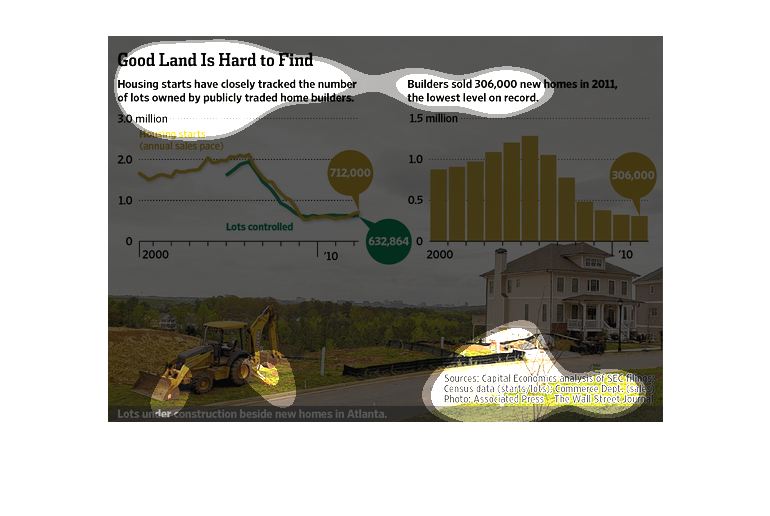
New houses are being sold at low rates compared to the past. Finding good land that people
want to buy is becoming harder and harder, and the rate at which people are buying and selling
land is low.
This chart from the Wall Street Journal shows how housing starts, or construction of new homes,
is slowing down because land is harder to find.
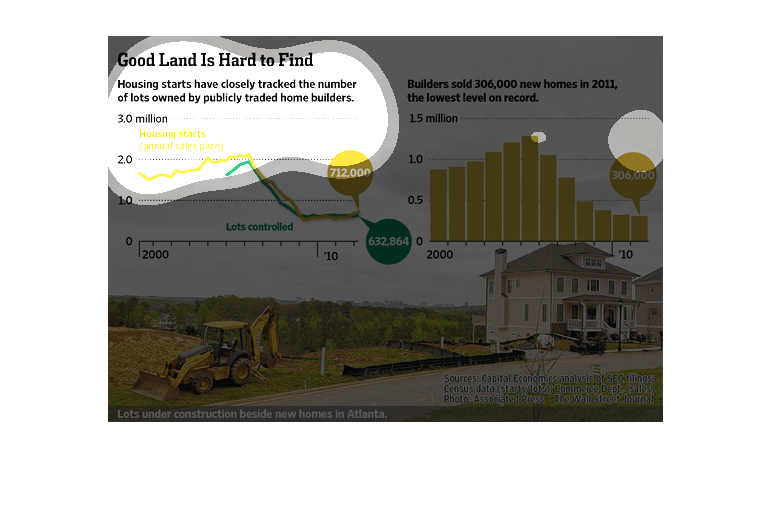
This chart from the Wall Street Journal shows how new housing construction is slowing because
buying good land to build on is hard to find
This chart illustrates housing tracking of number of public lots owned by home builders and
sales of new homes in from the years 2000 to 2011 by builders.
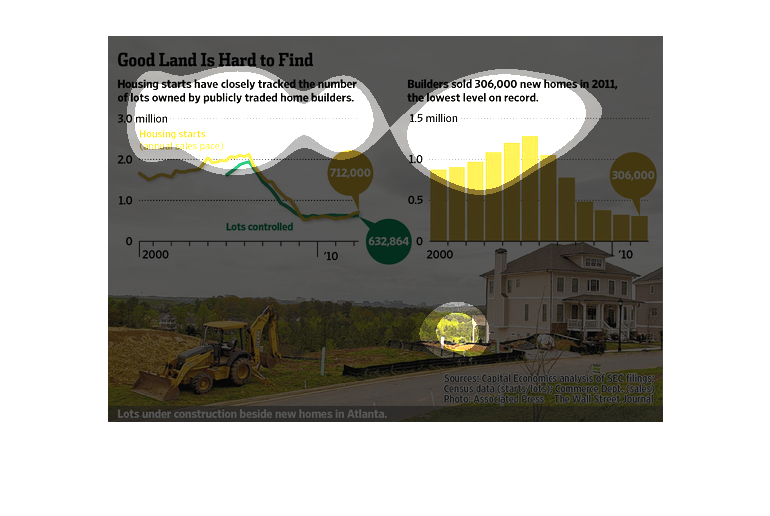
This chart describes good land is hard to find. Specifically, housing starts have closely
tracked the number. Different categories are represented by different colors.