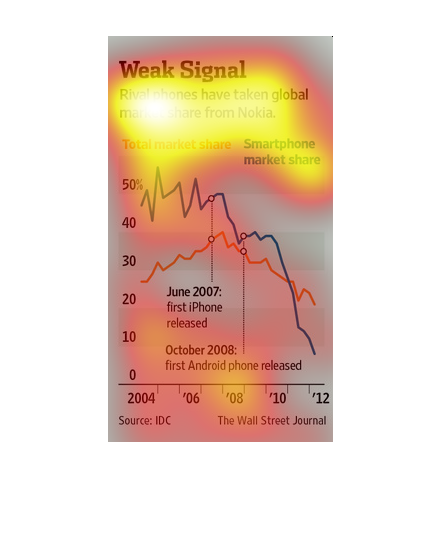
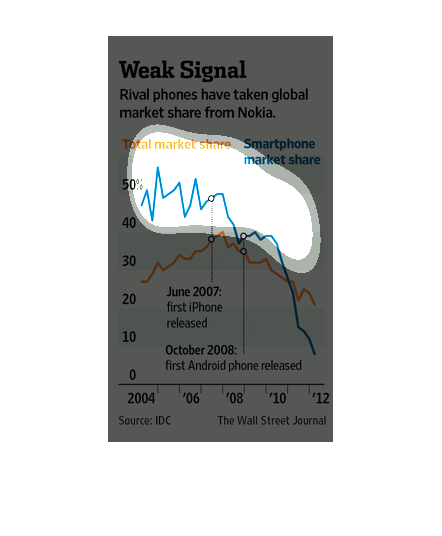
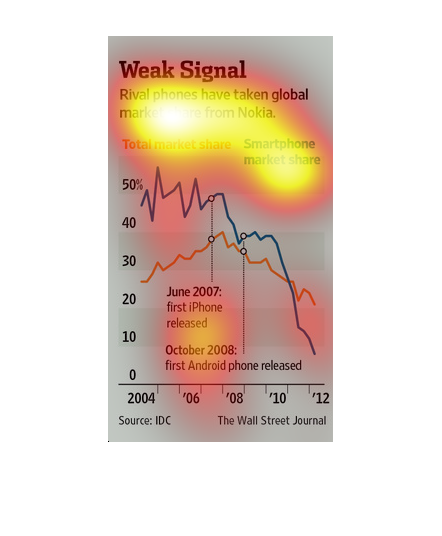
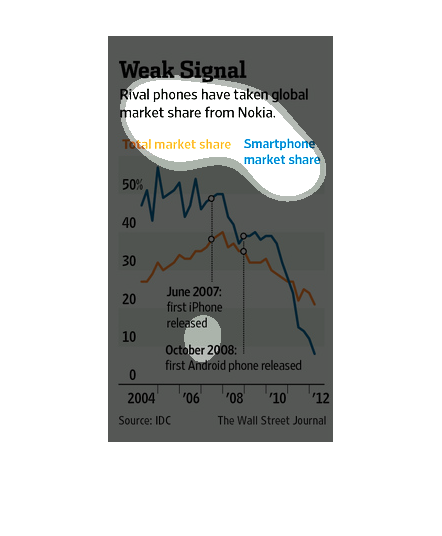
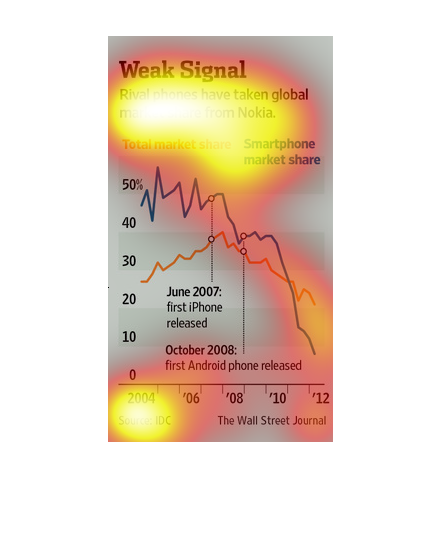
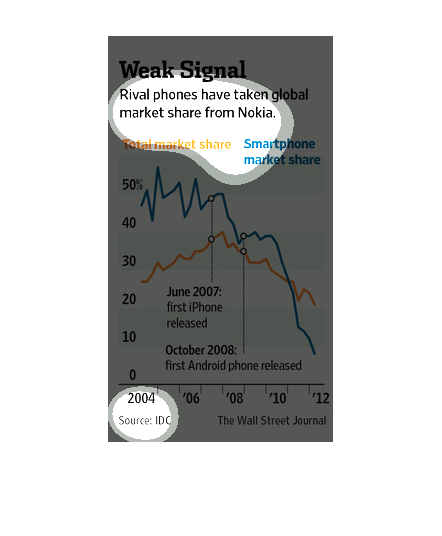
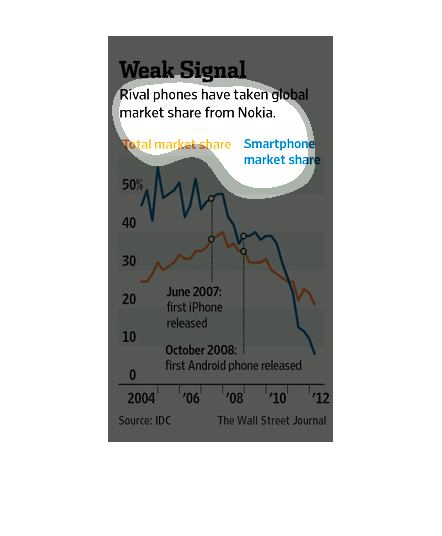
This image shows or depicts in line graph statisitcal format data concerning rival phones
have taken global market share from Nokia. Years are 2004 to 2012.
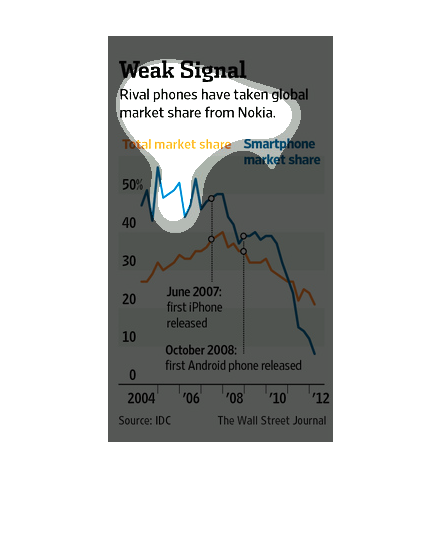
This chart describes weal signal. Specifically, rival phones have taken global market share
from Nokia. Different categories are represented by different colors.
According to IDC, rival phone companies have taken the global market share from Nokia. The
data seems to illustrate that the induction of smartphones caused this. But causation doesn't
reveal correlation, right?
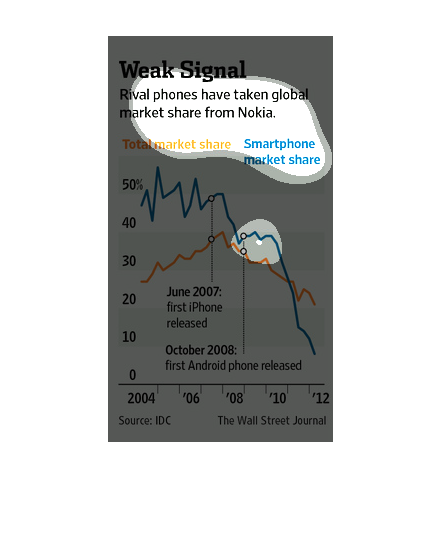
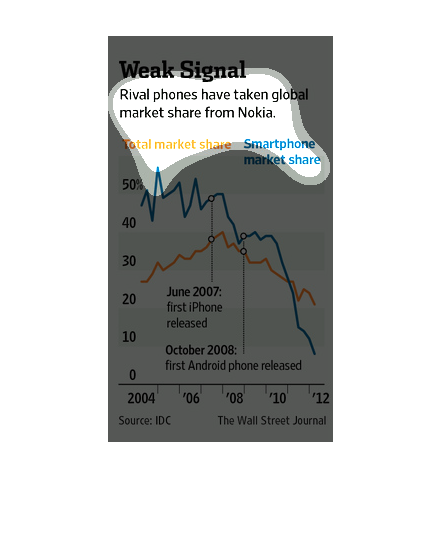
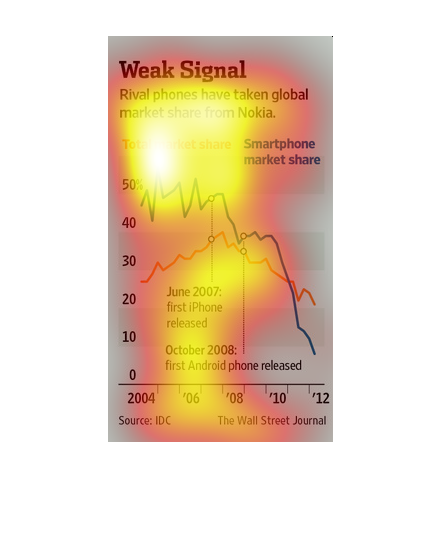
This article is about how rival phone have taken market shares from Nokia. On the bottom of
the article there is a line graph. There are two lines on the graph representing smartphone
market share, and total market share.
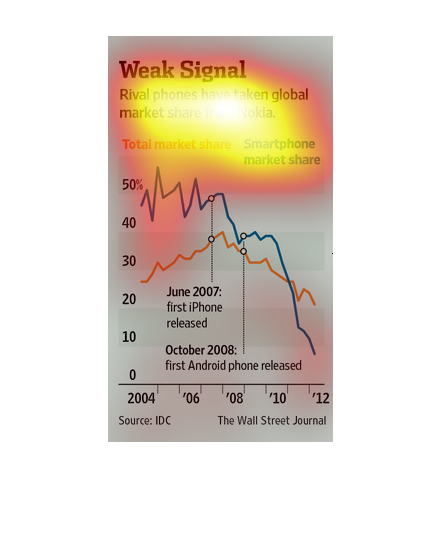
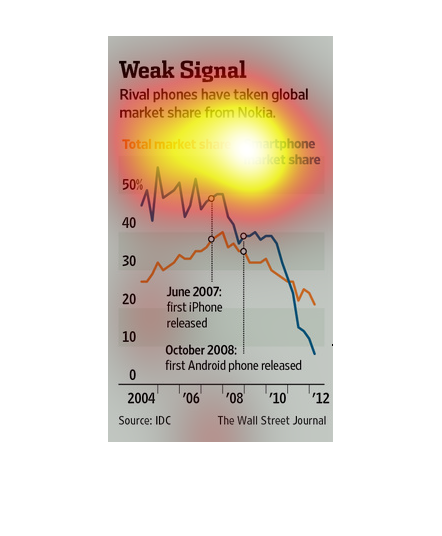
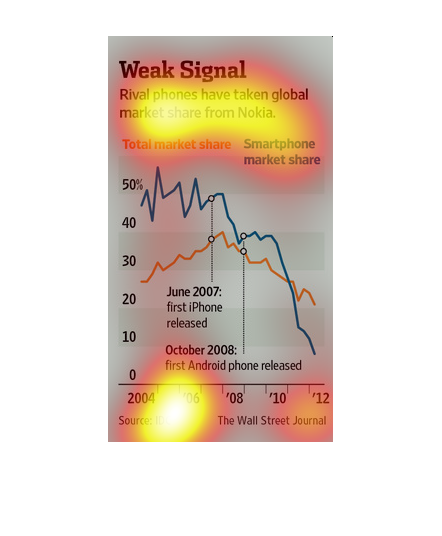
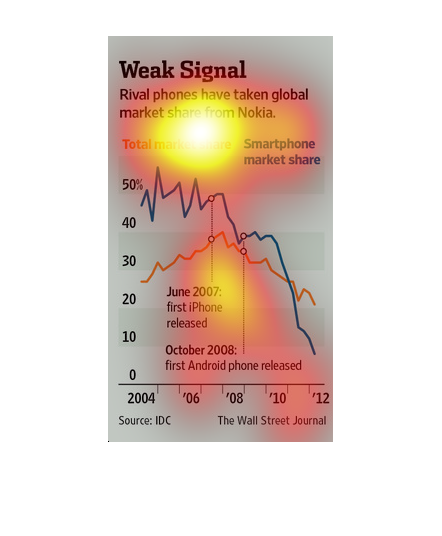
This chart from the Wall Street Journal shows how smart phone makers not named nokia have
grown while nokia has lost market share since the introduction of better smart phones
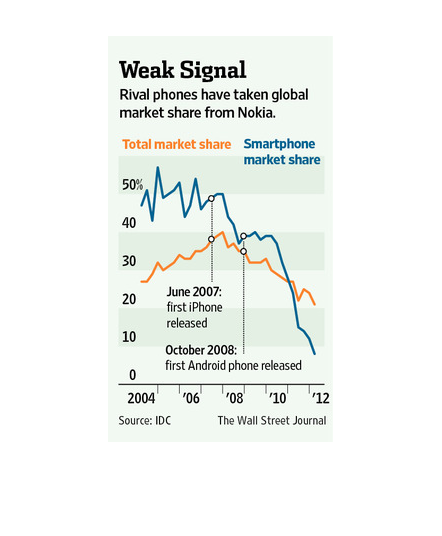
The image depicts rival phones taking global market share from Nokia. The data shows Nokia's
global market share plunging in the face of competition from Apple and Android to all-time
lows.
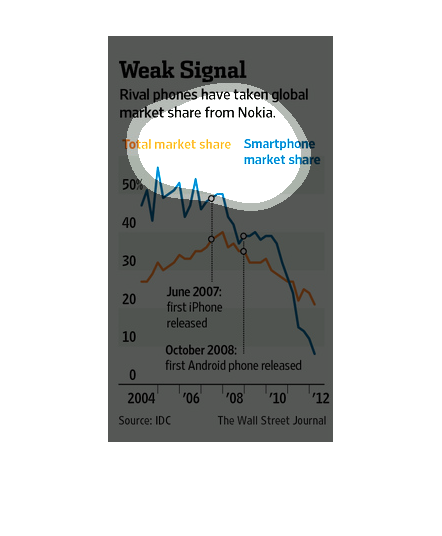
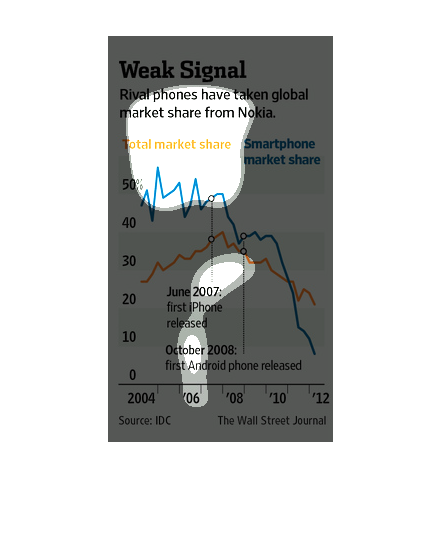
Based on this graph, rival phone companies have taken the market share away from Nokia. The
results in the graph are from the Wall Street Journal and they show the regular and smartphone
market shares from 2004 through 2012.
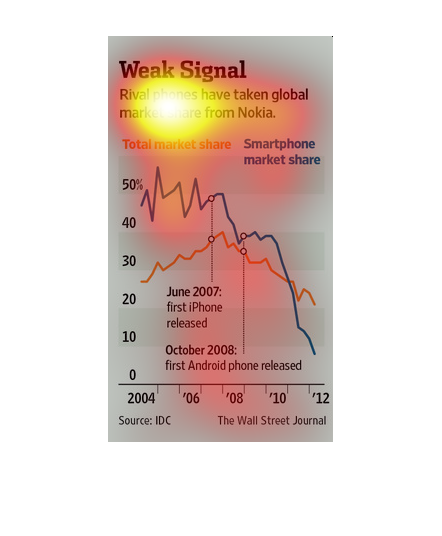
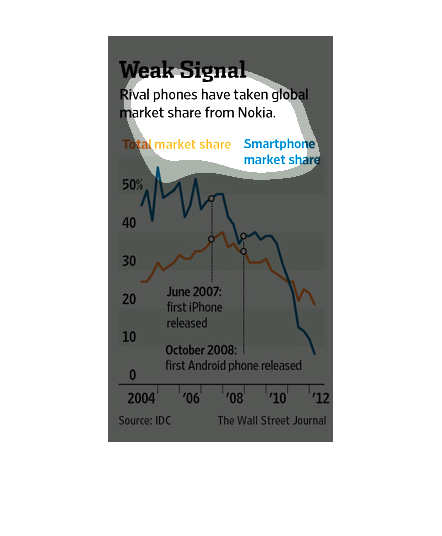
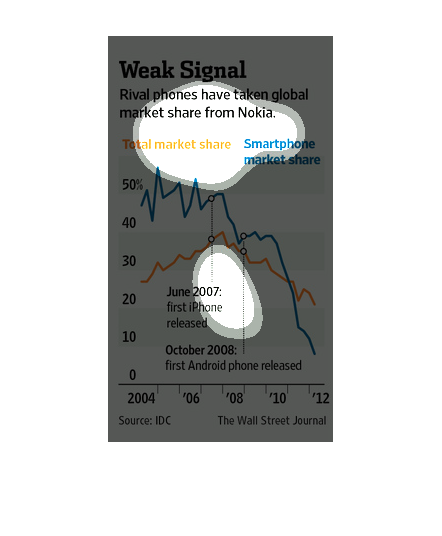
In this study conducted by the Wall Street Journal- with information obtained from the IDC,
circa 2004 to 2012- we see that the once powerful giant Nokia has lost a lot of market share.
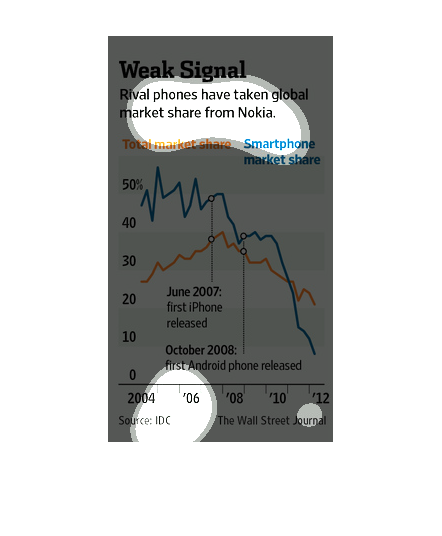
The image shown is called Weak Signal and discusses the global market of phones, specifically
how over time Nokia's hold in the market was overrun by the global entities.
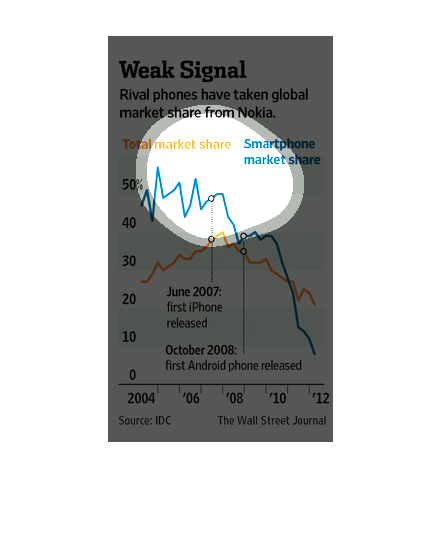
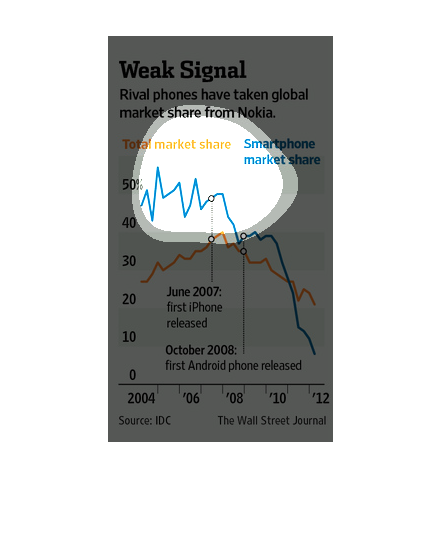
Rival phones have taken global market share from Nokia. iPhone release is the first point
in the drop of Nokia's global and smart phone market share. Similarly, with the first Android
release, their market shares dropped drastically.
This is a line graph of market share among cell phone companies. The graph compares cell phone
maker Nokia to rival companies. The graph shows that over time, Nokia's market share relative
to its competitors has been in a state of decline. The graph shows significant historical
events in the time period.
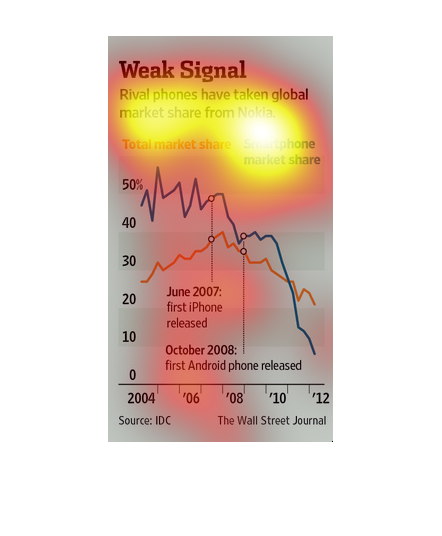
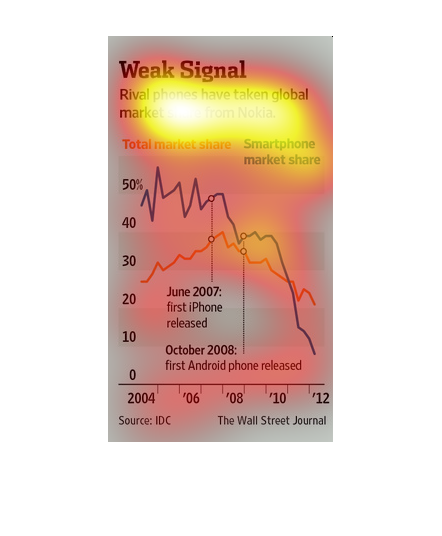
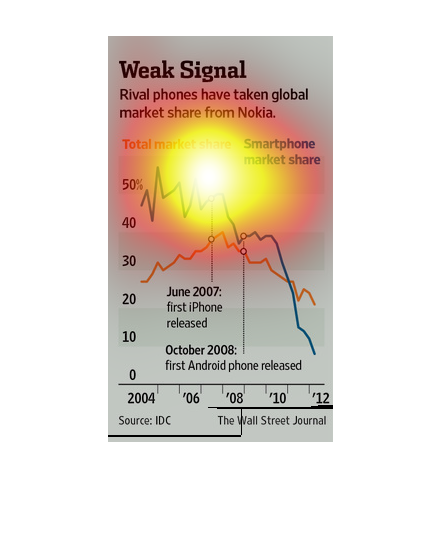
This chart shows how Nokia's market share of the cellphone industry has increased while other
competitor's market share has increased over time. Also marked are large events, such as the
release of the first iPhone.
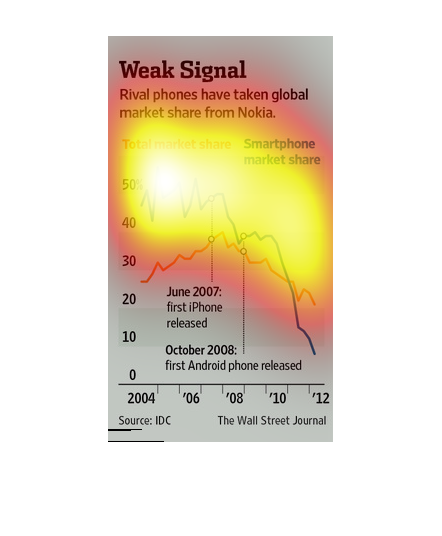
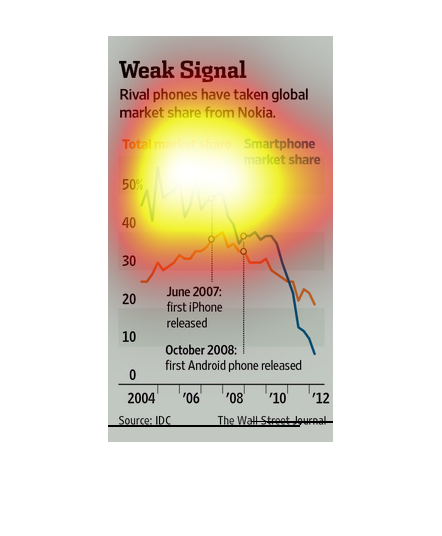
This chart from the Wall Street Journal shows how Nokia is losing market share to other smart
phone manufacturers and this is becoming a significant problem to their revenue growth
This image shows how Nokia's share of the global cell phone market is decreasing. As more
smartphones, such as iphones and androids, have been introduced, Nokia has had a smaller amount
of market shares each year.