This image is about hurricane Sandy and its aftermath. Ten lives were claimed by it in one
flooded area alone.  The accompanying graph is of New York City and highlights the hotspot
problem areas.
This chart from the Wall Street Journal shows how Superstorm Sandy wreaked havoc and damage
on the New York area and where the major flooding occurred
This image shows or depicts using New York geographical statistical format how hurricane Sandy
in one certain spot claimed 10 lives in one flood prone spot.
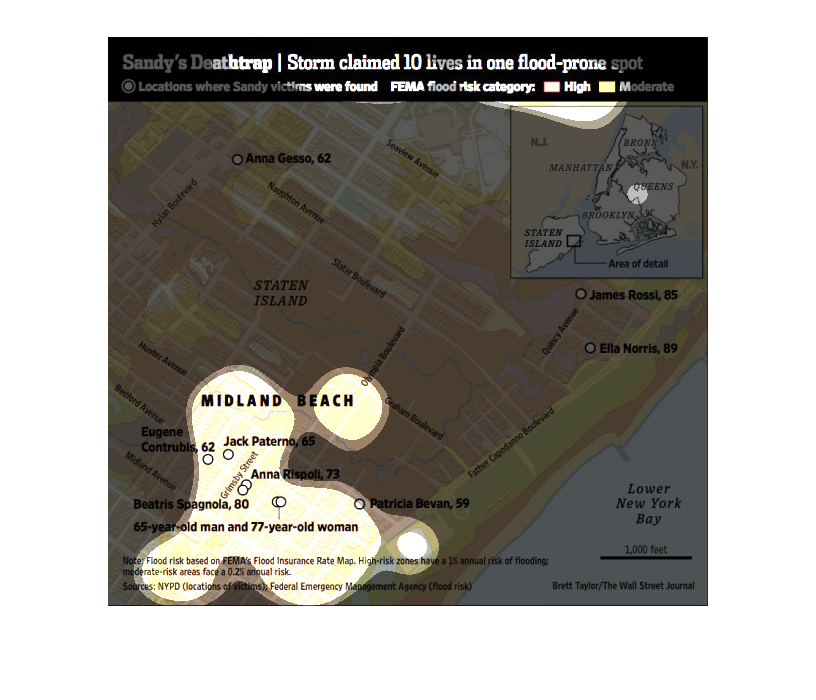
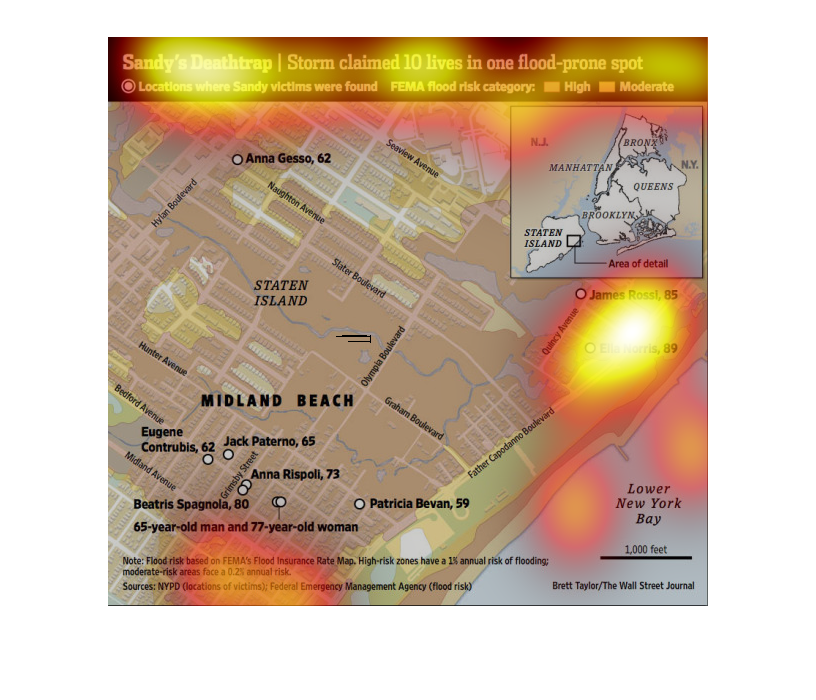
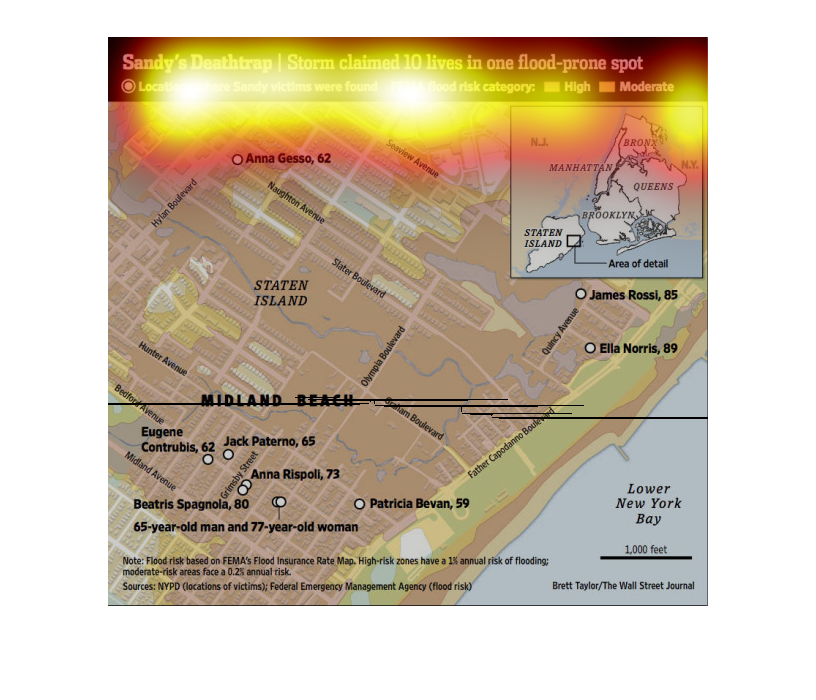
A map of a beach following a storm that provides information of where the people who died
as a result of the storm were found overlayed against how severe the storm was in certain
areas.
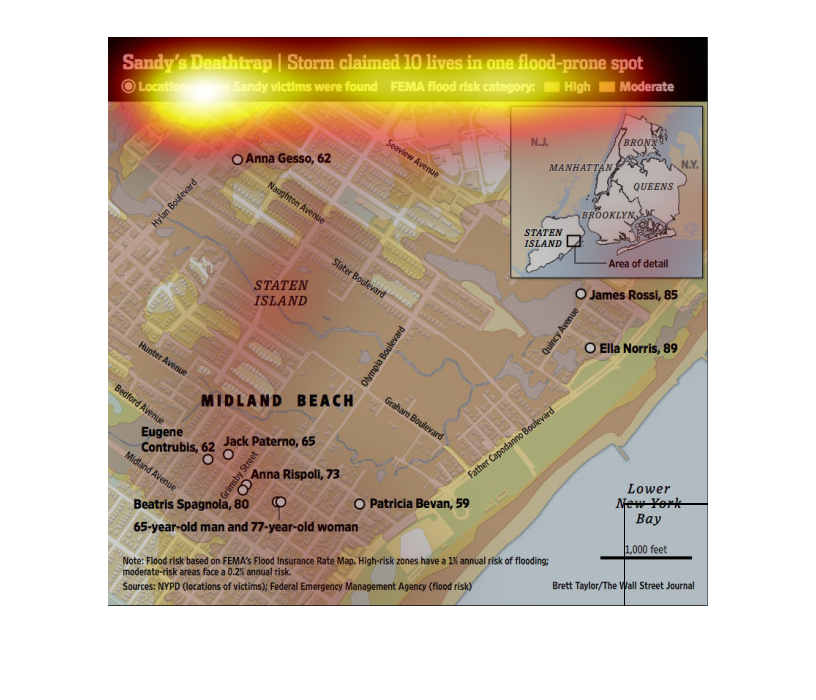
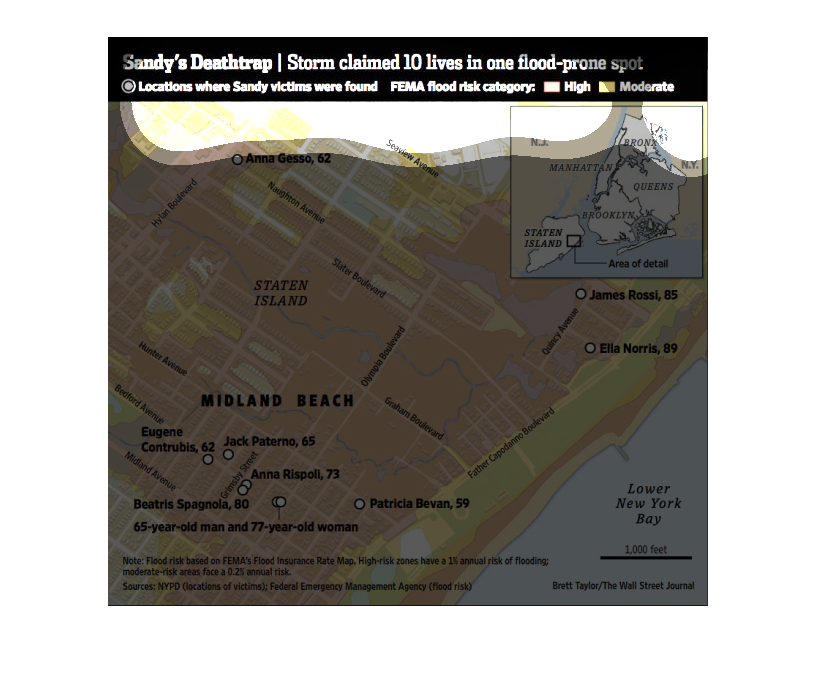
This is map of the entire area of the Hurricane Sandy Disaster. It shows that there were any
victims and shows the area of flooding for this hurricane. It shows the locations of the victims
found.
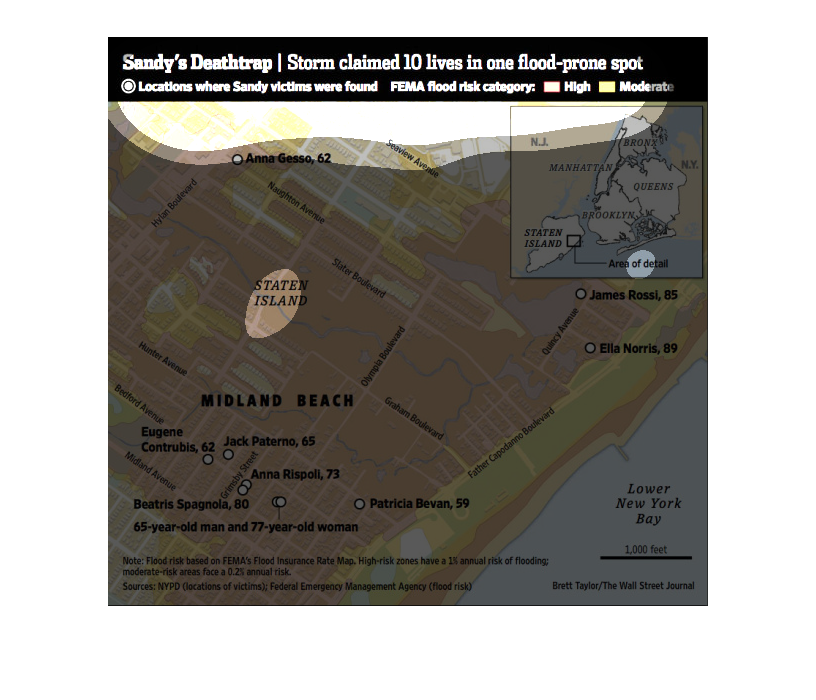
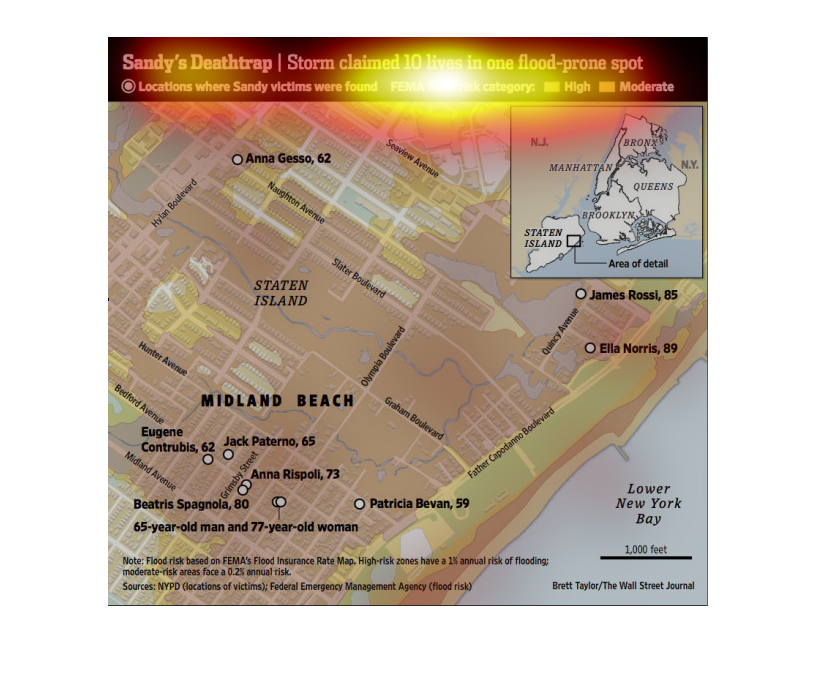
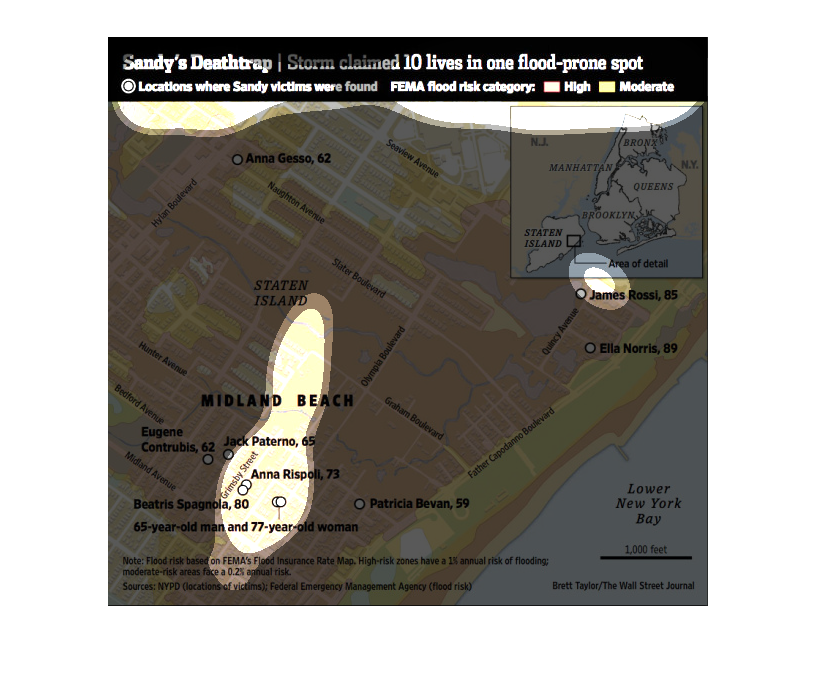
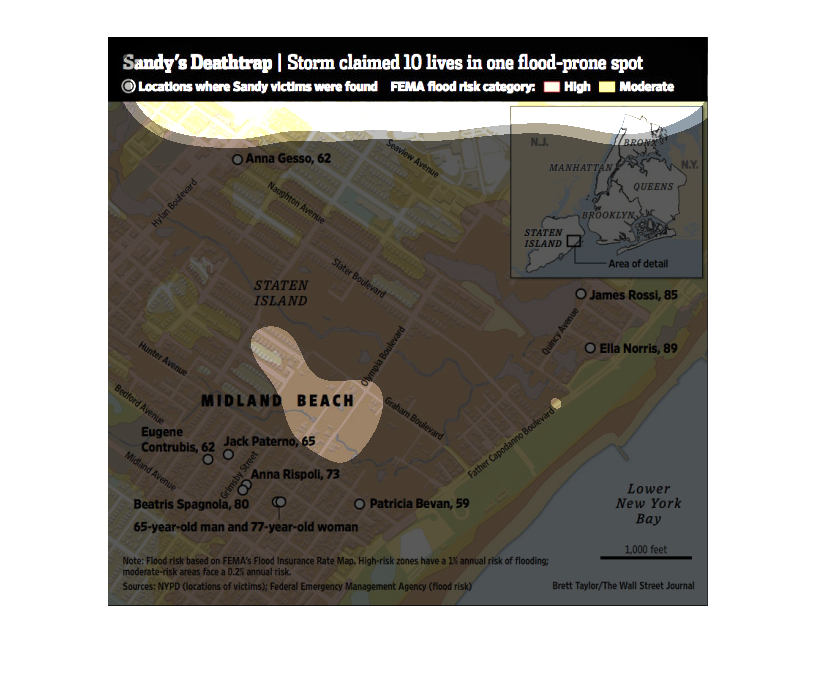
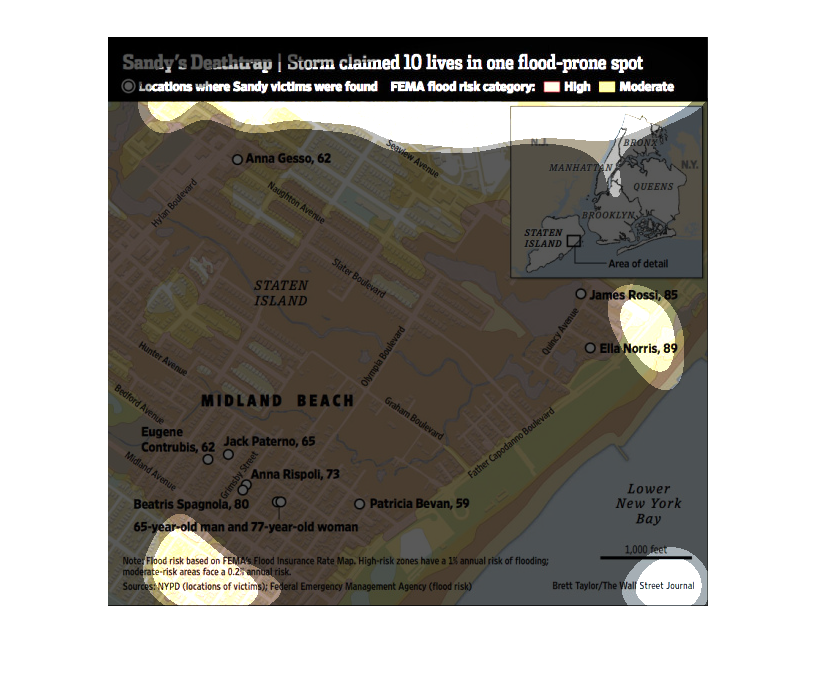
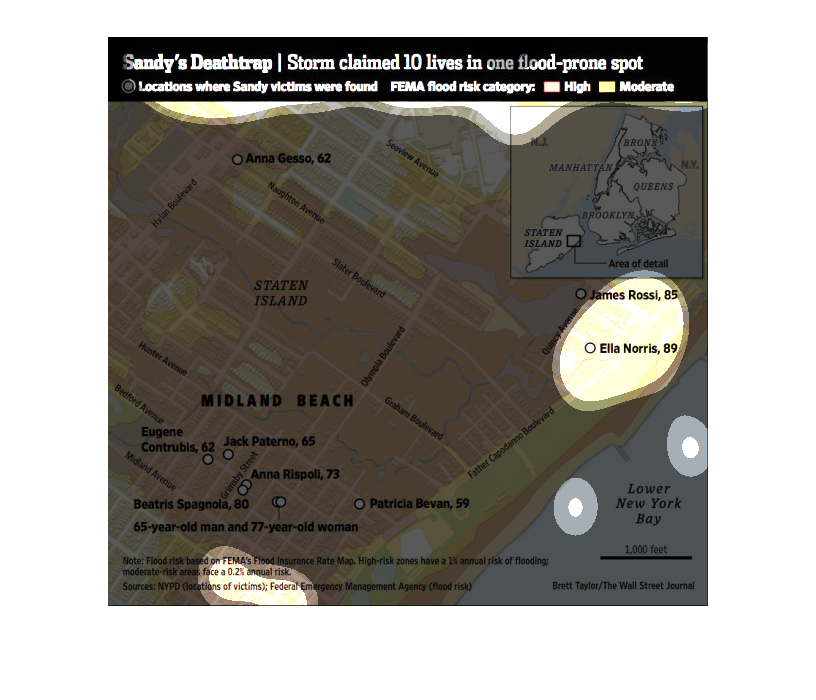
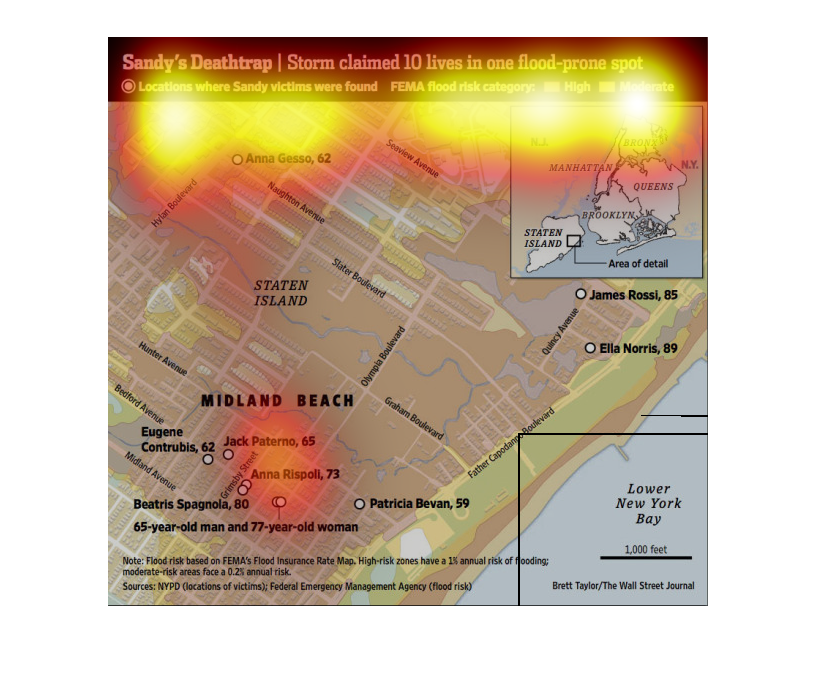
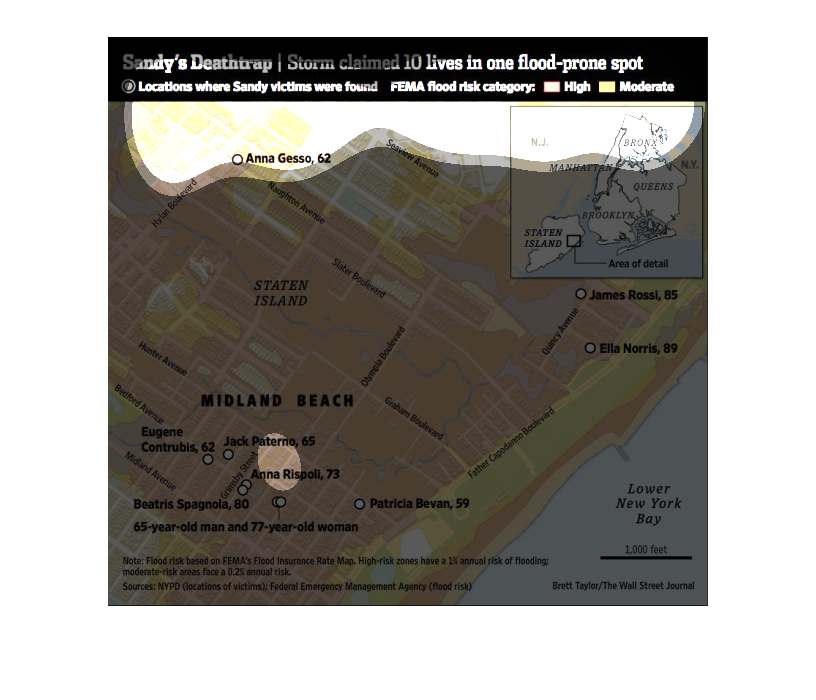
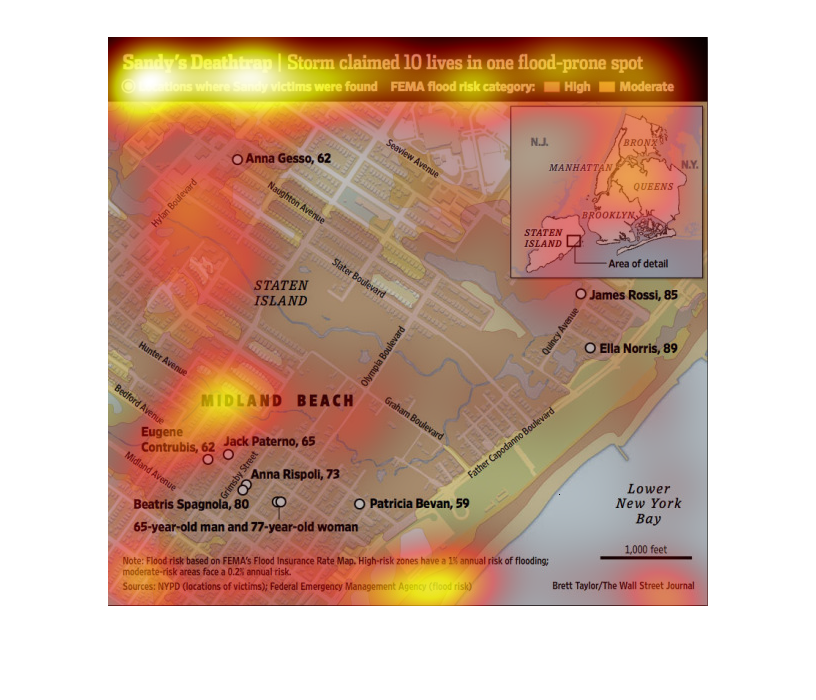
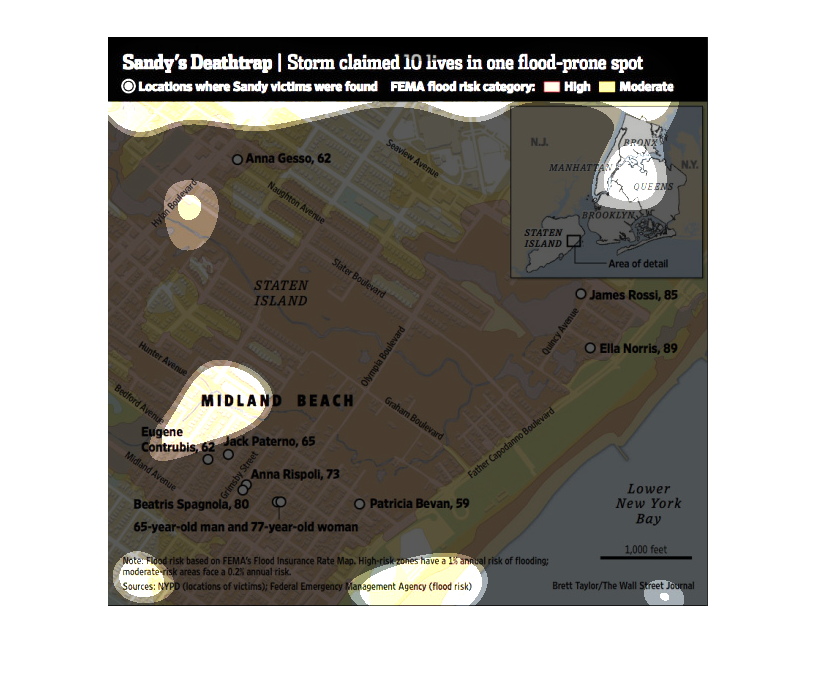
This image is entitled "Sandy's Deathtrap:  Storm claimed 10 lives in one flood-prone spot."
 It shows a close-up view of Midland Beach.  The names of the victims are in bold letters
at their respective location.  Sources were NYPD (locations of victims) and Federal Emergency
Management Agency (flood risk).  Image created by Brett Taylor for The Wall Street Journal.
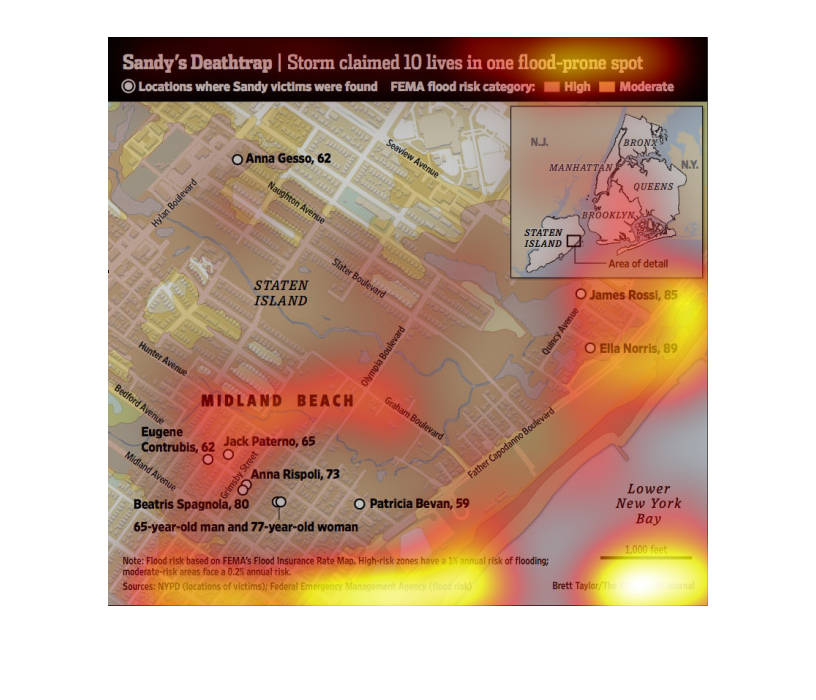
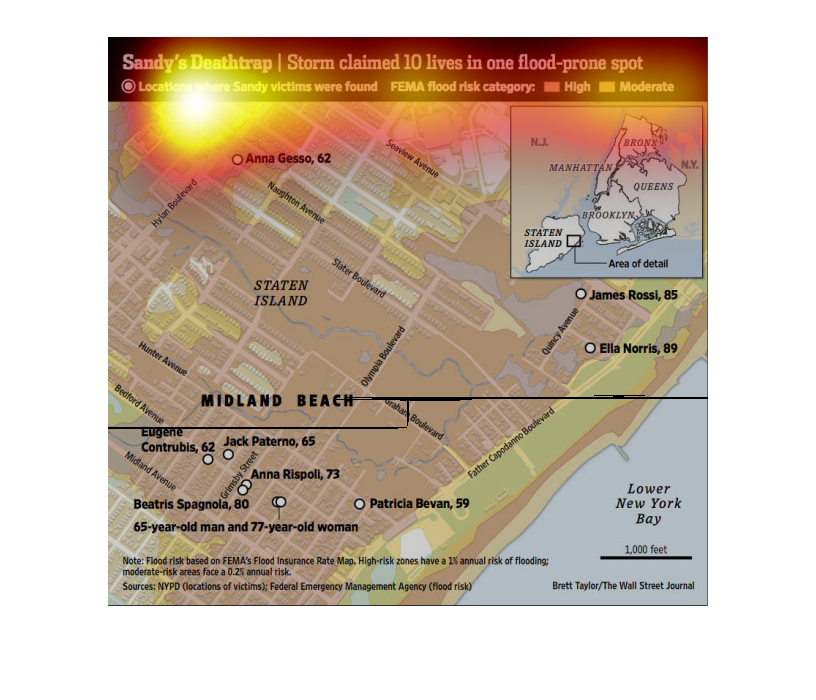
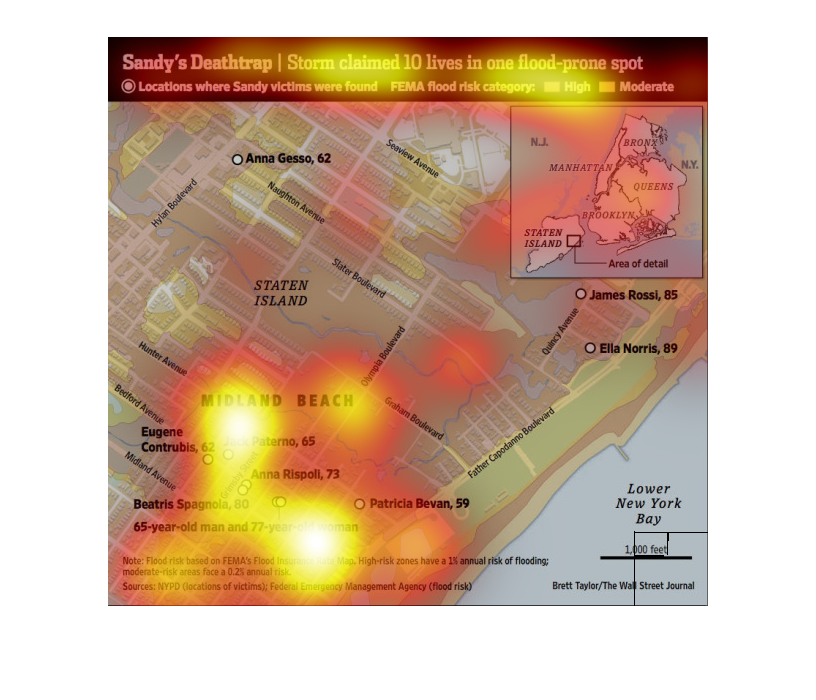
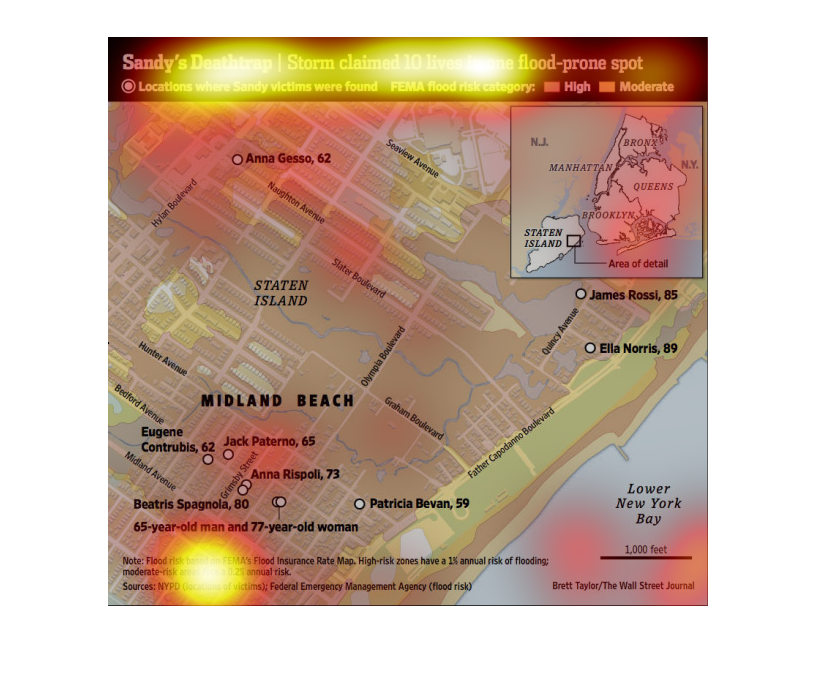
The image is a map describing where Sandy's Deathtrap Victims were found.  It appears that
10 dies and the this was a storm that caused a flood claiming said lives.  The flood seems
to have occurred in Staten Island.  On the map it indicates where each victims body was found,
their name, and their age.  There are colors on the Map indicating FEMA flood risk Category:
Salmon color for high and yellow color for moderate.
The image depicts the amount of deaths claimed by Hurricane Sandy in one flood-prone spot.
The storm claimed 10 lives after making landfall on the east coast.
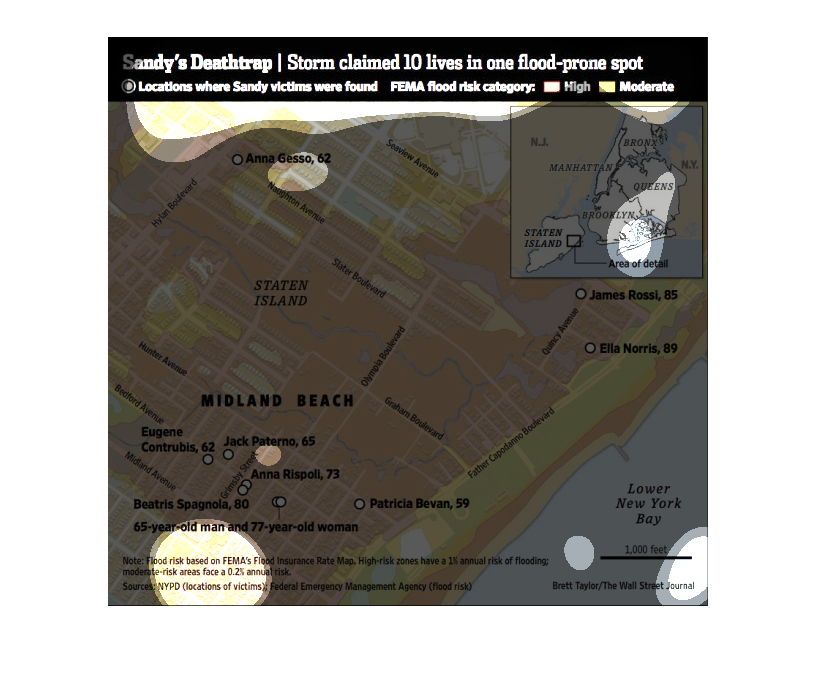
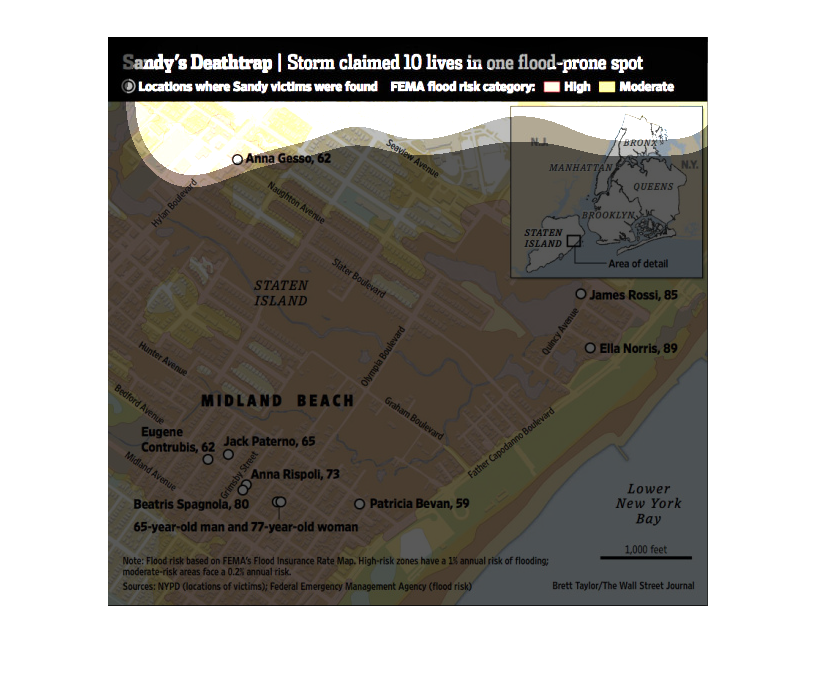
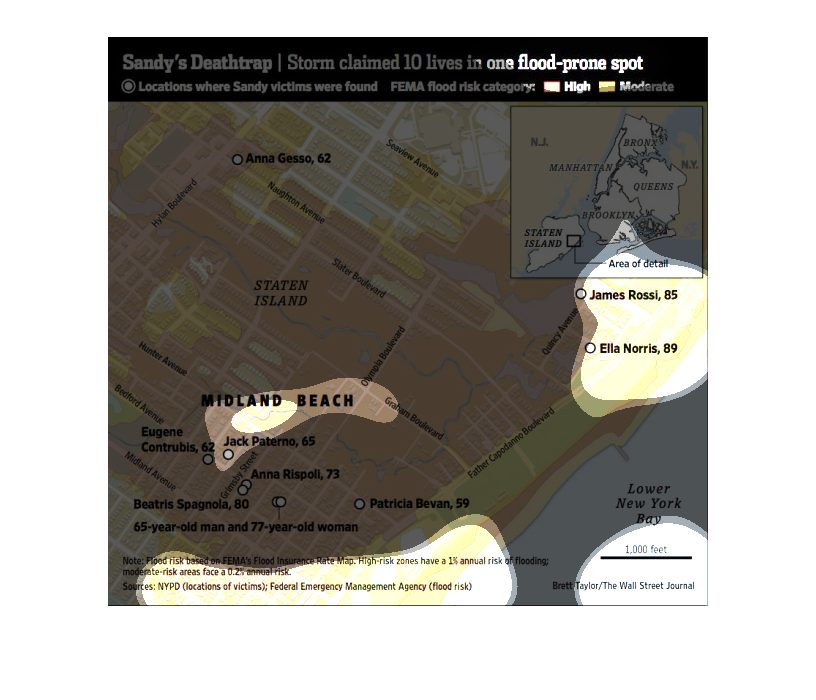
The map describes the areas of the eastern part of Staten Island, New York which were affected
by Hurricane Sandy. In particular, it maps where ten people were killed by flooding caused
by Sandy.
This image shows or depicts in New York geographical statistical format how hurricane Sandy
devastated one prone spot that took 10 lives in one flood.
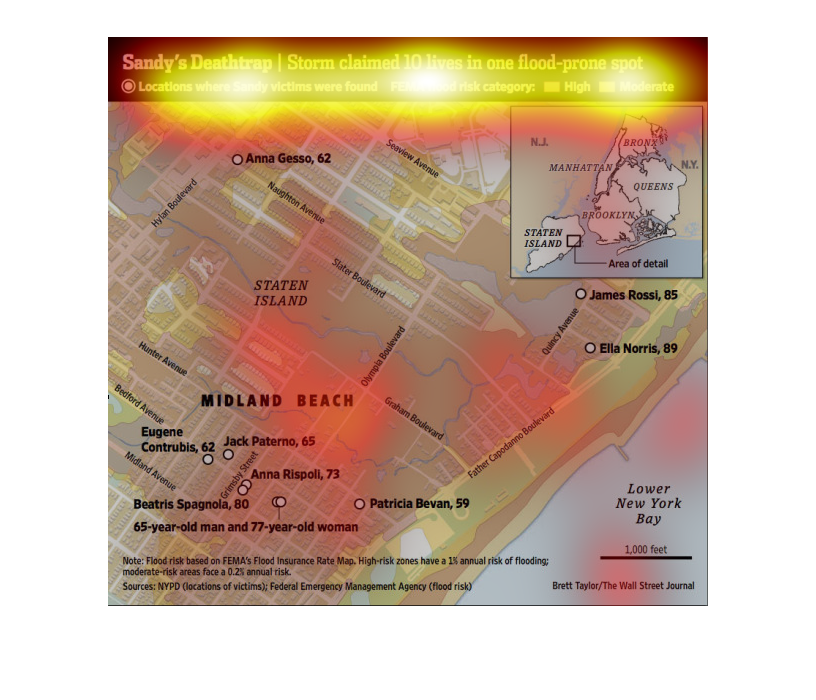
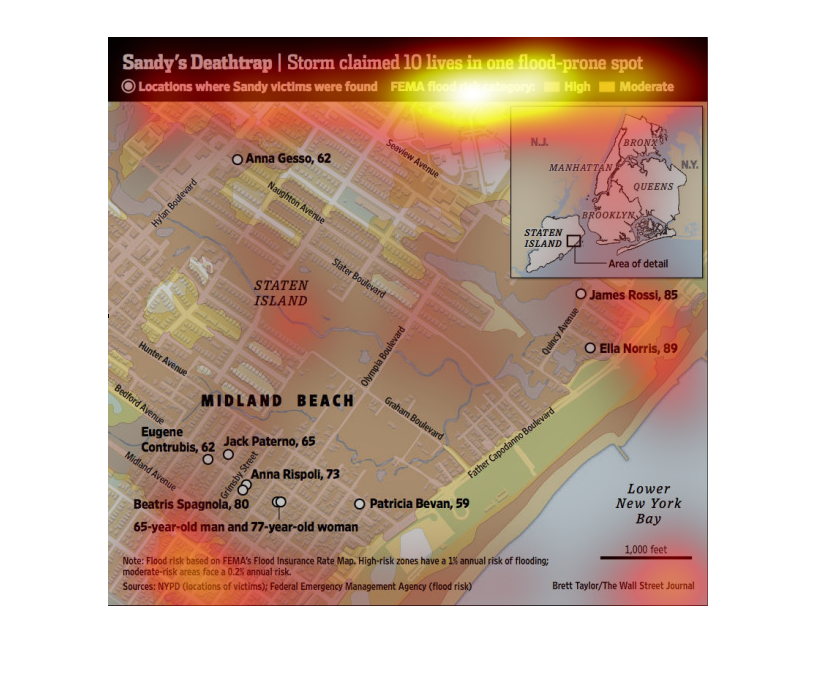
In this study conducted by the Wall Street Journal- from various sources of data- we see the
devastation of hurricane Sandy in the city of New York, and how FEMA  ranks the areas in Brooklyn
from potential risk to absolute flooding, according to the ten lives lost during that period.
This chart from the Wall Street Journal shows how the damage caused by superstorm sandy resulted
in 10 deaths and where these deaths occurred in the area
This article was about the destruction of hurricane Sandy. This flood killed 10 people. On
the bottom is a map where the flood struck and it also shows where the 10 people died.