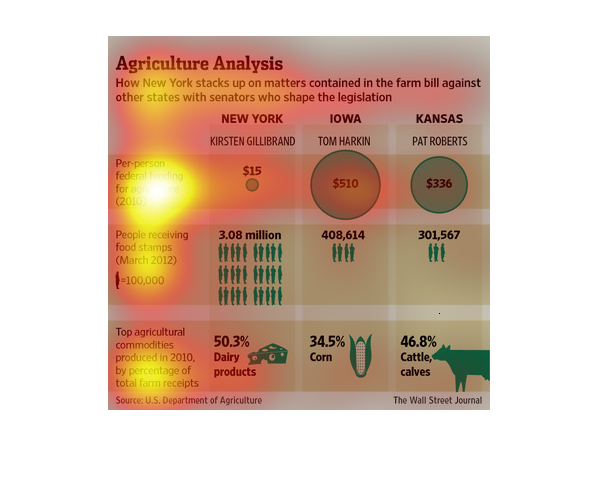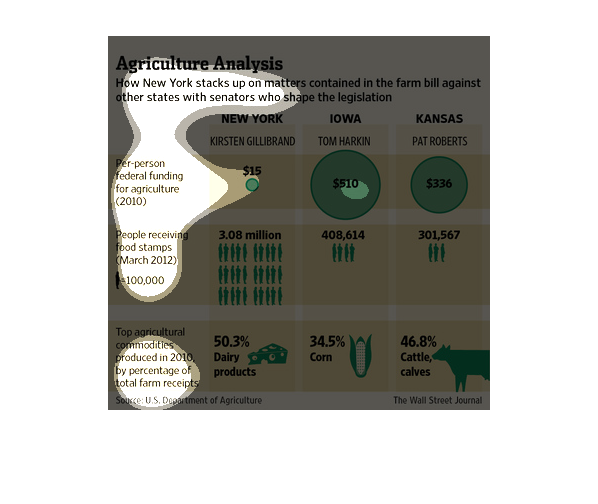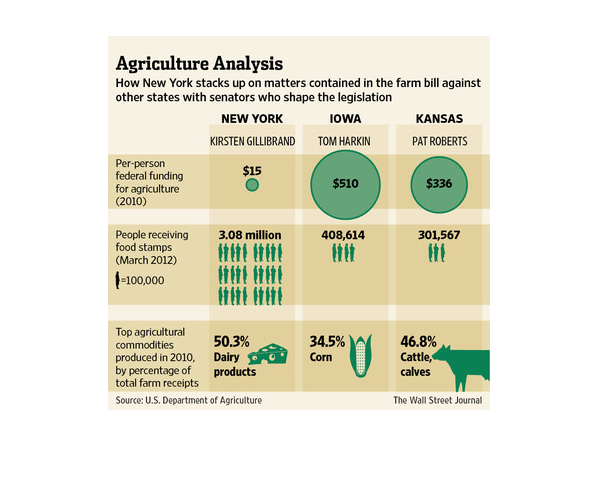
The image depicts how New York compares on matters contained in the farm bill against other
states with senators who are shaping the legislation. New York has the least per-person funding
for agriculture, with the highest number of people receiving food stamps, and producing 50.3%
of dairy products.
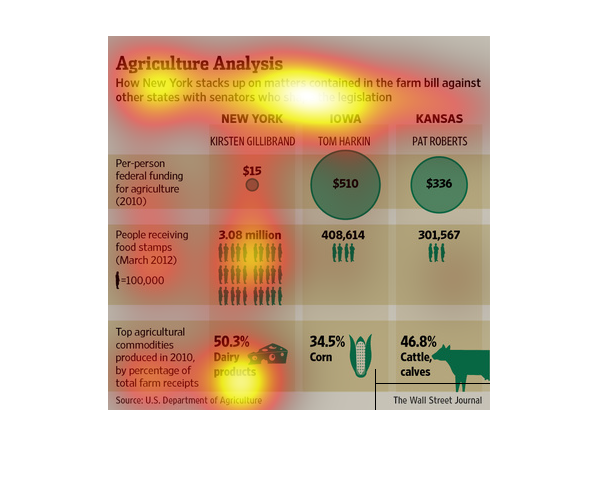
This is about how New York compares to other states in the Agriculture business. Then they
compare New York to Iowa and Kansas. They are comparing the federal funding per person, people
receiving food stamps, and the top agriculture items produced compared to the rest of the
country.
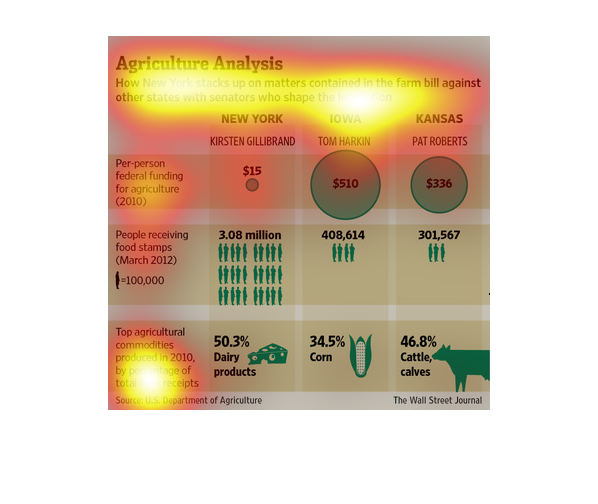
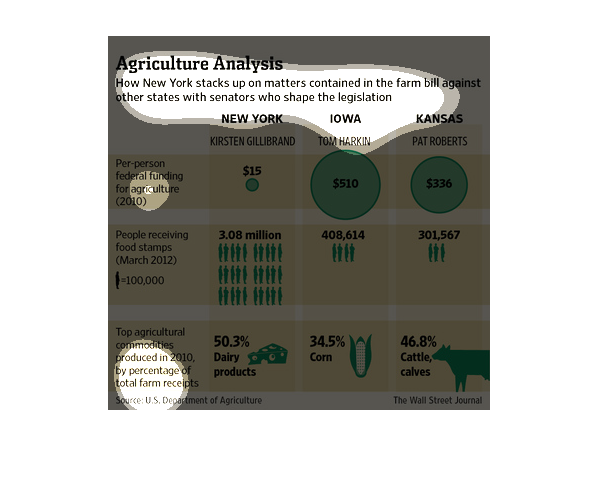
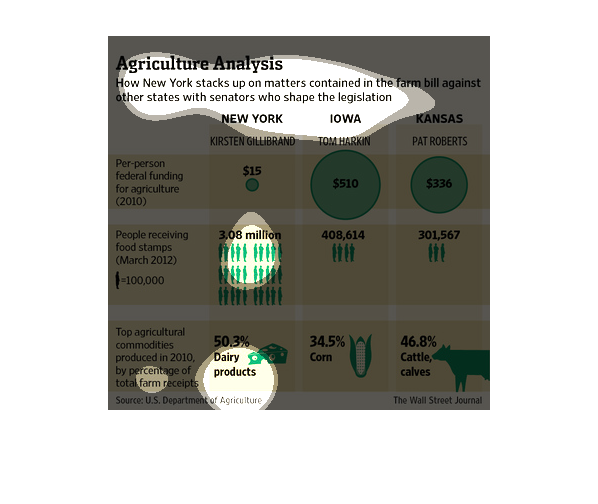
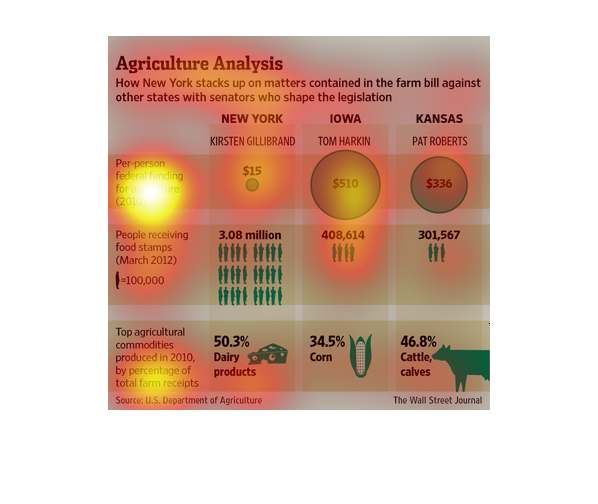
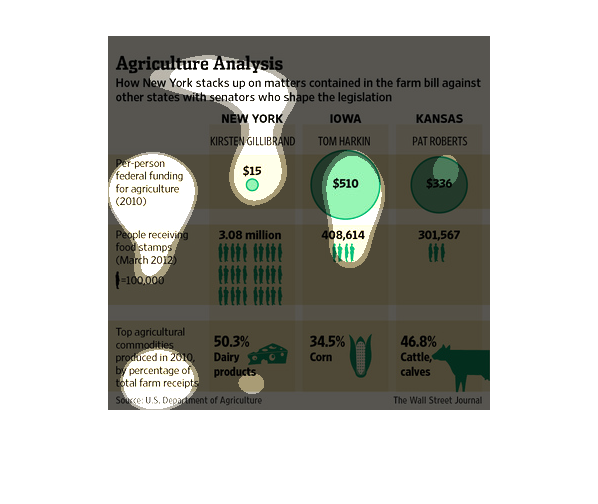
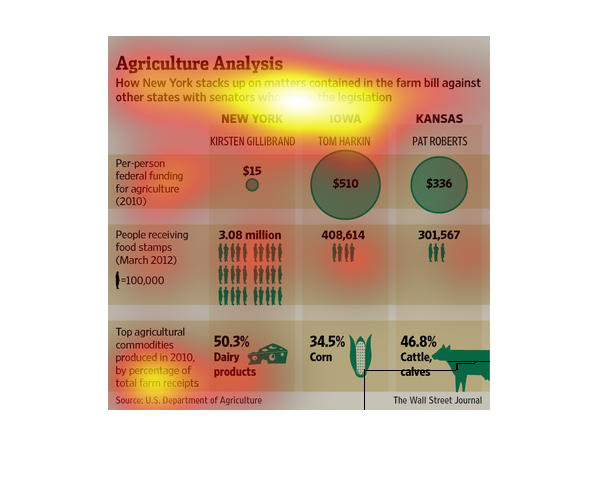
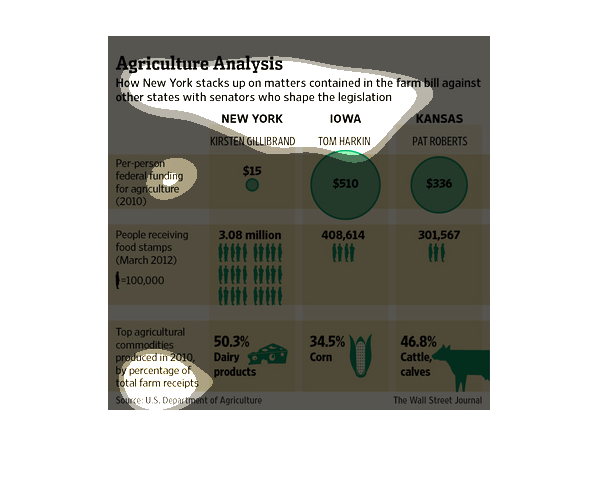
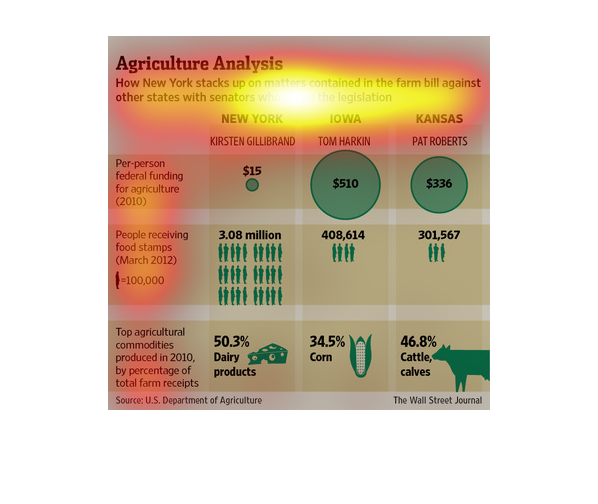
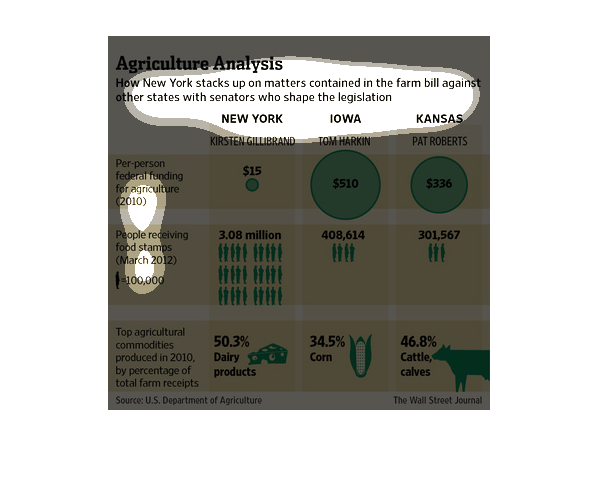
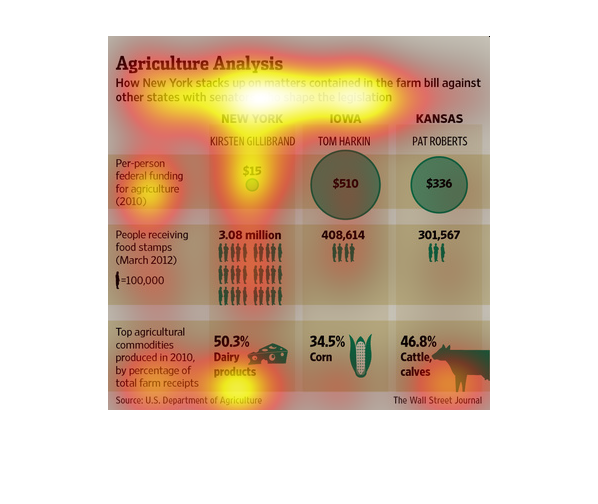
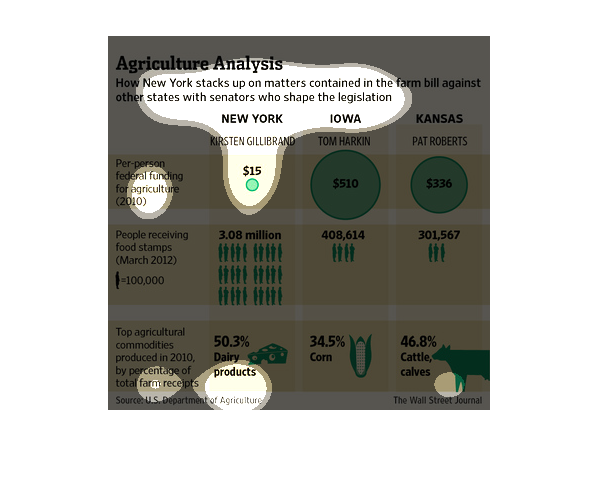
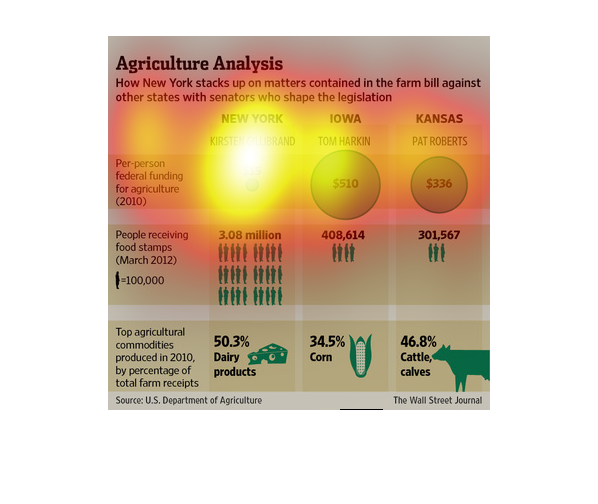
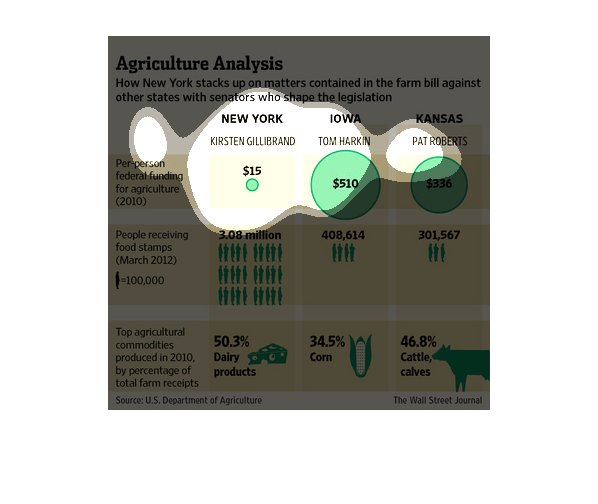
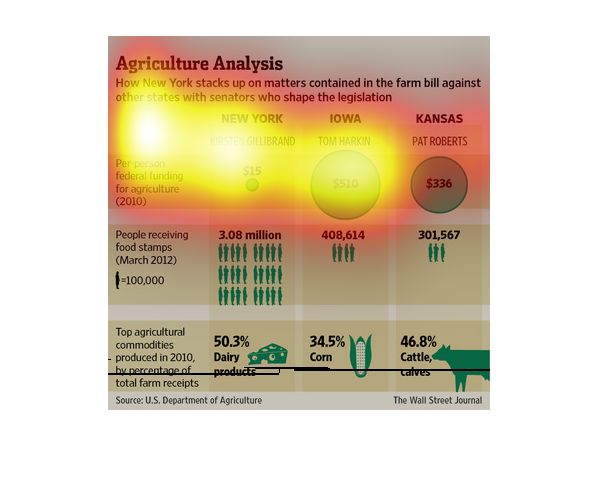
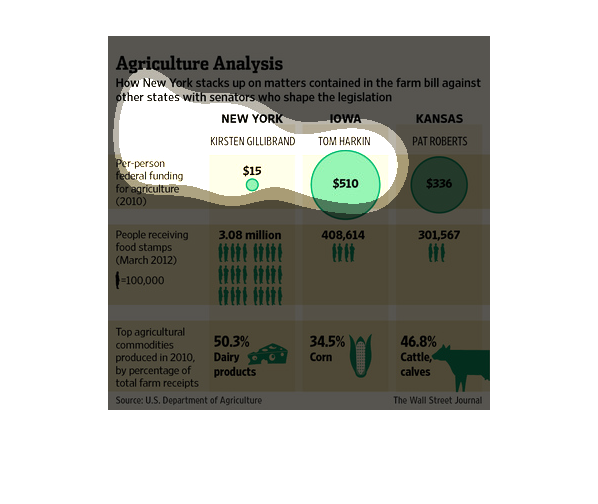
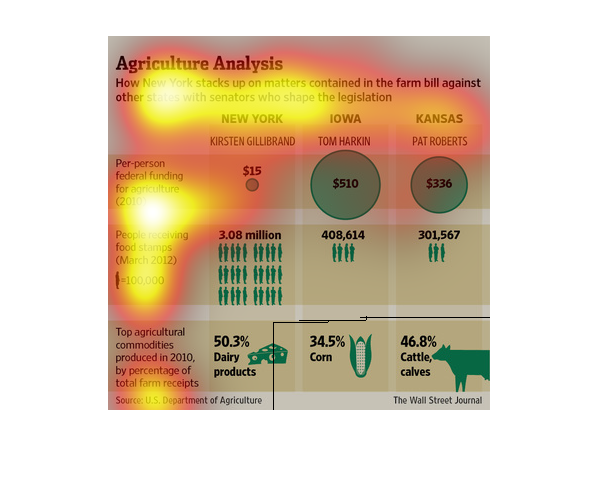
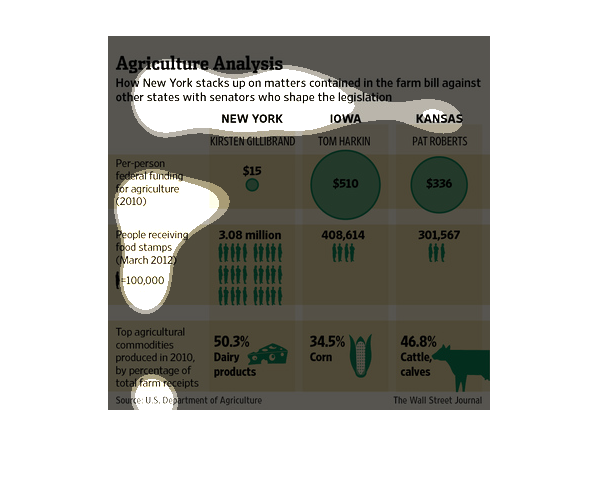
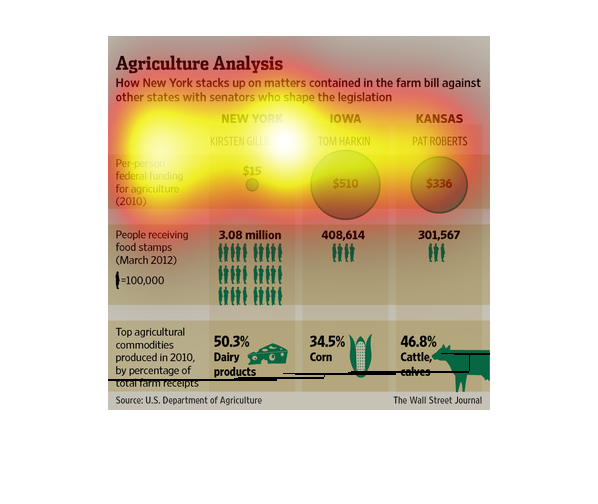
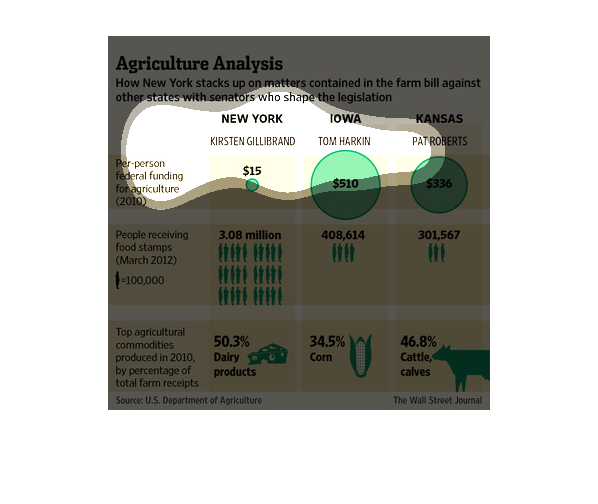
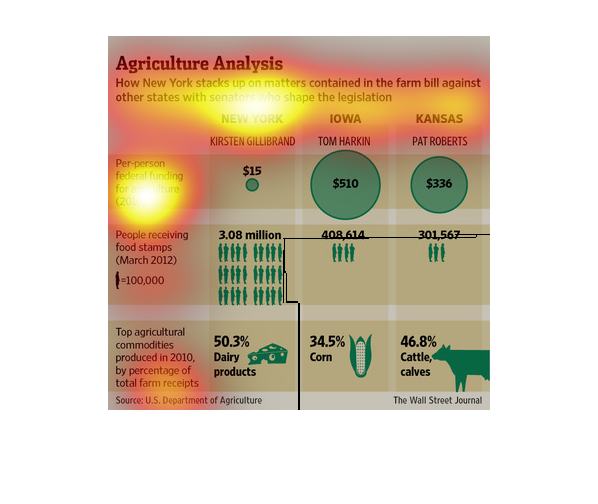
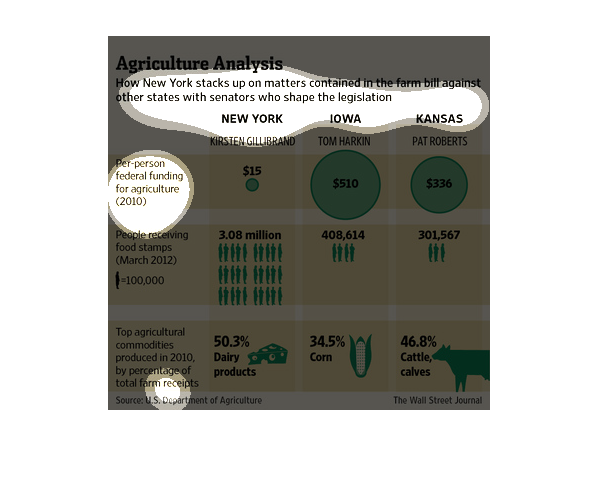
Titled "Agriculture Analysis", this is a chart that shows how New York compares on matters
 contained in the farm bill against others states with their senators affecting legislation.
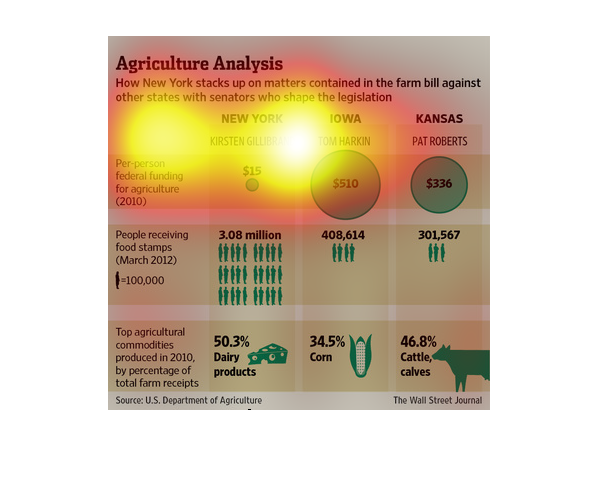
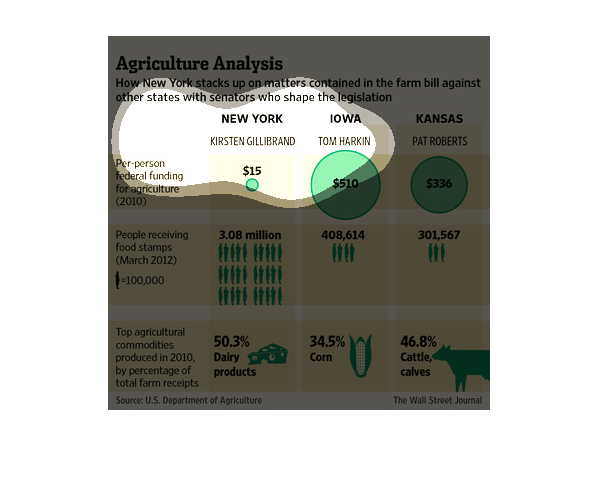
The name of this image is Agriculture Analysis. It compares New York state against other states
that had senators writing the farm bill. Per person federal funding from the farm bill was
$15 for New York, $510 for Iowa, and $336 for Kansas.  That compares to 3.08 million people
on food stamps in New York, 408,614 in Iowa, and 301,567 in Kansas.  New York's largest farm
commodity is cheese, Iowa's is corn. and Kansas' is beef.
this is a chart about NY agriculture against states with senators who shaped the legislature.
On the chart are NY, AR, and IA. NY has $15 per person agri funding, 3.08 million on food
stamps,  while IA has $510 and 408,614 on food stamps,  and AR $336 and 301,567.
This graph gives information about how New York stands against other states in the country
regarding a farm bill. It gives information about food stamps and federal funding for each.
The image depicts an agricultural analysis of how New York compares in matters contained in
the farm bill against other states with senators who craft the bill. New York is receiving
far less funding, while having more people, while also producing over 50% of dairy products.
This graph shows how New York stacks up to the matters contained in the farm bill against
other states(New York, Iowa, Kansas) with senators who shape the legislation.
This chart from the Wall Street Journal shows how the recent farm bill in congress stacked
up for New York state in relation to other farm producing states
This chart compares several aspects of agricultural laws in different states. Included are
New York, Iowa, and Kansas. Data shown is per person funding and percentage of people receiving
food stamps.
This chart from the Wall Street Journal shows how New YOrk state fares in comparison to other
states as it relates to a major farm bill passed by Congress
How New York compares to other states regarding a farm bill that is before congress.  The
graphic compares New York with Iowa and Kansas, with their respective senators. Three different
issues are compared, including per-personal federal funding for agriculture (2010)
This graph describes how much money is spent on agriculture in New York state compared to
Iowa and Kansas.  It shows per person spending on agriculture from federal money. New York
State spends only 15 dollars while the other two states spend many hundred of dollars. The
graph also shows people receiving food stamps in each state, as well as the top agriculture
commodity produced in each state.