This chart describes challenges ahead. Specifically, though the EU aid should help Spain tackles
it's banking trouble. Different categories are represented by different colors.
The image depicts how EU aid is projected to help Spain deal with it's banking problems, but
many issues still remain to be fixed. Unemployment is increasing, the deficit as percentage
of GDP is higher in Spain than the EU, and GDP growth has stopped and stopped and is now in
the negatives.
This graph illustrates the impact of Spain's economic difficulty on the European Union. The
graph illustrates the financial amounts endured by the union.
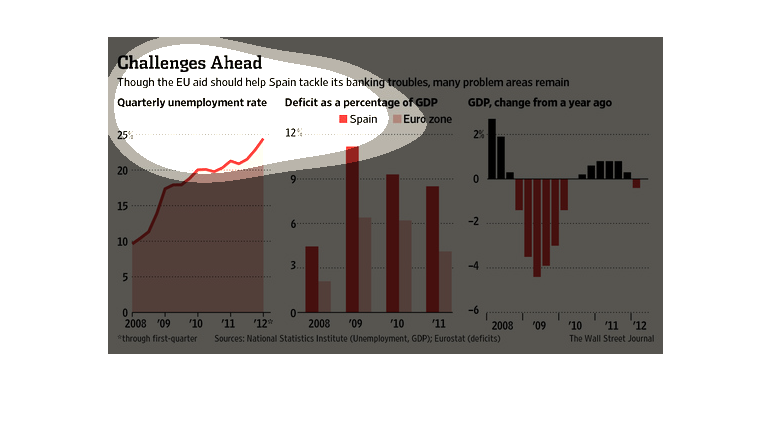
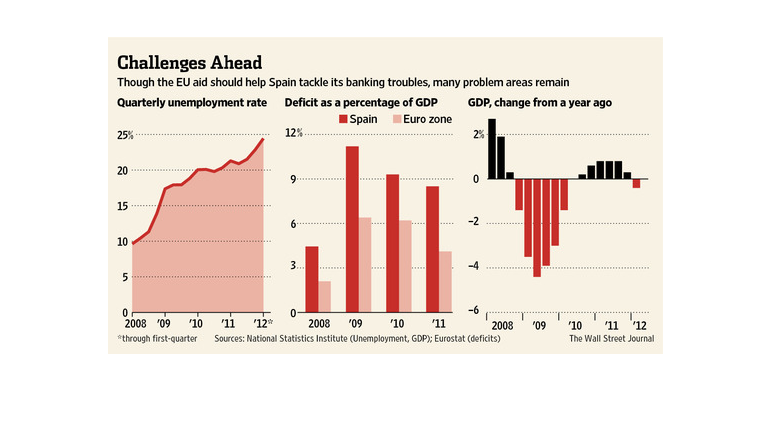
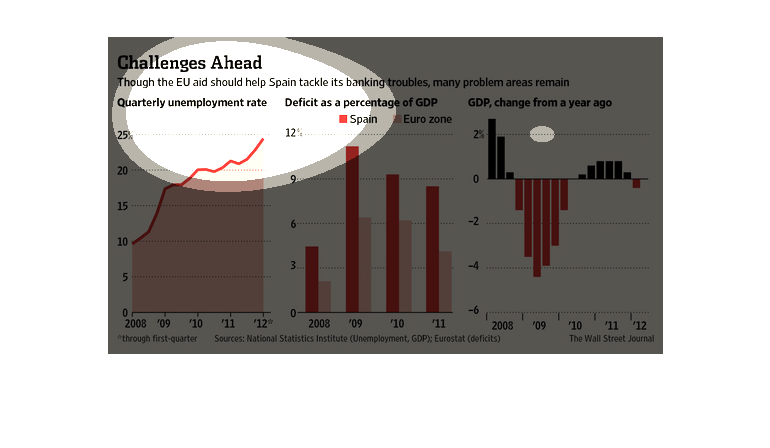
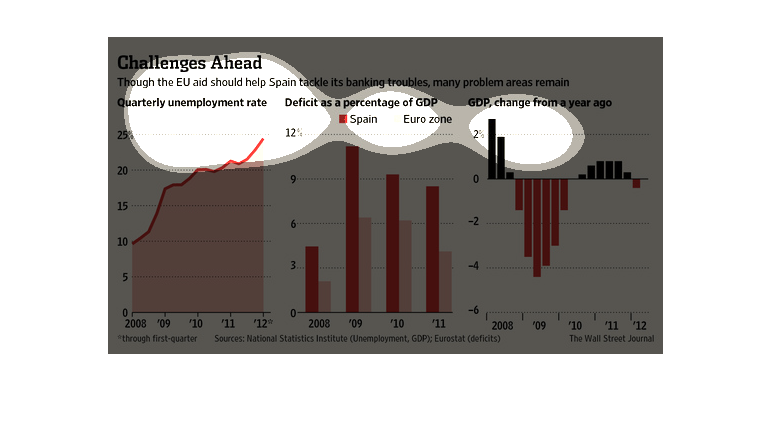
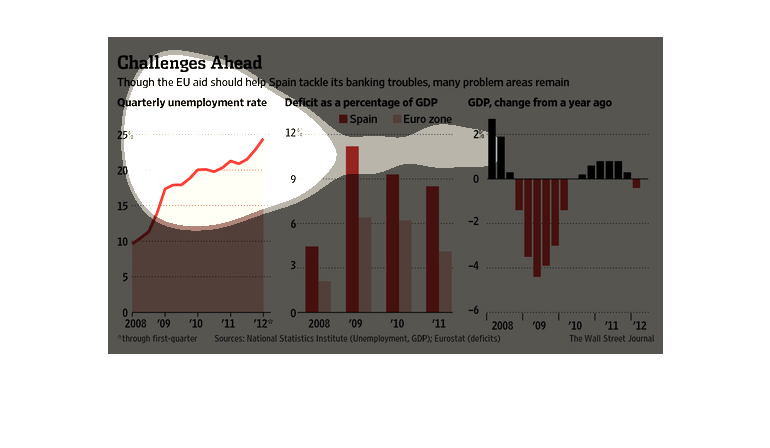
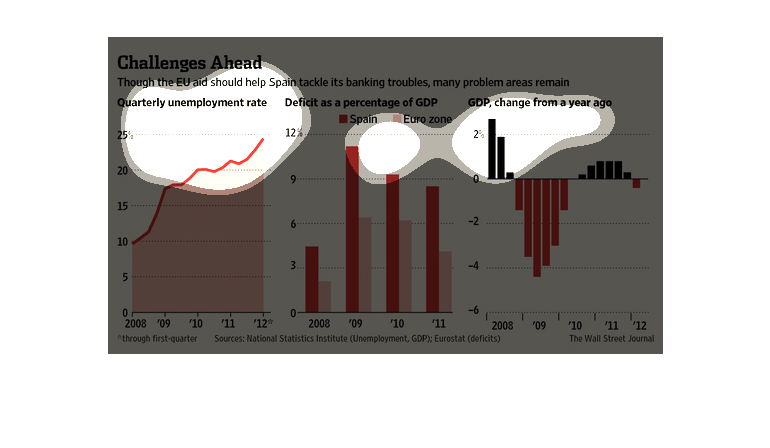
This image is entitled "Challenges Ahead."  It shows that though EU aid should help Spain
tackle its banking troubles, many problem areas remain.  The graph on the left side shows
the quarterly unemployment rate ranging from 0 - 25% from 2008-2012.  The center graph shows
the deficit as a percentage of GDP ranging from 0 - 12% from 2008 to the end of 2011.  The
graph on the right side shows  the GDP changes from a year ago with a range from -6 to 2%
from 2008 to 2012.  Data was obtained from The Wall Street Journal.
This chart from the Wall Street Journal shows how the spanish economy remains in trouble,
especially the banking sector, and how the EU needs to help
The figure presented to the left is titled Challenges Ahead.  The figure is a representation
of the statistical data for the EU helping Spain with banking trouble.
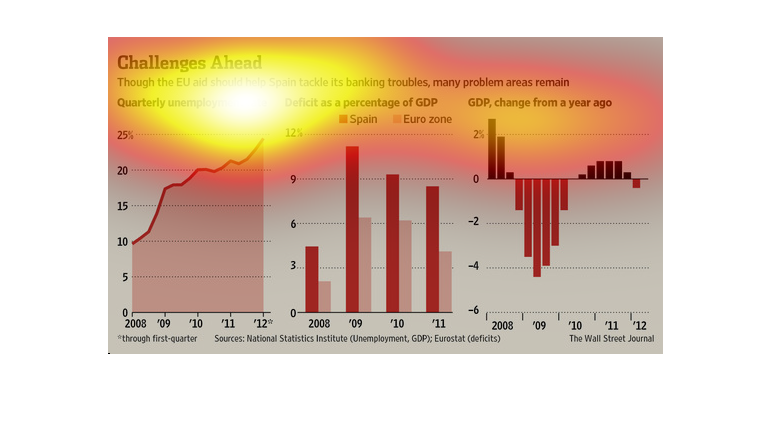
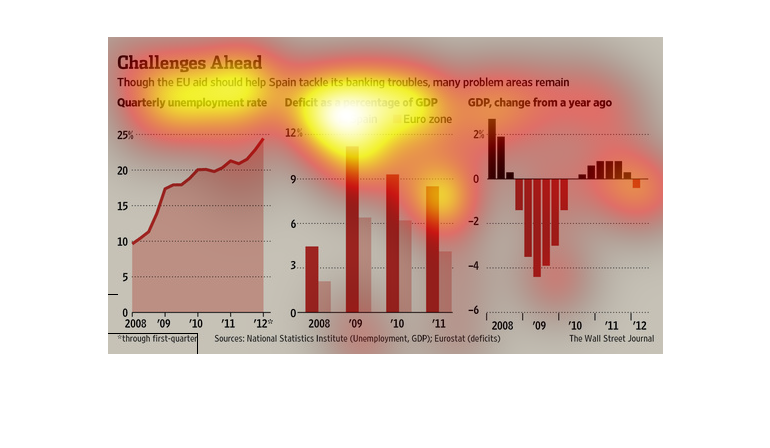
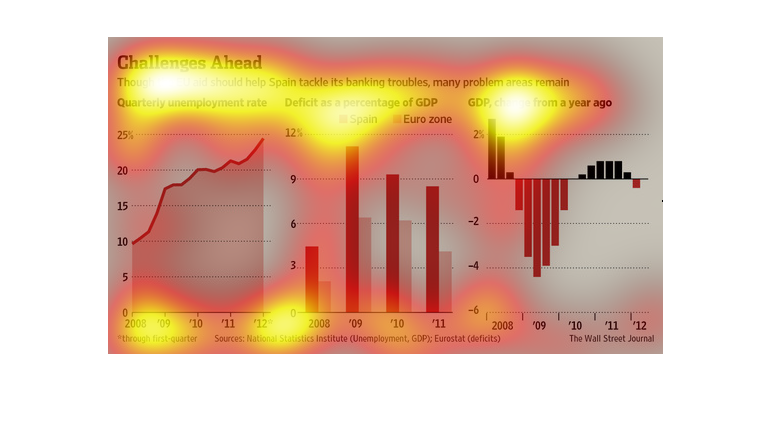
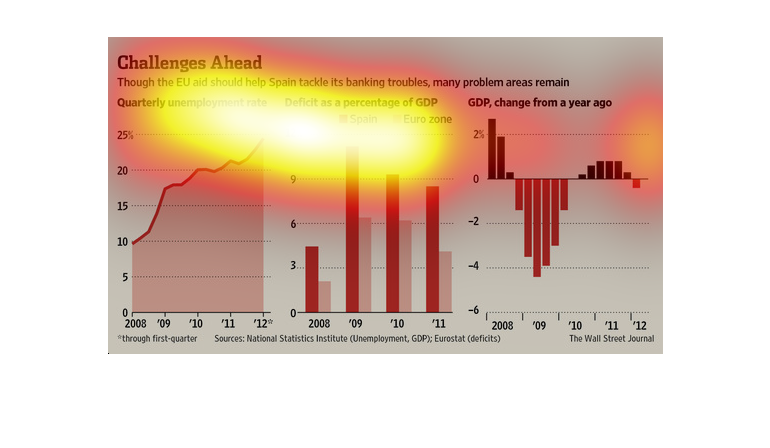
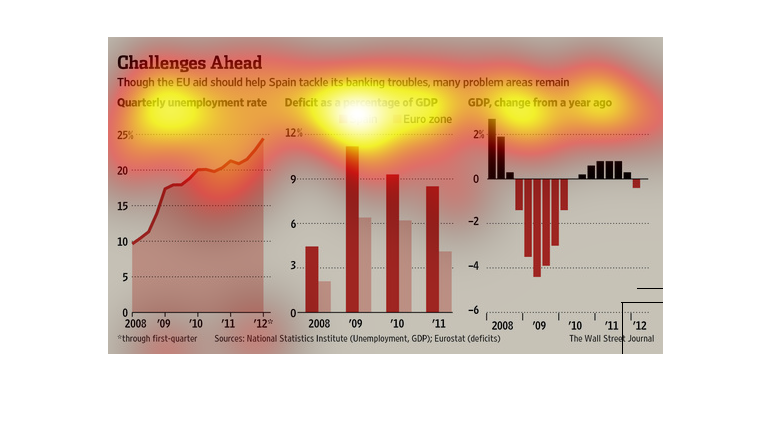
This image shows three charts depicting the economic troubles of Spain. The unemployment rate,
levels of debt, and overall change in GDP over time are shown.
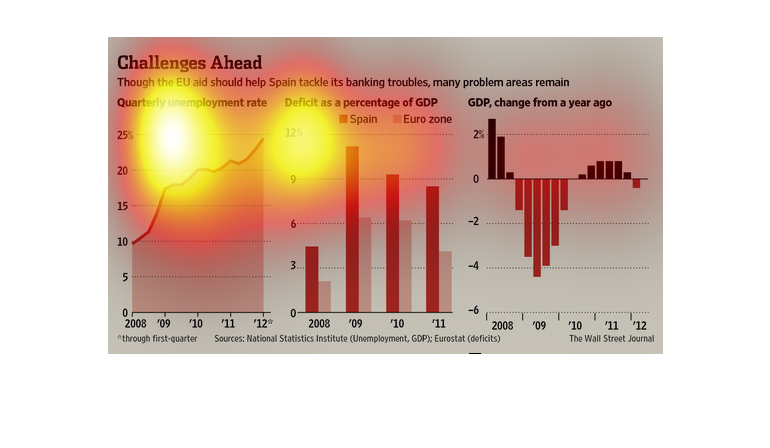
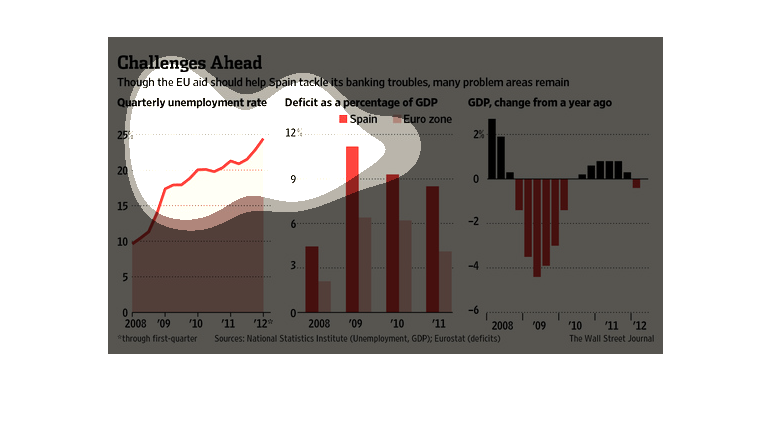
Image shows 3 charts, one showing unemployment rate from 2008-2012, the other showing deficit
as a percentage of GDP from 2008-2011, and the third showing the change in GDP from a year
prior.  Unemployment increased over the time period shown, deficit jumped in second year then
decrease modestly over remaining 2 years, and the third chart shows that change in GDP was
drastic over 2009-2010.
This shows figures for the European Union with quarterly unemployment rates on the left, deficit
as a percentage of GDP in the middle, and GDP change from a year ago on the right.
This chart from the Wall Street Journal shows how EU aid to Spain to help the country with
its sovereign and bank debt will not be enough to turn the economy around
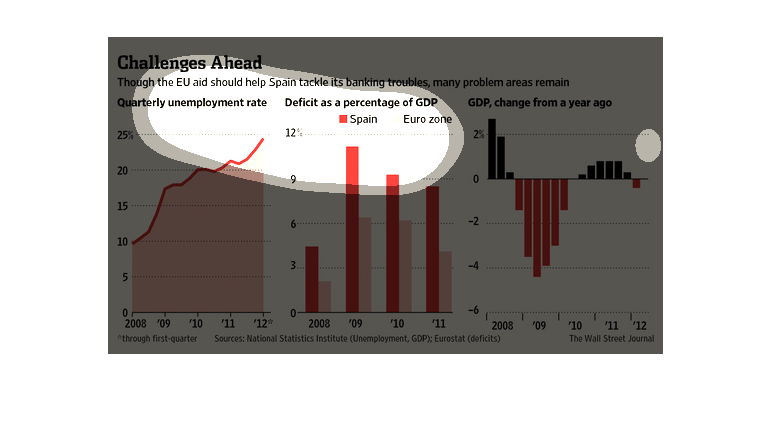
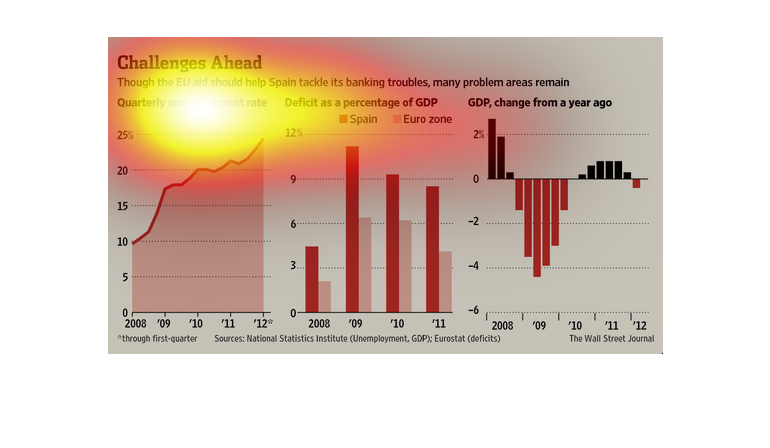
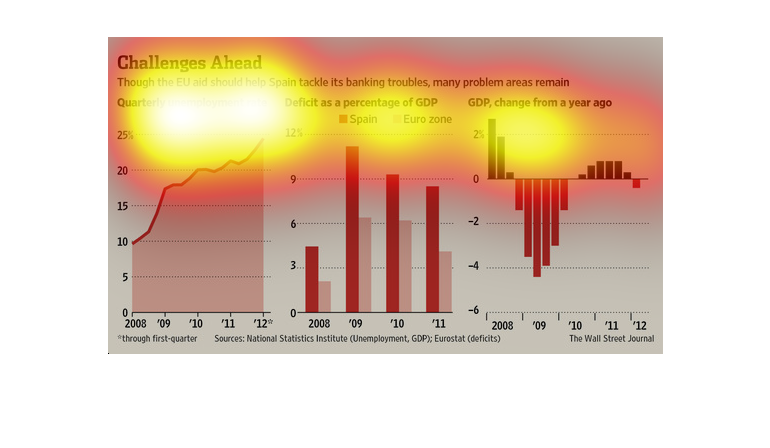
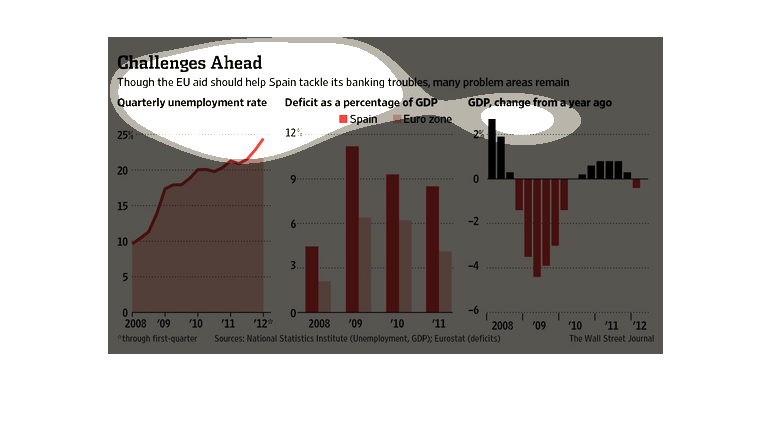
This image about Spain's debt crisis. While the EU banking industry will help, it still is
in trouble.  Three graphs support this. For instance, a bar chart shows how Spain's unemployement
rate has risen while its deficit as a percentage of its GDP is still historically high.
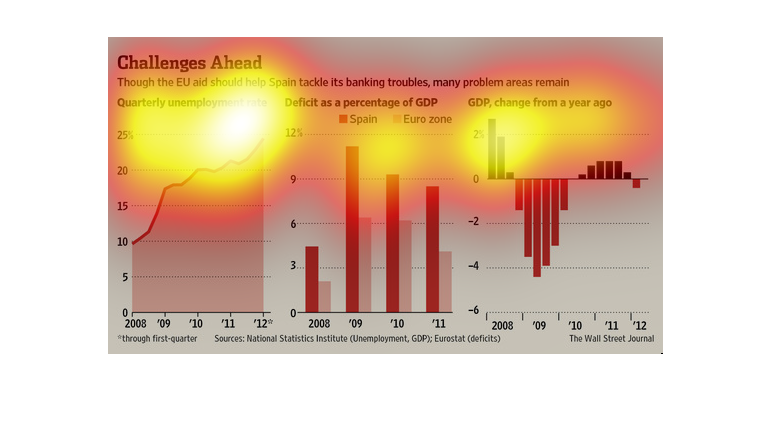
This is a series of line and bar graphs designed to explain some of the economic troubles
Spain has gone through in recent years, focused most closely on the country's banking industry.
It shows a rise in unemployment, high deficits, and poor GDP performance.
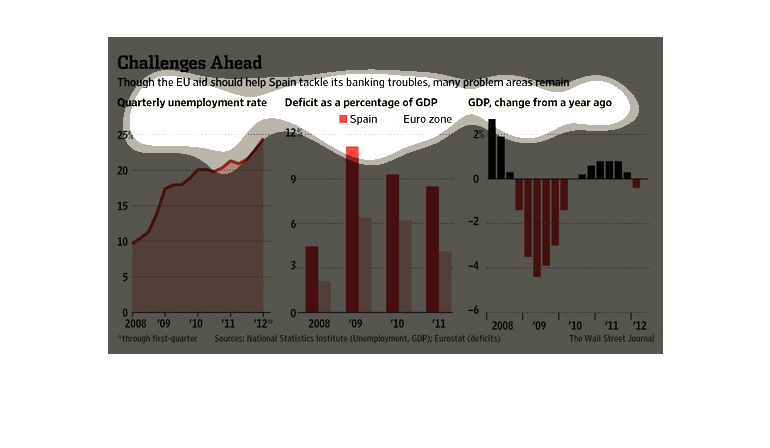
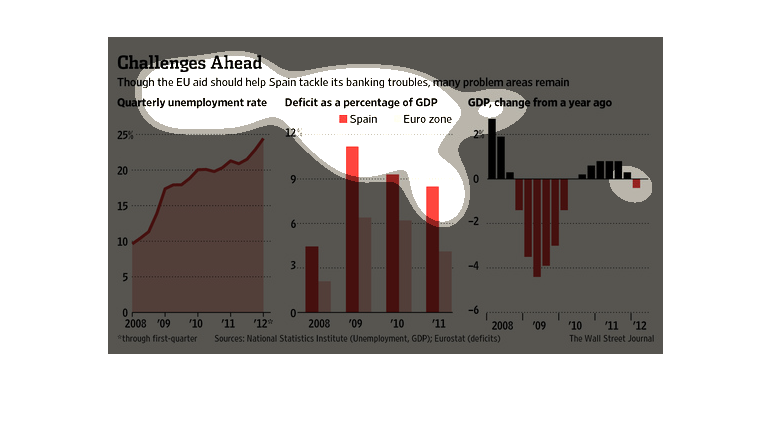
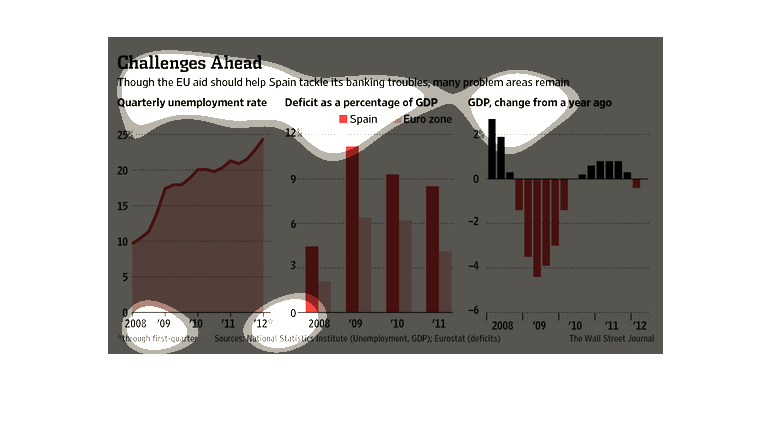
The graph shows Spain's quarterly unemployment rate, deficit, and GDP from 2008-1012. During
this four year period, Spain's unemployment rate has risen from 10% to 25%. The country's
deficit has been greater than the rest of the Euro Zone. Since 2011 the country's GDP has
been recovering from a stagnation period between 2008 and 2011.