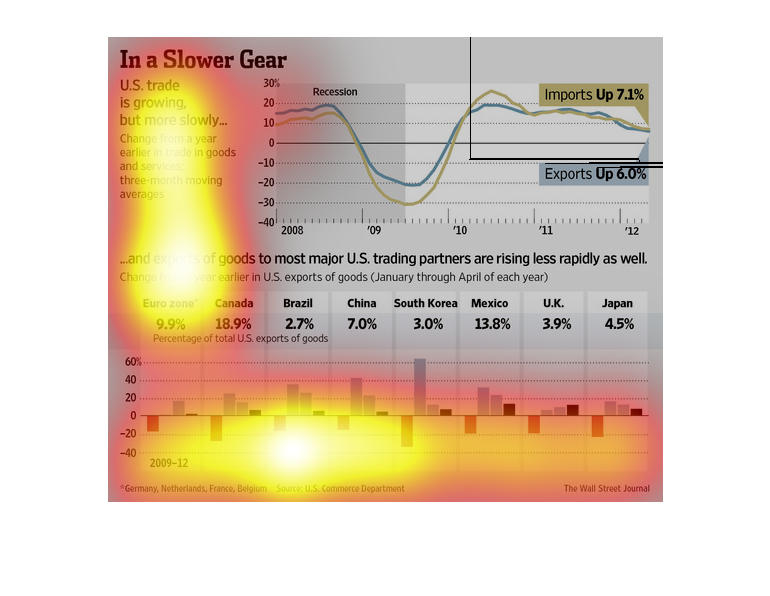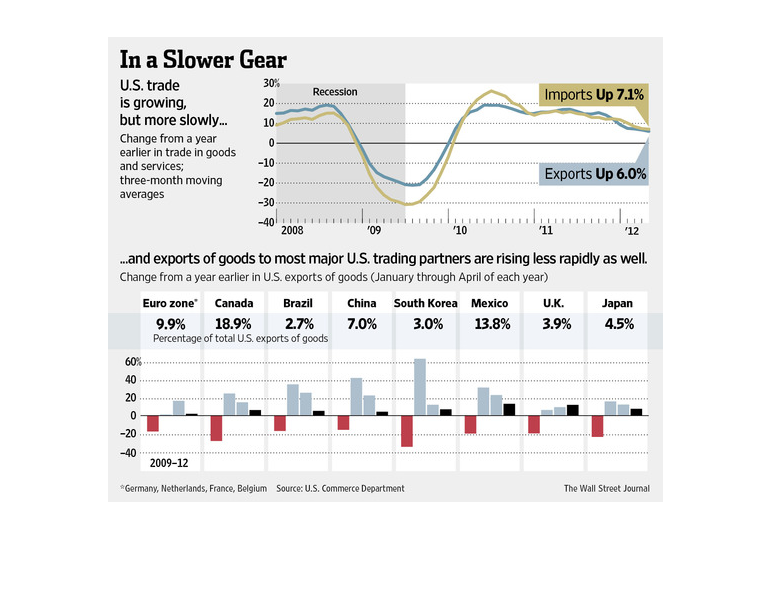
In a slower gear, U.S. trade is growing more slowly.  Other areas are around these percentages:
Euro, 9.9, Canada 1809, Brazil 2.9,  China 7.0, South Korea 3.0, Mexico 13.8, UK, 3.9 and
Japan 4.5.  Both imports and exports seem to be up.  Honestly these bubble exposures are really
annoying and really do not lend any compliment to the information displayed!
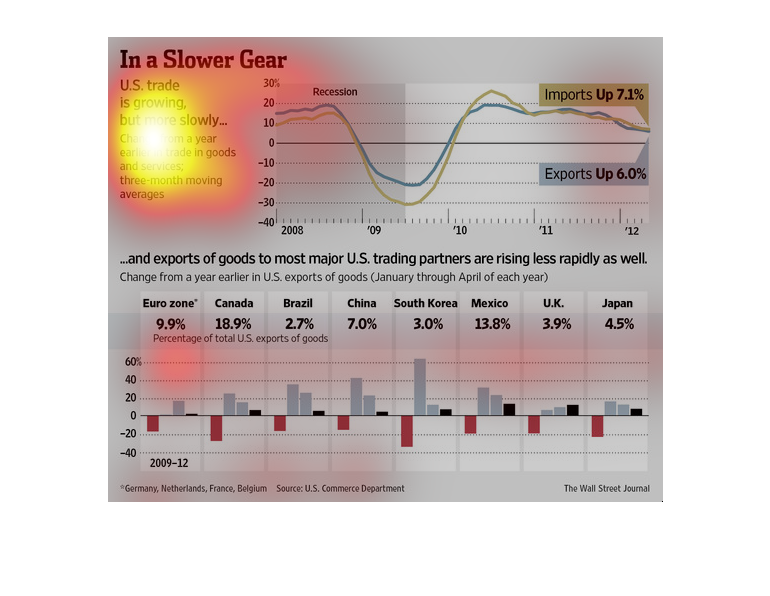
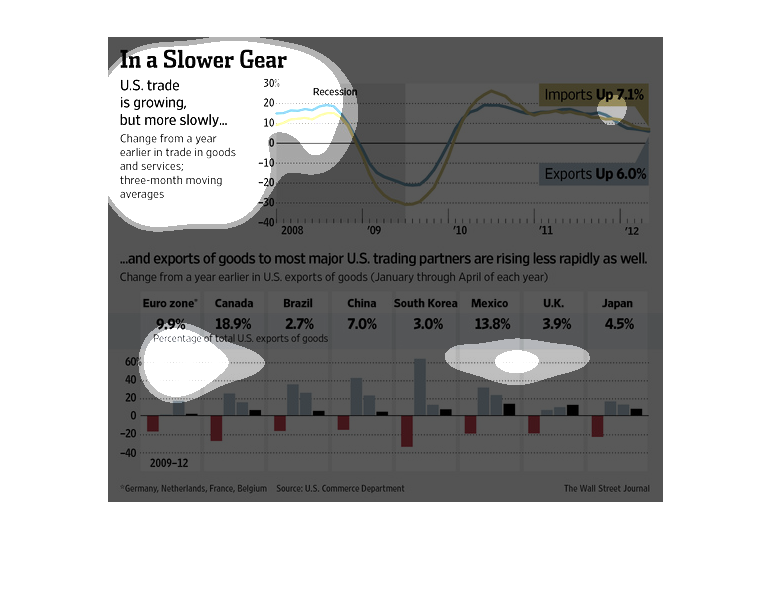
in a slower gear | United States trade is growing, but more slowly, change from a year earlier
in trade in goods and in services, three month moving averages. A graph shows a plummet from
2008-2009, stead growth peaking in 2010, tapering and slowly falling to 2012.
US trade is continuing to grow, but at a slower place.  One graph shows how both US imports
and exports are up.  Another graph show how US exports to major trading partners (Canada,
Brazil...) are up as well, but rising less rapidly than they once did.

This chart is titled In a Slower gear. It shows the US trade is growing but more slowly. Imports
are 7.1%, and Exports are up 6.0 percent. This was a very interesting chart.
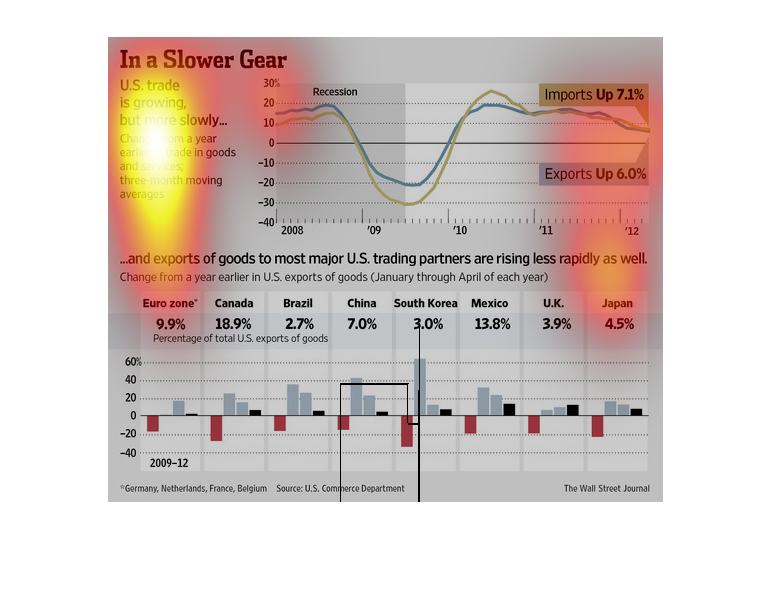
This chart illustrates how US trade is growing more slowly based on change from a year earlier
in trade and services as well as change in exports of goods.
This chart from the Wall Street Journal shows how the US trade deficit is still growing but
albeit slower because of slowly increasing exports and decreasing imports
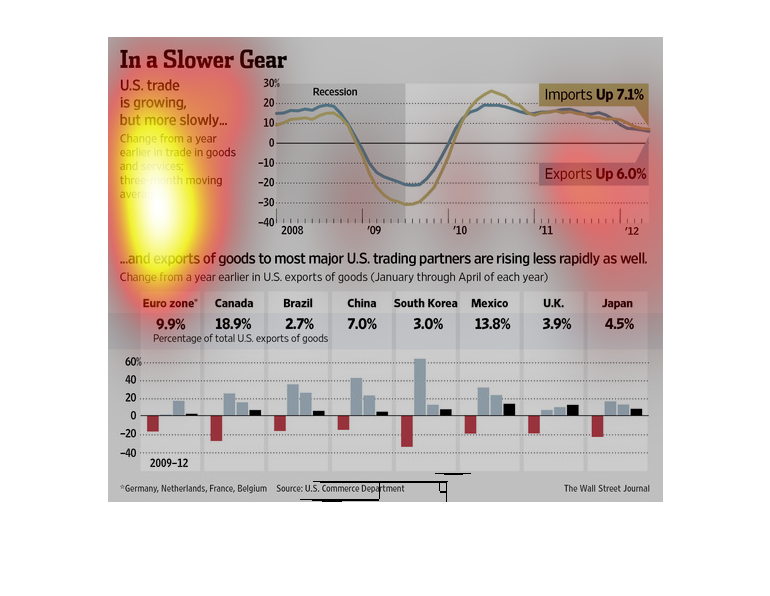
This chart describes US trading is growing, but slowly. From 2008 to 2011 Imports was up 7.1%,
and Exports 6.0%. The chart also shows our pre-post, and 2012 percentages for our top trading
partners growing slowly.
The image depicts US trade growing, but growing at a slower pace. Imports are up 7.1% with
exports up 6.0%. The data cites most exports to most major trading partners as rising less
rapidly as well.
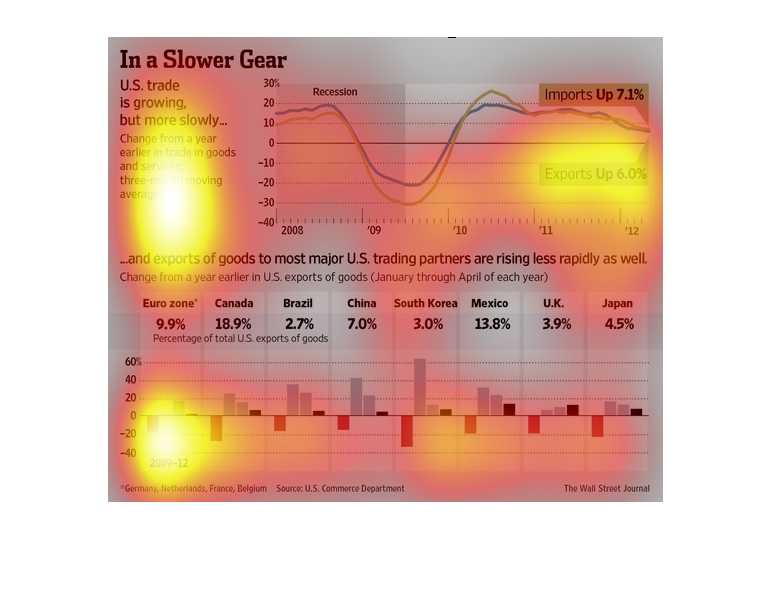
This image shows or depicts in various statistical format using line, percentage and bar graphs
to show data concerning how U.S. trade is growing but more slowly than years before.
Based on the charts, US trade is growing, but more slowly than before. The charts show the
moving averages from the past three months. Exports of goods to most major U.S. trading partners
are rising more slowly too.