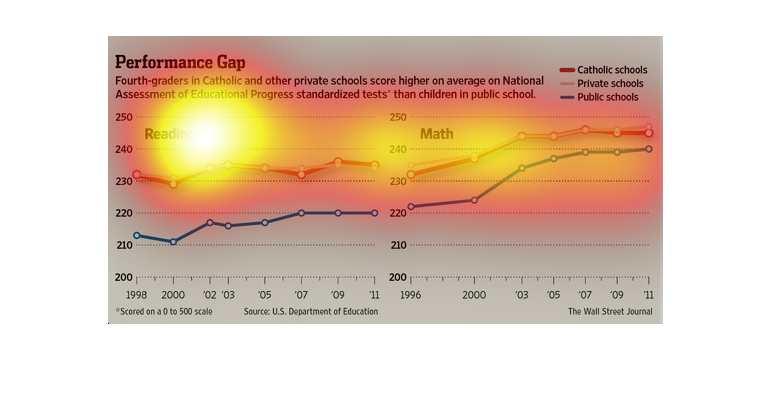
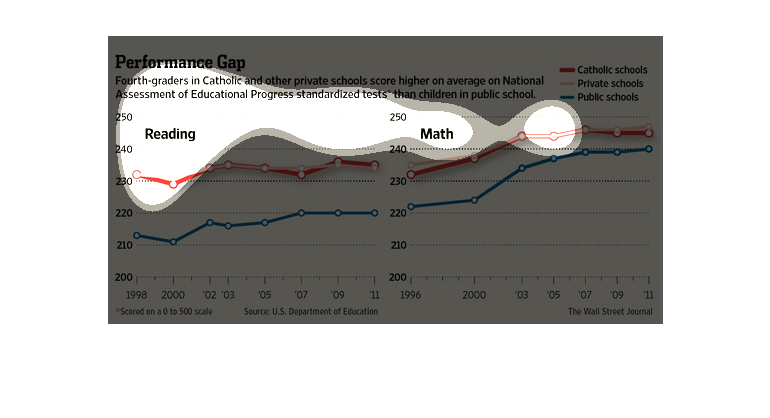
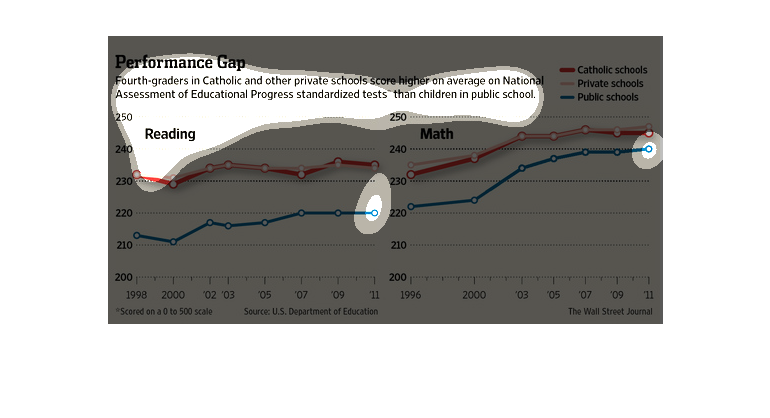
This is a line graph showing a comparison in the performance gap among students in Catholic,
other private, and public schools. The comparison is done by reference to NAEP scores. The
performance gap is higher across the board in Catholic schools than it is in other types.
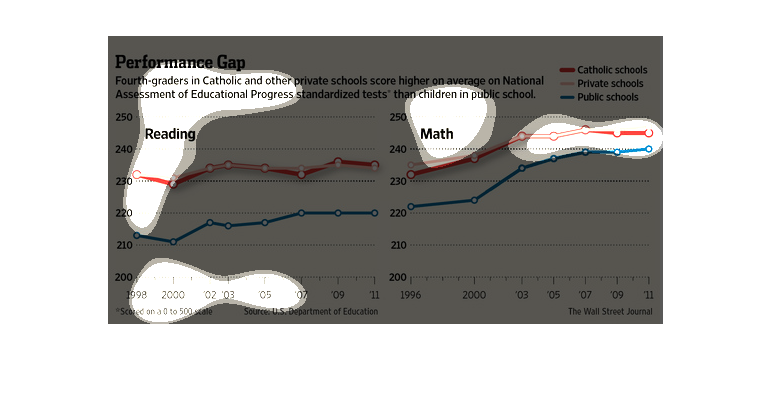
This is a graph of fourth graders from Public , Private and Catholic schools. The graph shows
the gap that exist on standardized test in math and reading from 1998 to 2011 The achievement
for Public schools.is lower than Private and Catholic schools. The results for Private and
Catholic schools are about the same.
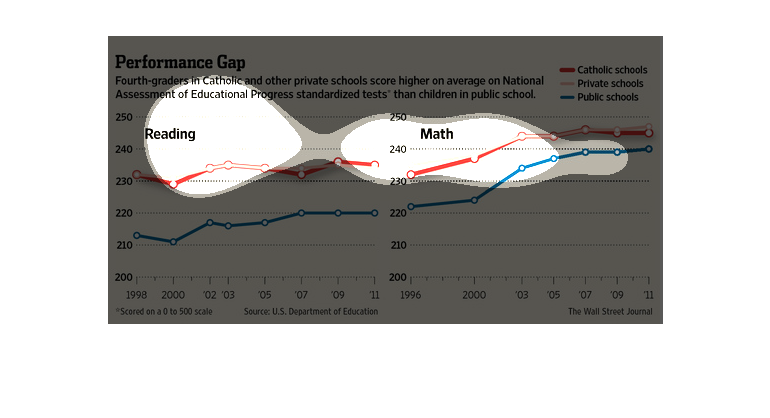
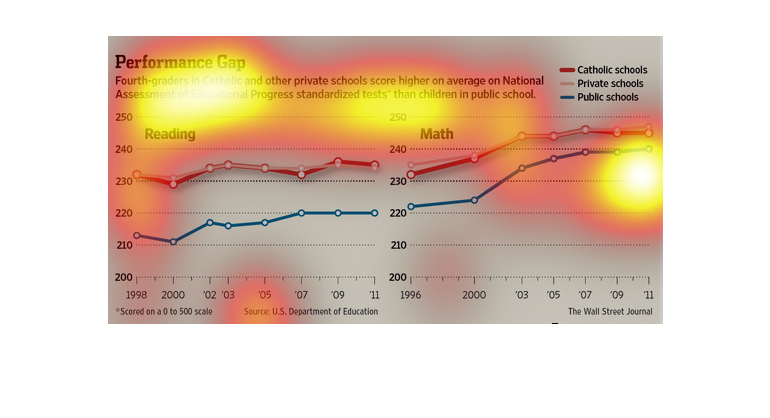
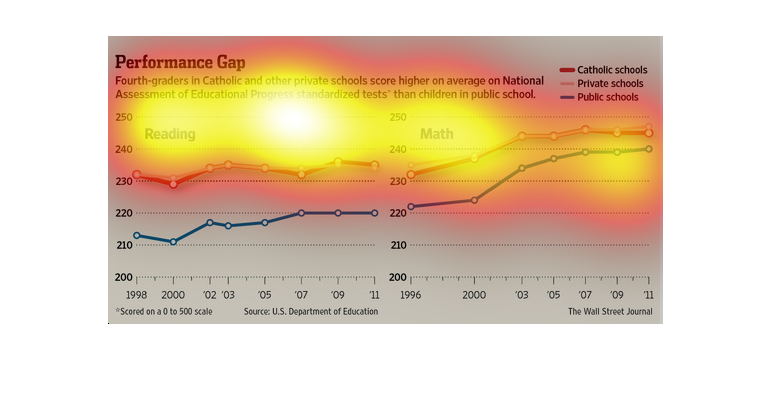
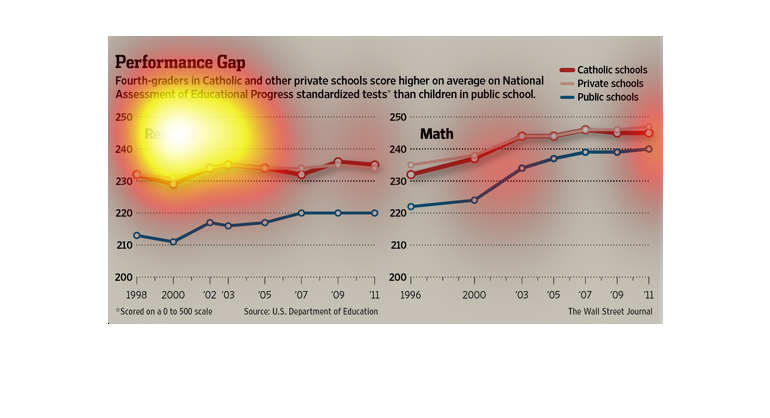
This chart shows that children in catholic schools score much higher in math and reading standardized
tests than children in public schools. The two graphs show this information.
The image depicts how fourth graders in Catholic schools and other private schools are outperforming
public school kids on national standardized tests. The gap appears somewhat small as opposed
to noticeably large.
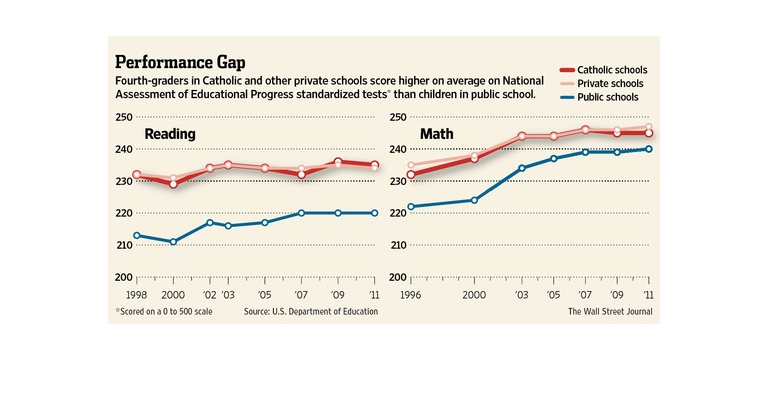
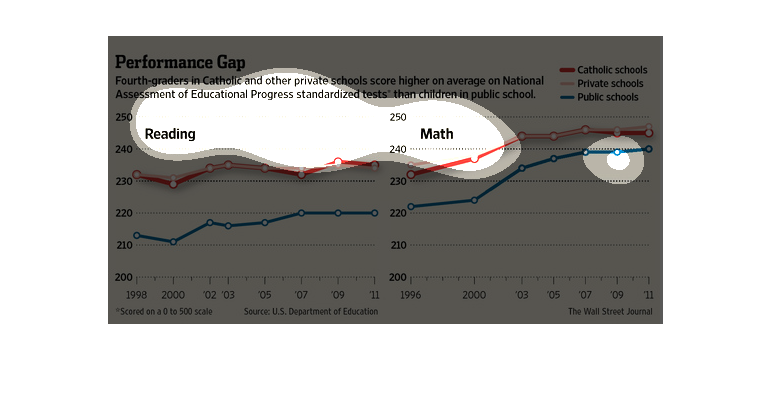
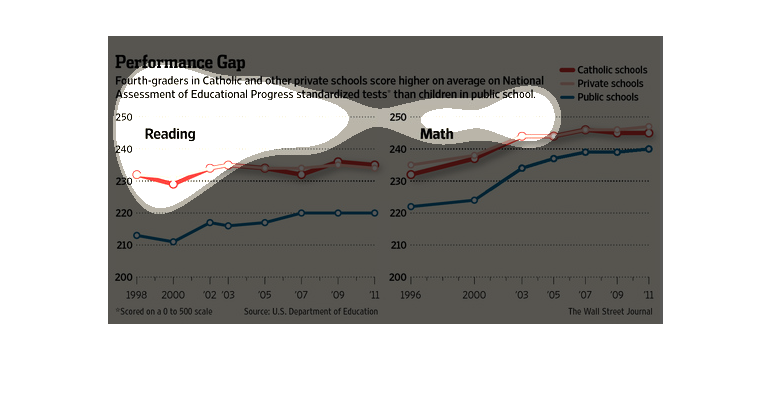
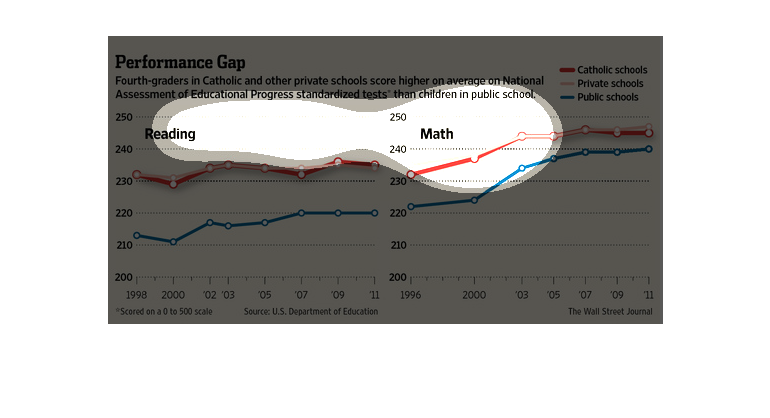
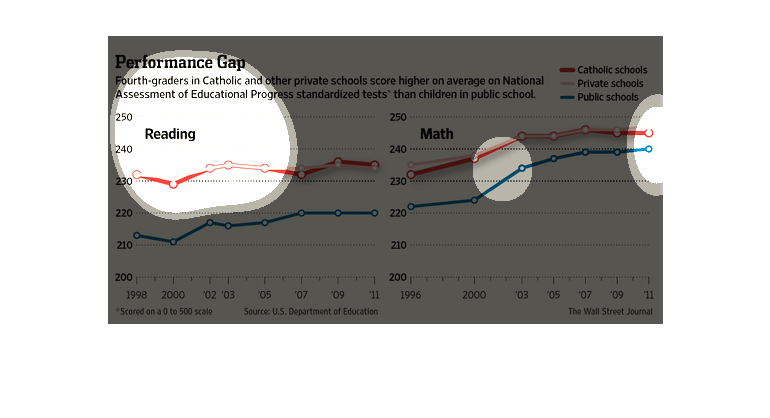
The figure presented is titled Performance Gap.  The figure is a representation of the statistical
data for Fourth graders in private schools scoring higher than public.
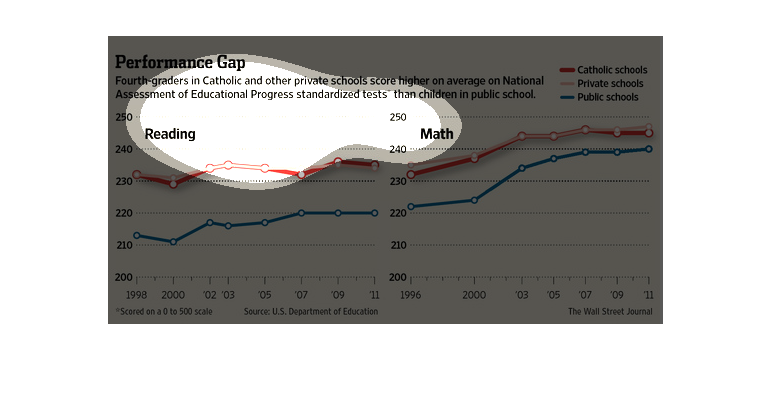
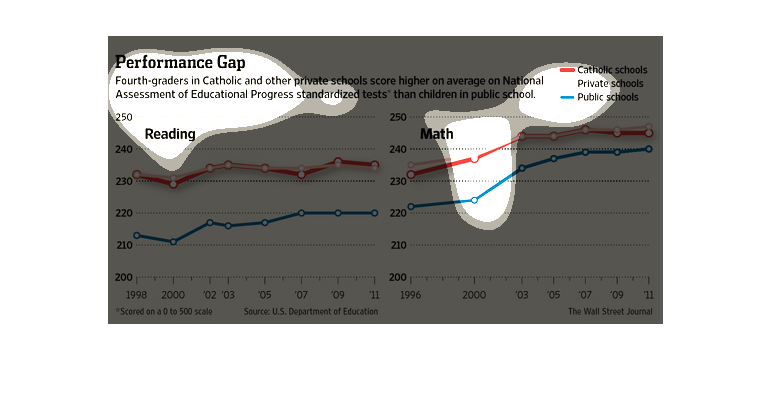
This image is entitled "Performance Gap."  It shows fourth-graders in Catholic and other private
schools score higher on average on National Assessment of Educational Progress standardized
tests than children in public school.  Reading is shown from 1998 - 2011.  Math is shown from
1996 - 2011.  Scores range from 200 to 250 (scored on a 0 to 500 scale).  The source is U.S.
Department of Education.  The image appeared in The Wall Street Journal.
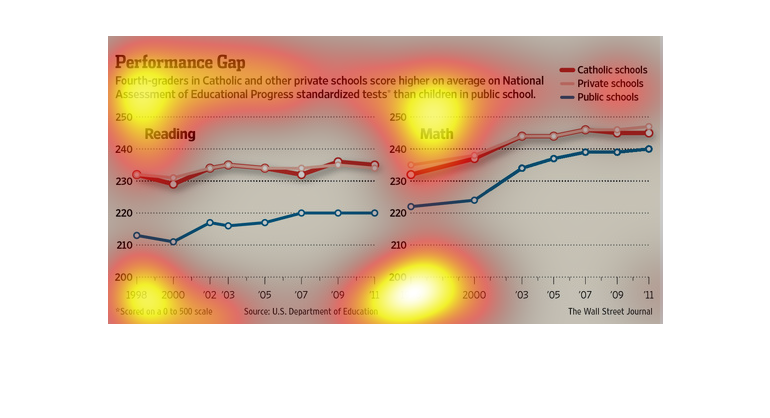
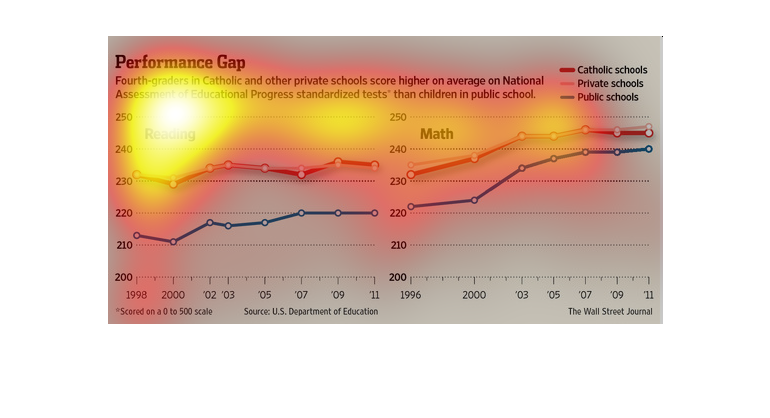
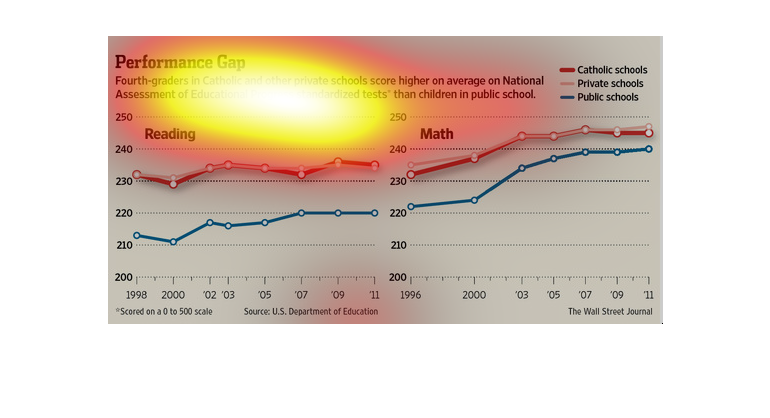
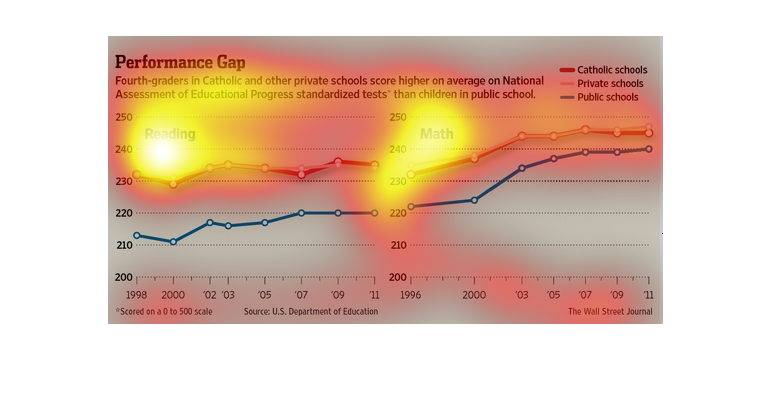
The image depicts fourth-graders in Catholic and other private schools score higher on average
on standardized tests than children in public schools. The numbers are similar in both reading
and math, with private school and Catholics school students scoring slightly higher. Overall
students are scoring higher compared to recent years in all institutions.
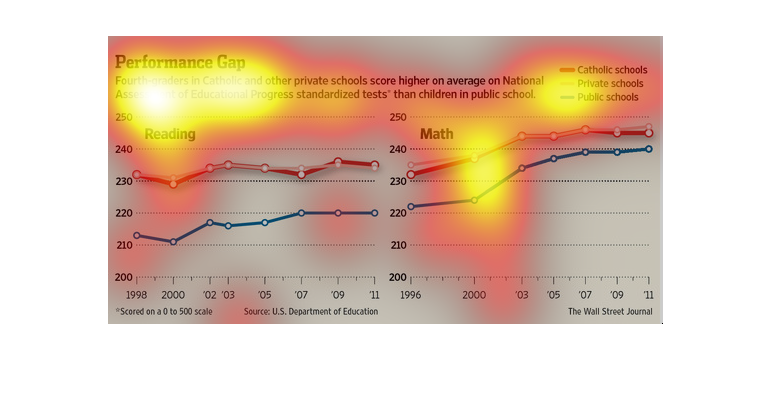
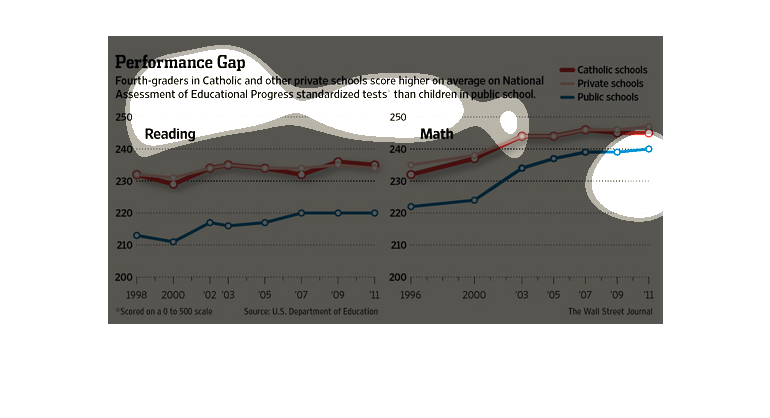
The following chart shows that children in Catholic and other private school score higher
on standardized test that those students who attend public schools.
This is a line graph that shows how fourth-graders in catholic and other private schools score
higher on national assessment testing than children in public schools.
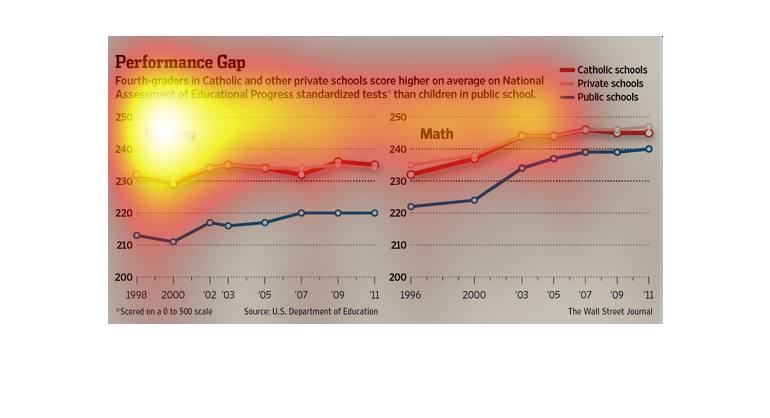
This chart describes the performance gap. Specifically, fourth graders in Catholic and other
private schools. Different categories are represented by different colors.
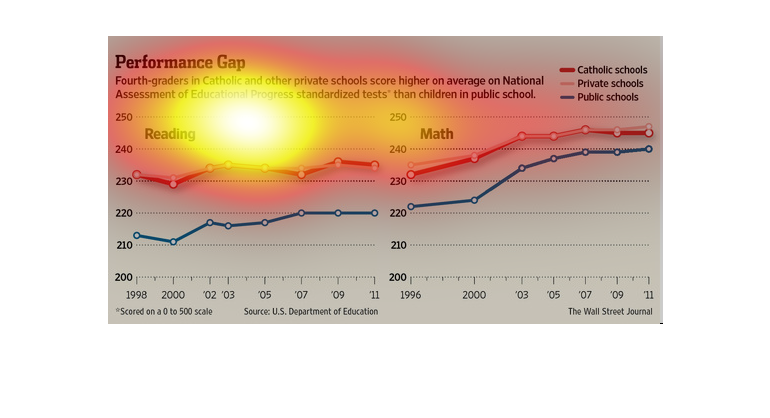
This chart shows that fourth-graders in Catholic and other private schools score higher on
average on National standardized tests as compared to hose in public schools.
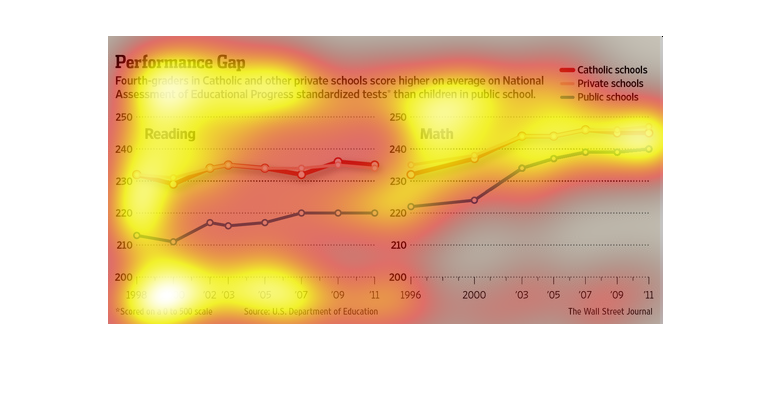
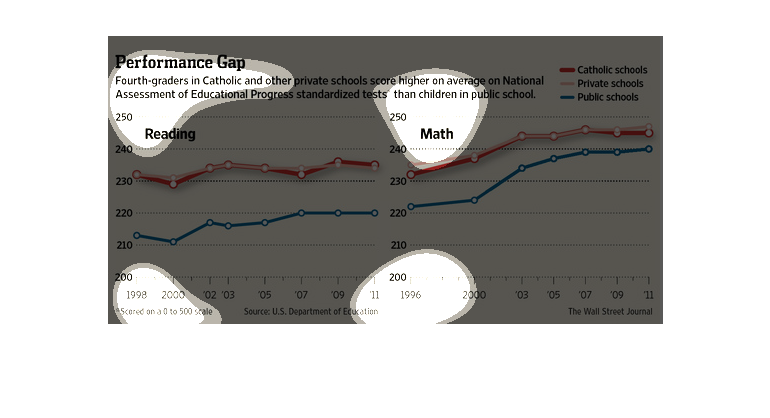
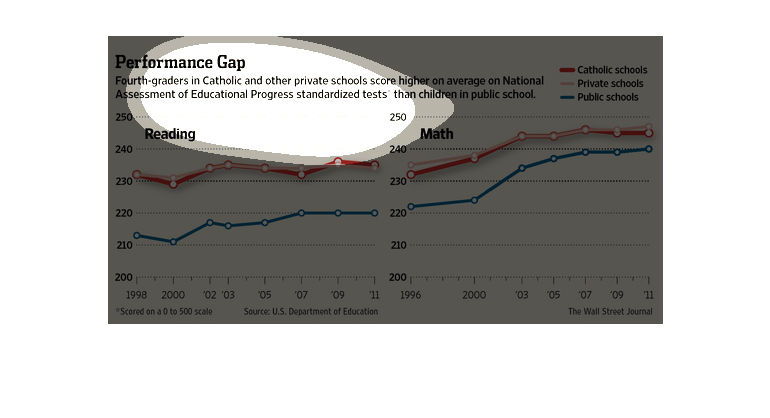
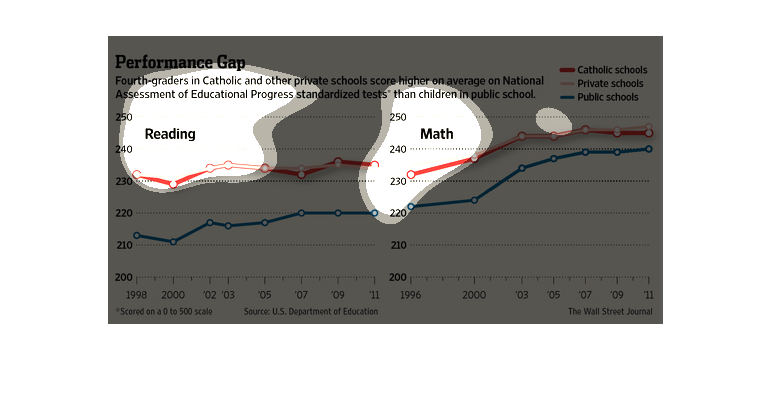
This is a chart showing the gap in education standard test scores for fourth graders in private
or catholic schools vs. private schools from 98-11. While private and catholic in reading
score about 235 public was barely 220, math was 250 to 240.
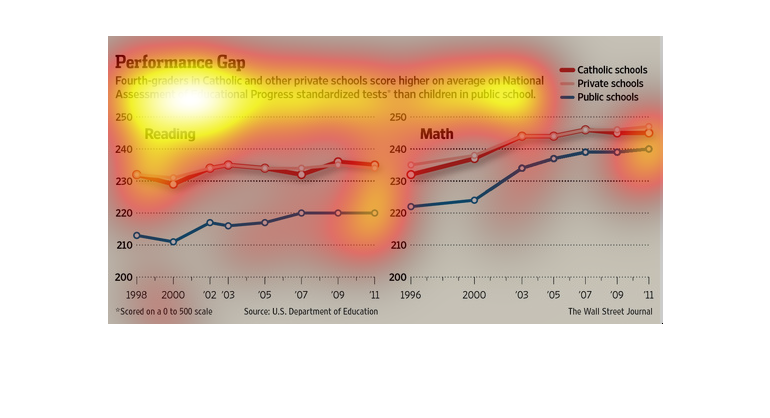
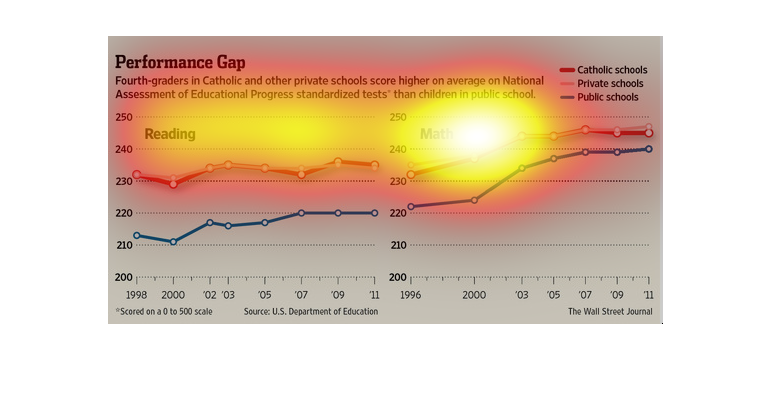
This chart from the Wall Street Journal shows how there is a performance gap between catholic
and private school kids and public school kids on standardized tests
This chart from the Wall Street Journal shows how there is a gap between children in catholic
or private schools and children in public schools when evaluated based on test scores