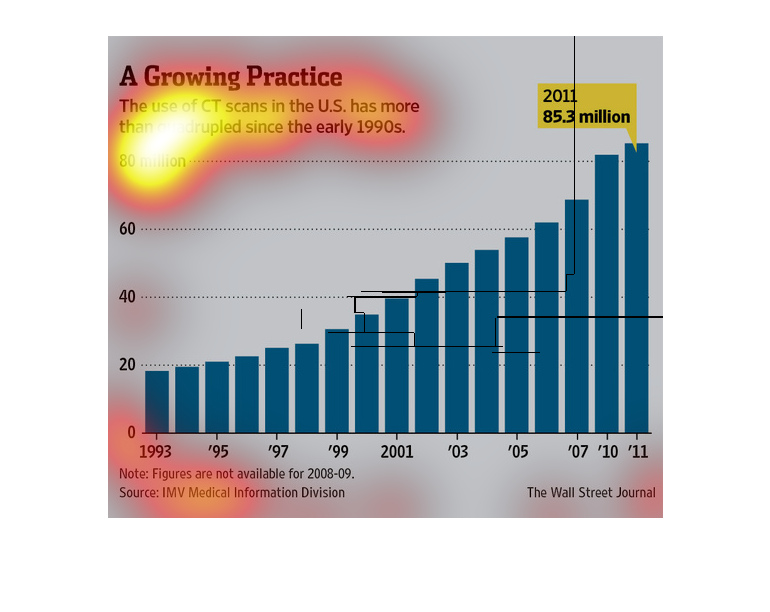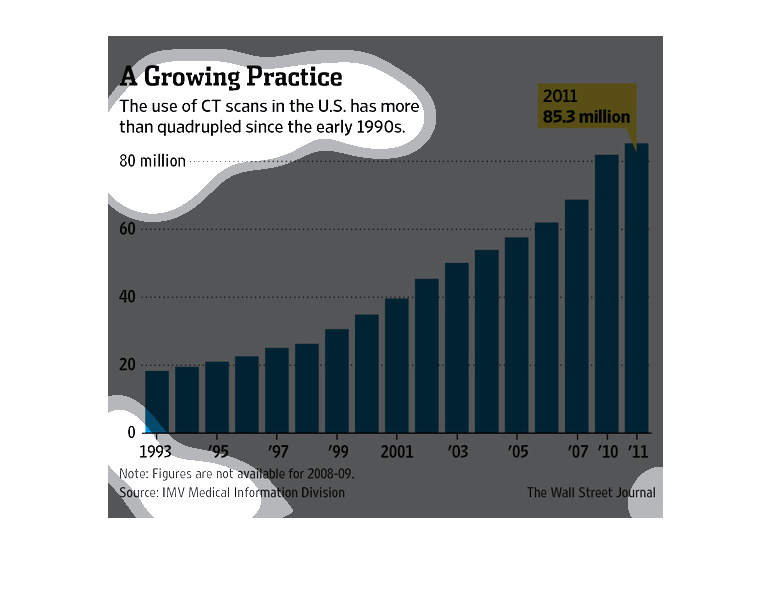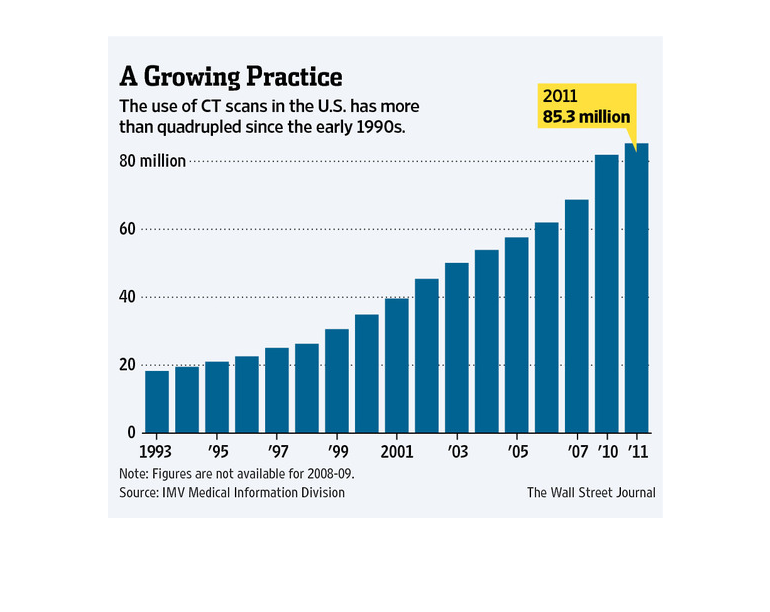
This graph is illustrating how the amount of CT scans have more than quadrupled in the United
States. This graph shows these increases since the early 1990s.
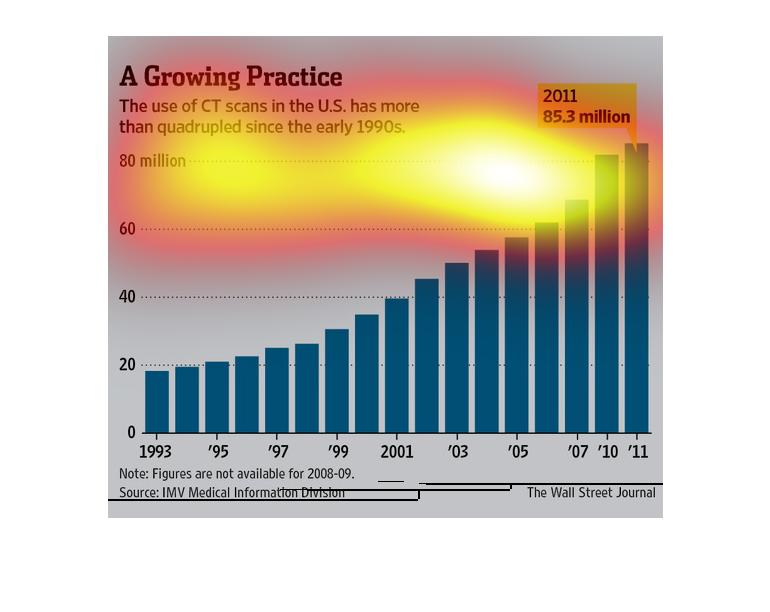

The use of CT scans in the US has more than quadrupled since 1990.  85.3 million were performed
in 2011.  Less than 20 million were performed in 1993.  At first glance, it appears that there
is a jump between 2007 and 2010, but that is because numbers are not available for 2008 and
2009.
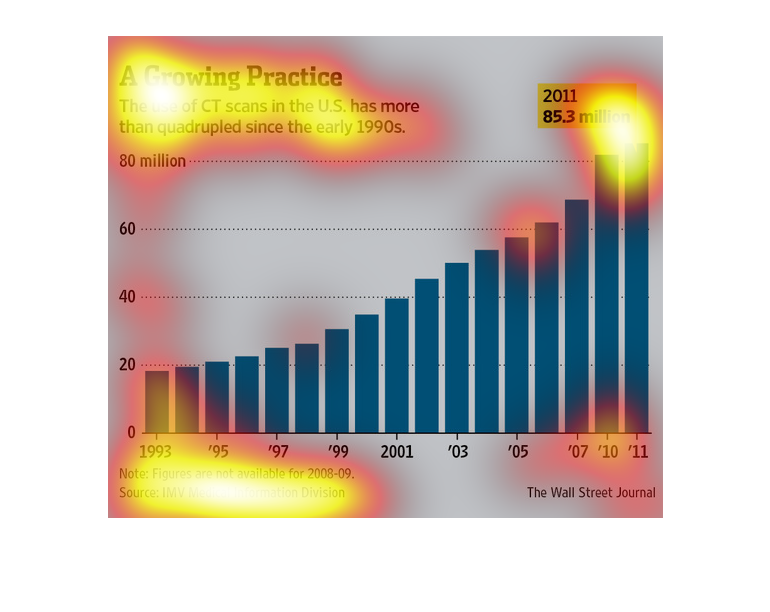
This chart shows CT scans has quadrupled in the span of 1993 to 2011. It went from less than
20 million in 93 to 85.3 million in 2011. The chart shows continuous growth from 93 to 2011.
This chart from the Wall Street Journal shows how the use of CT scans has quadrupled since
1990 and is more commonly used for diagnosis than ever before
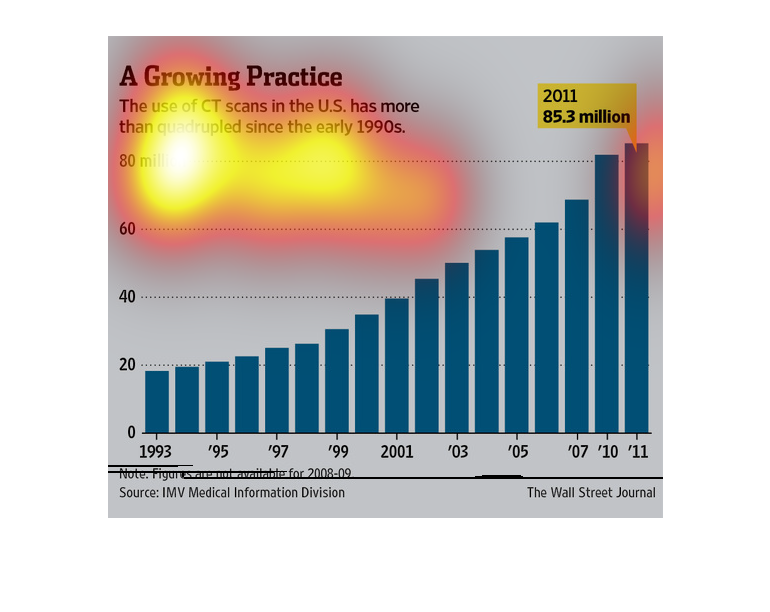
The image depicts the use of CT scans in the US more than quadrupling since the early 1990's.
2011 had a high of 85.3 million scans performed versus around 20 millions in 1993.
This chart will attempt to show that CT scans have become a growing practice in the U.S. The
graph wil show the rate of CT scans and how they have quadrupled since the early 1990s.
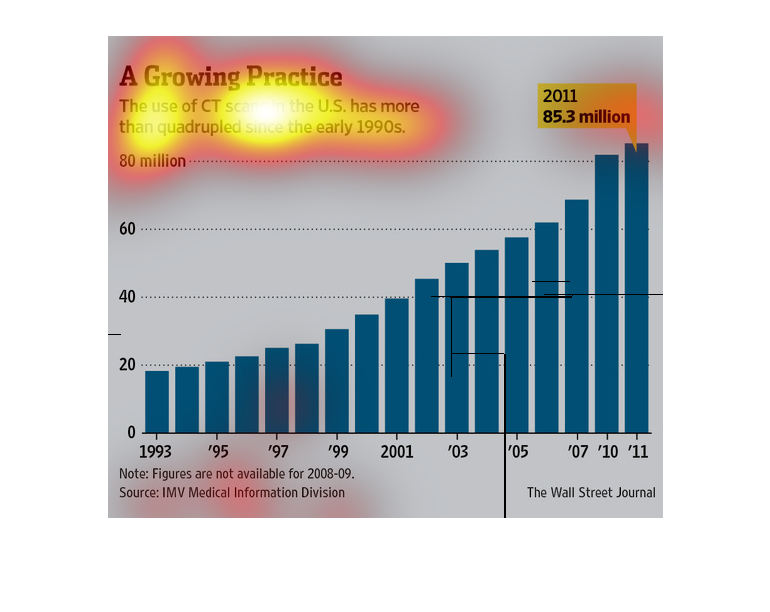
This chart depicts the number of CT scans used in the United States over several years. Overall,
the obvious trend is that the number of CT scans being used has increased steadily.
This is a graph showing C.T. scan usage in the United States of America. There is a graph
showing how much it has grown from the 90's until the year 2011. It has risen rapidly.
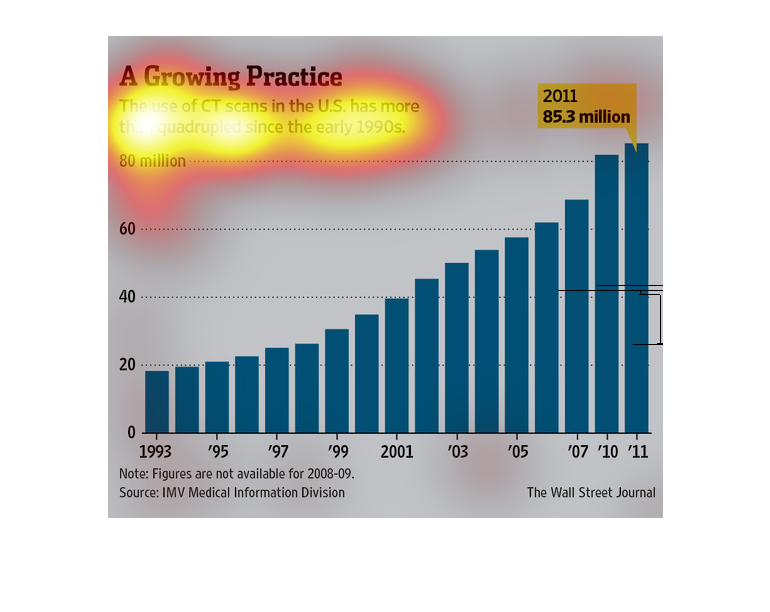
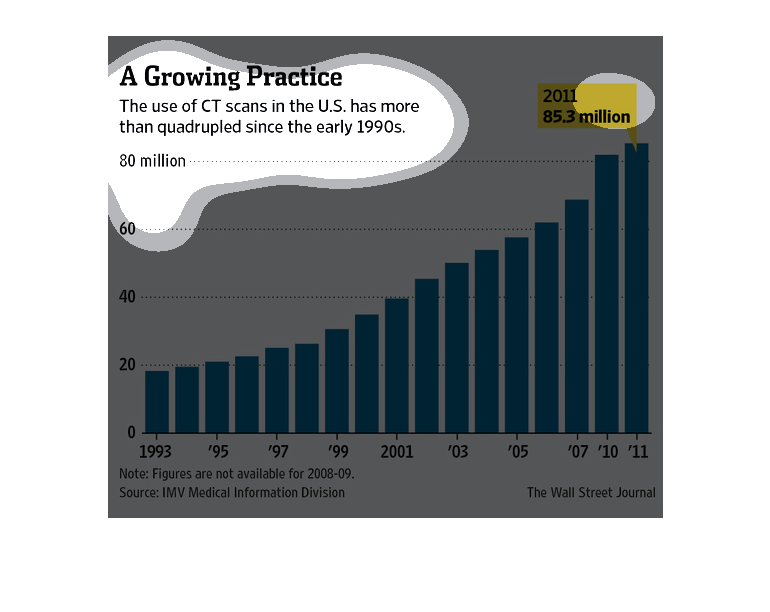
This chart from the Wall Street Journal shows how the use of CT scans in the United States
has almost quadrupled since 1990 and are more useful than ever
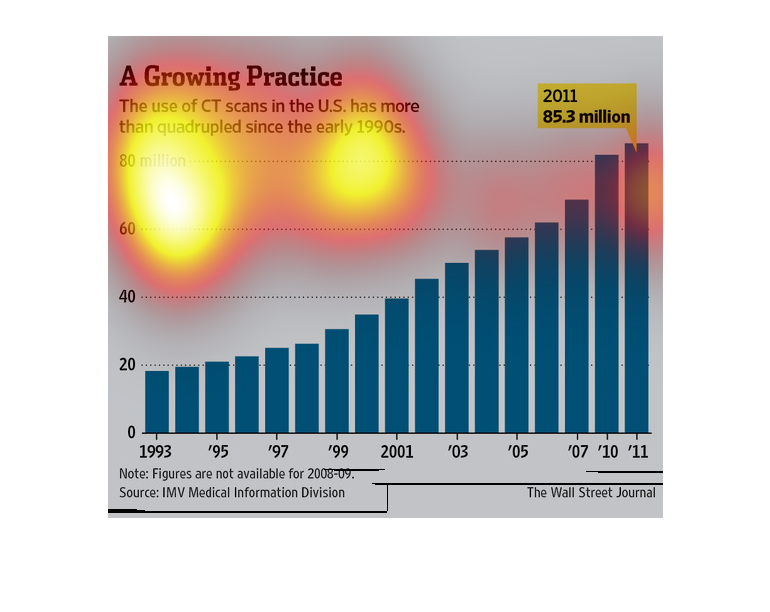
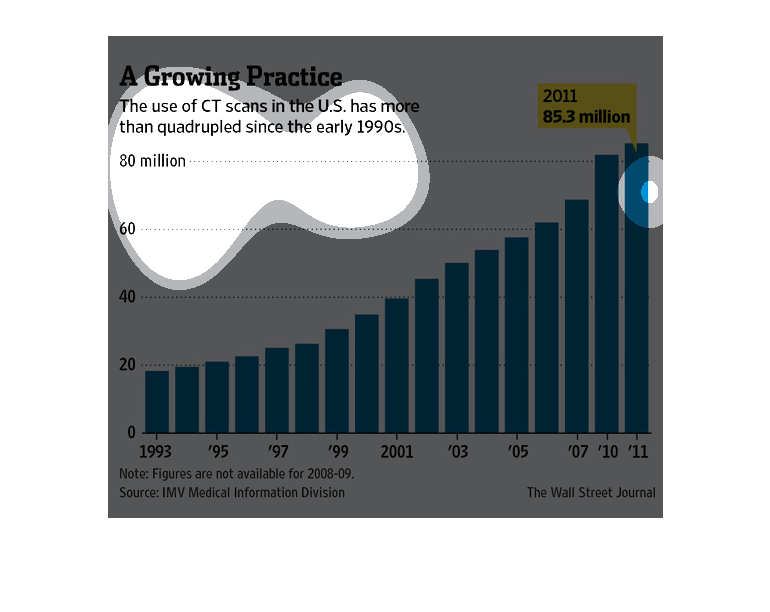
In this study from the Wall Street Journal- conducted from research gathered during the time
frame of 1993 to 2011- we see that the use of CT scans has increased dramatically in the United
States of America.
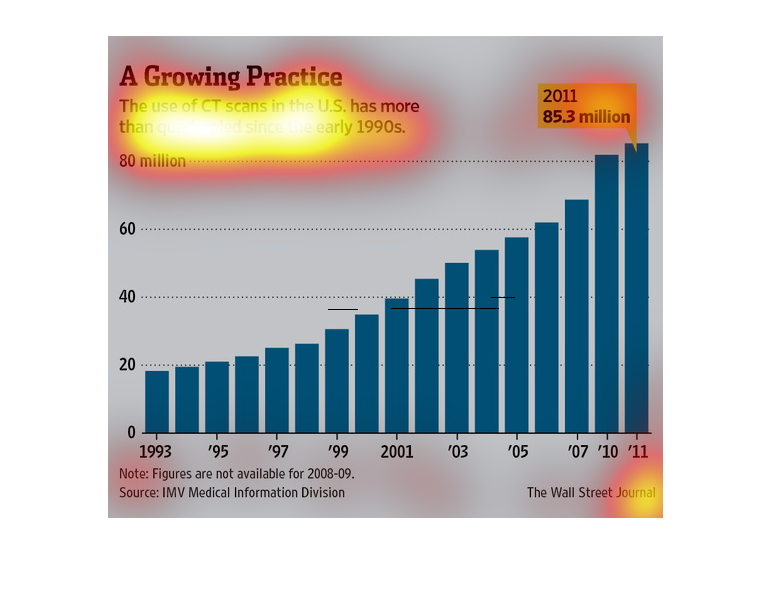
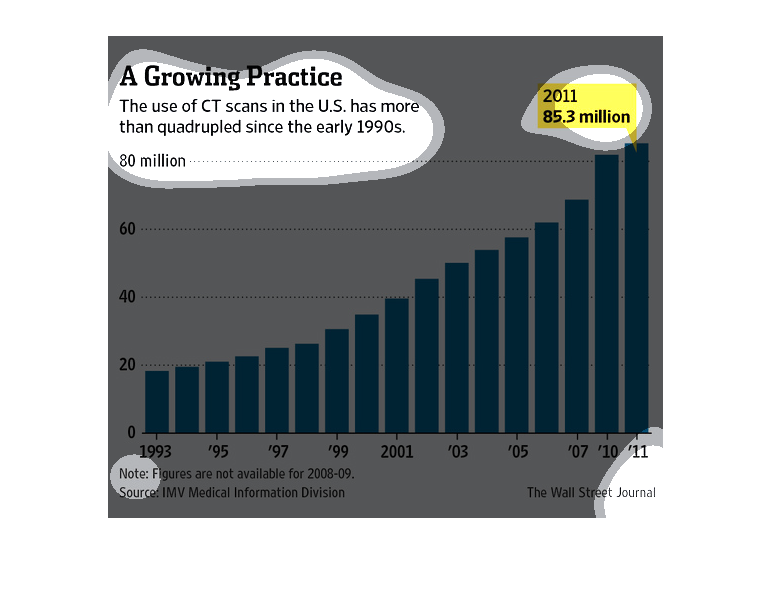
An infographic on the use of CT Scans since the early 90's to 2011. It states that the use
of these has nearly quadrupled, and the bar graph replicates this statement, visually.
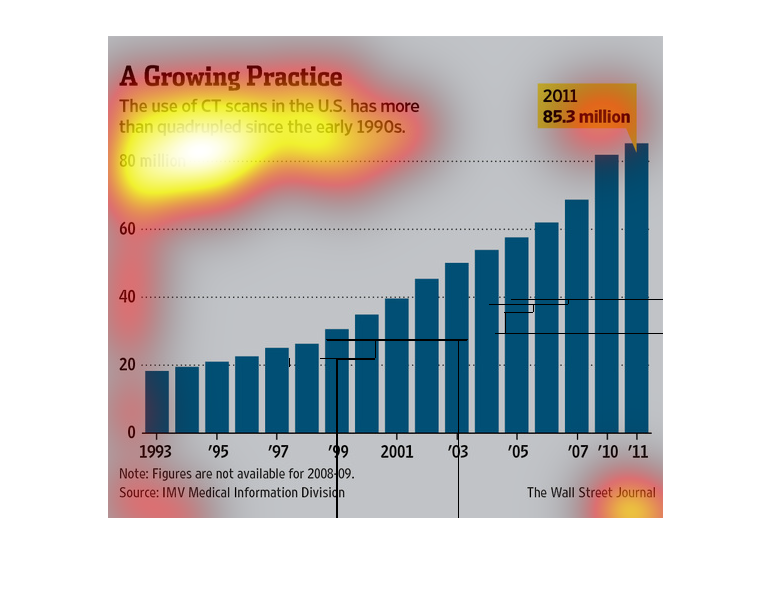
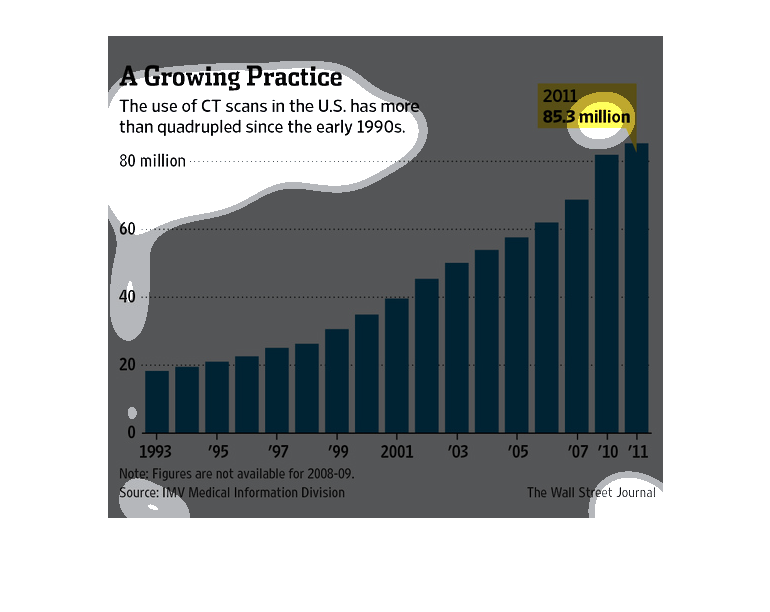
This is a bar graph showing the rising number of people who have had CT Scans done each year,
from 1993 to 2011.  The graph is measured in tens of millions.
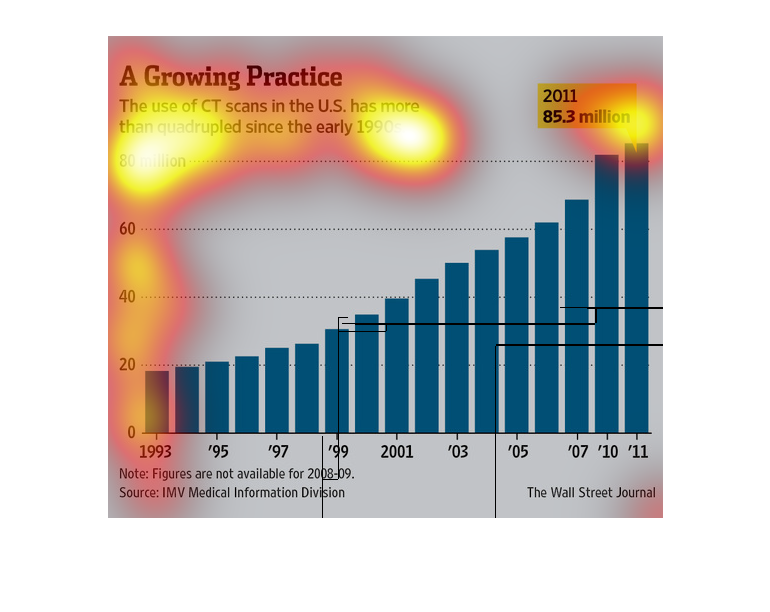
This image is entitled "A Growing Practice."  It shows the use of CT scans in the U.S. has
more than quadrupled since the early 1990's.  Numbers range from 0 to 80 million from 1993
- 2011.  The source is IMV Medical Information Division.  The image appeared in The Wall Street
Journal.