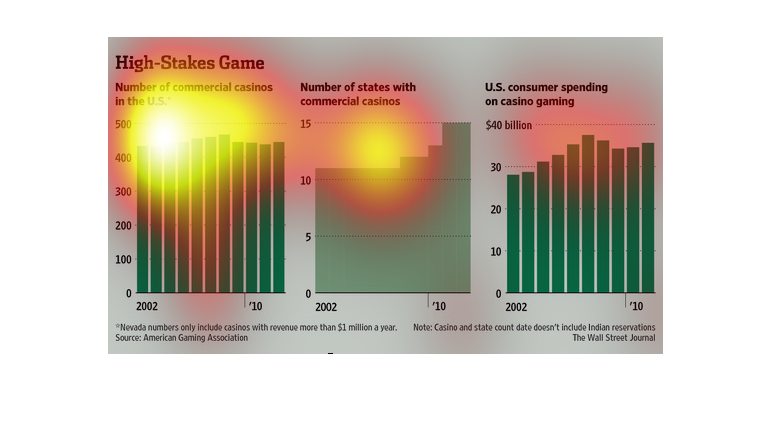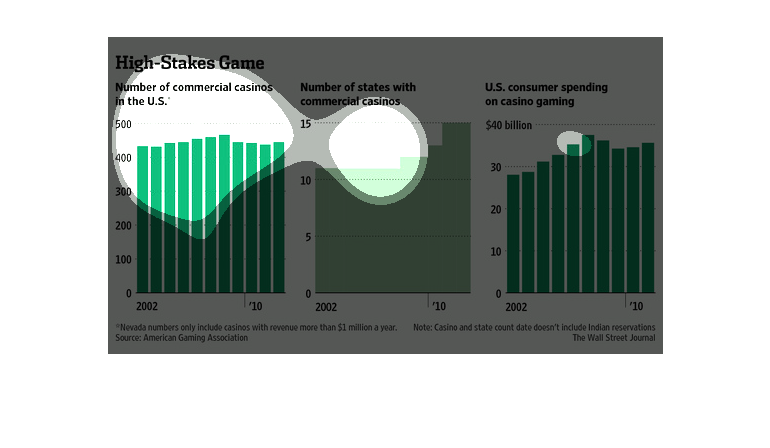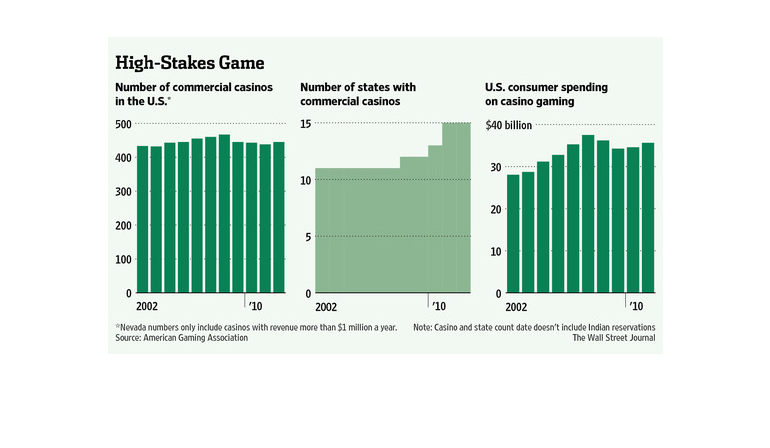
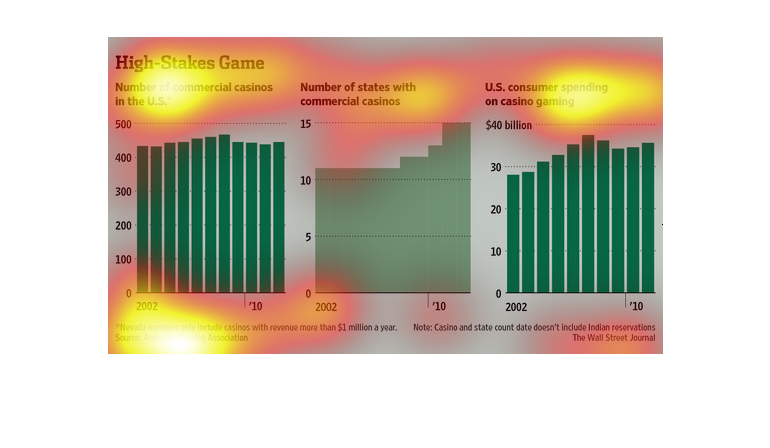
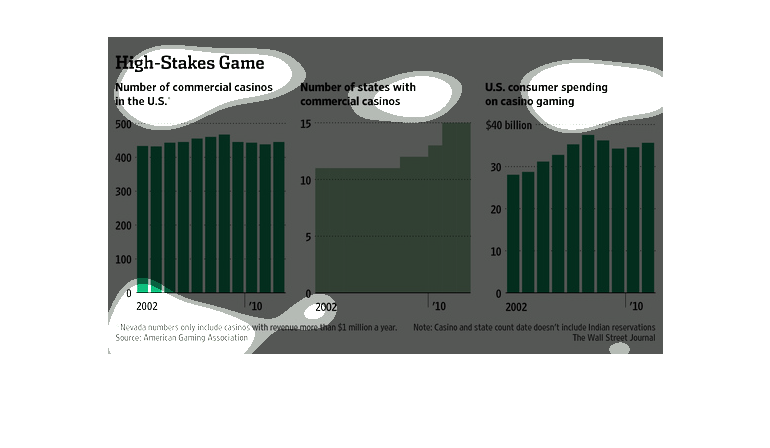
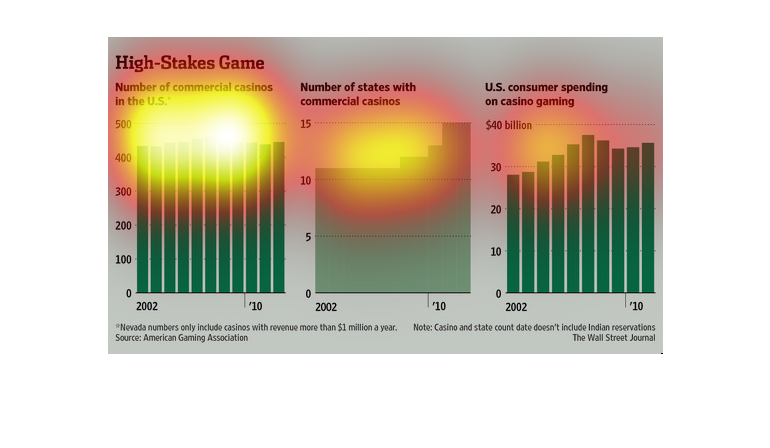
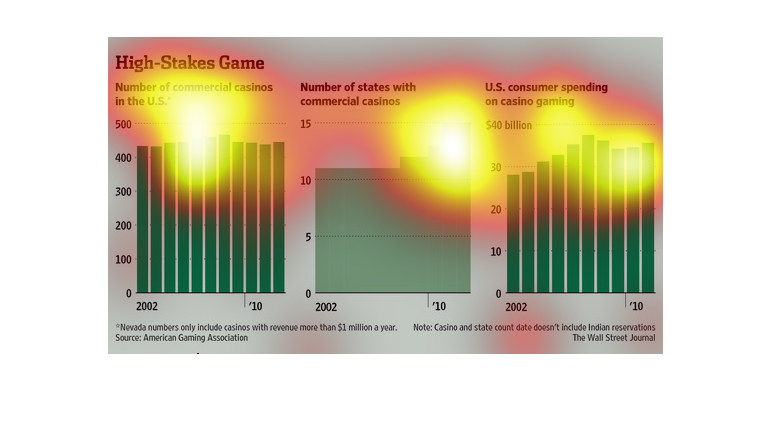
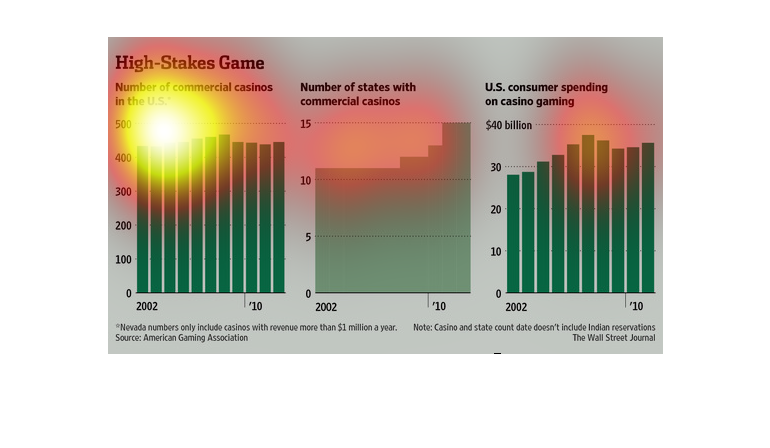
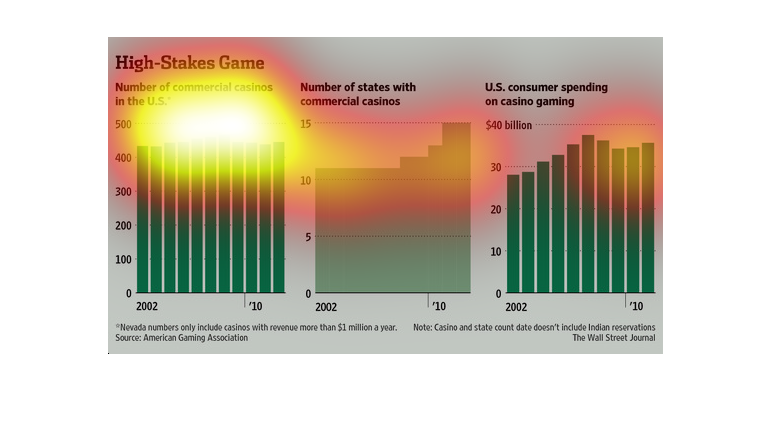
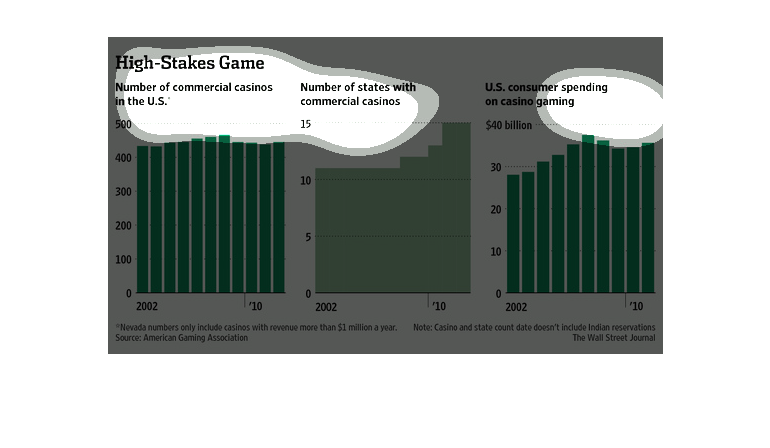
This image is entitled "High Stakes Game."  It shows three graphs:  Number of commercial casinos
in the U.S. (left); number of states with commercial casinos (center); U.S. consumer spending
on casino gaming (right).  Data ranges from 2002 - 2010.  The source is American Gaming Association.
 This image appeared in The Wall Street Journal.
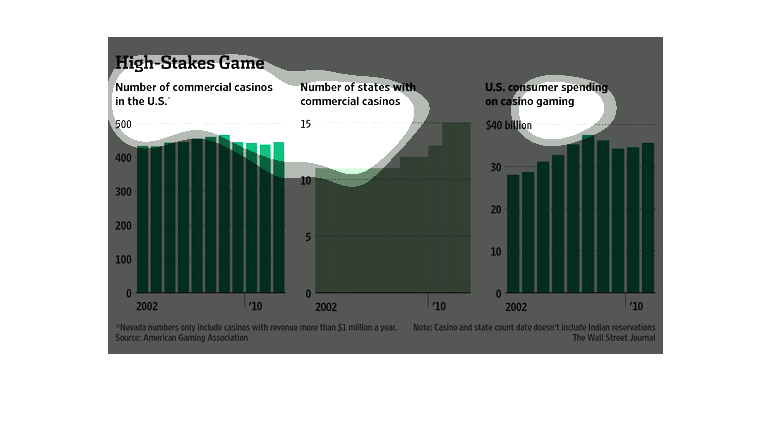
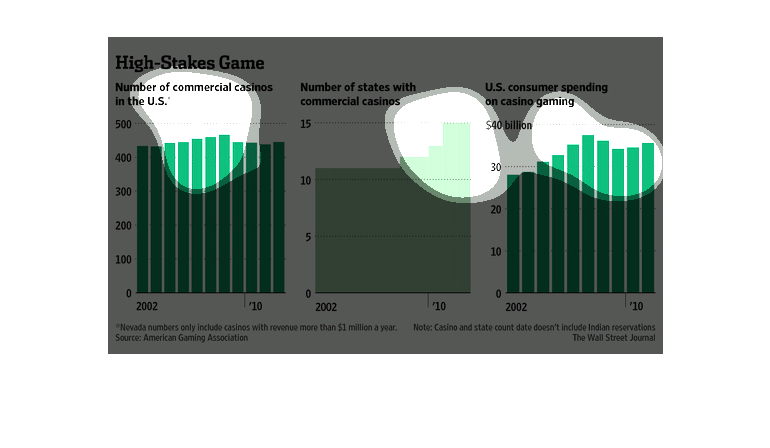
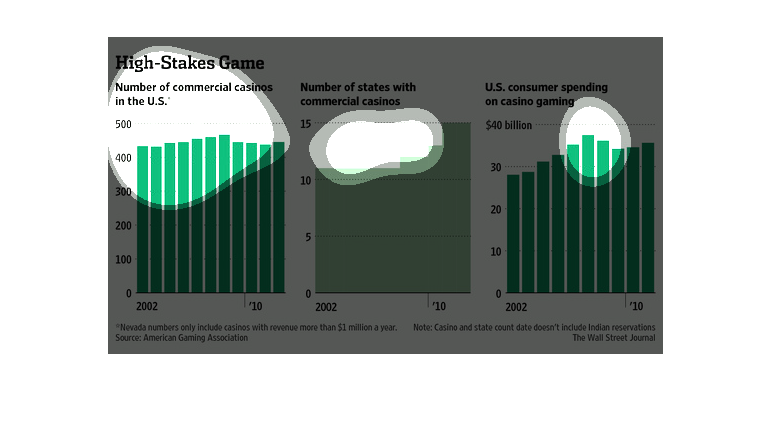
This is a series of bar graphs concerning commercial casinos in the United States over time.
It also shows the amount of domestic spending on casino gambling among Americans. There isn't
a strong discernible pattern in the data given, though the spending appears to increase.

This is a chart of Casino's in the US. the left chart shows the number of Casinos, showing
over 400 in 2002, then up towards 480 around 2008, then back to around 450 by 2010. In 2002
there were around 11 states with casinos, and 15 by 2010. Us spending was around $28 billion
in 2002, then around $30 billion by 2010.
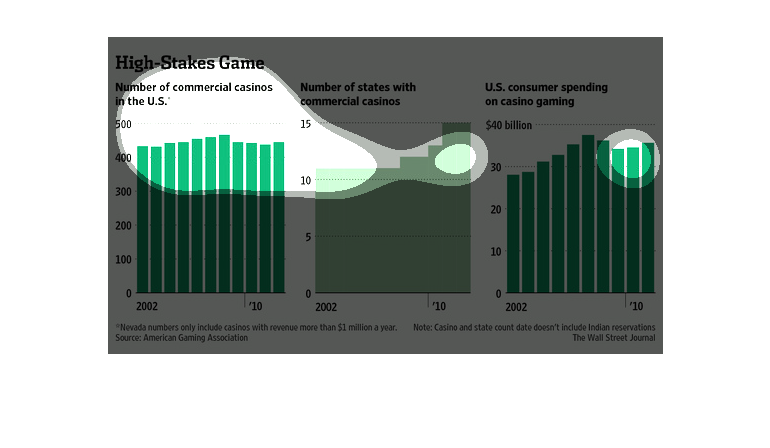
This chart from the Wall Street Journal shows how casinos are growing in number and number
of states allowing gambling. It also shows how average consumer spend at casinos is increasing
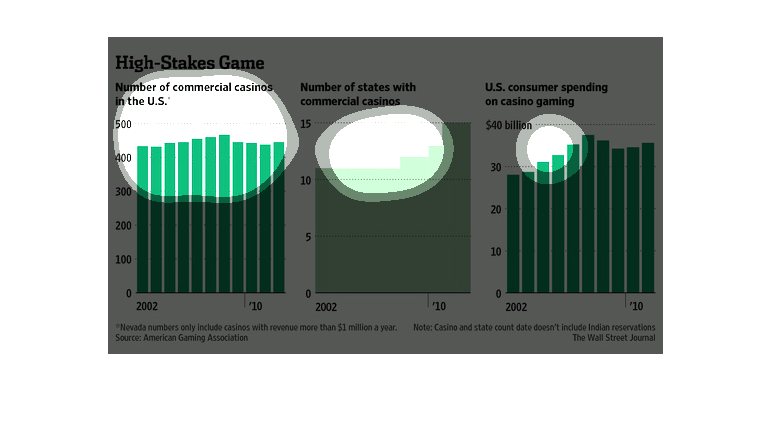
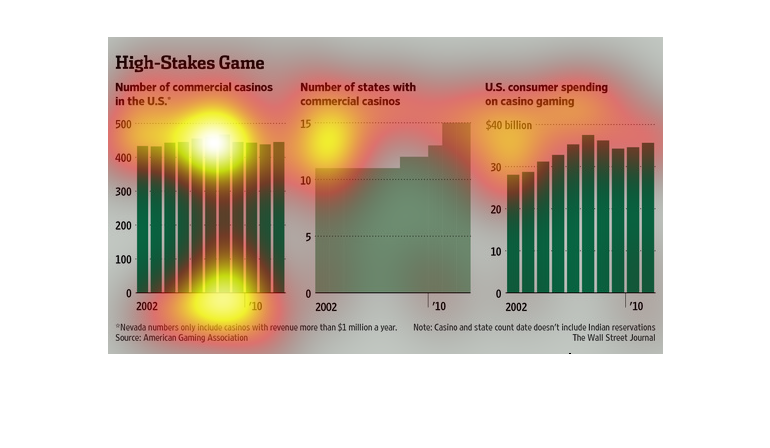
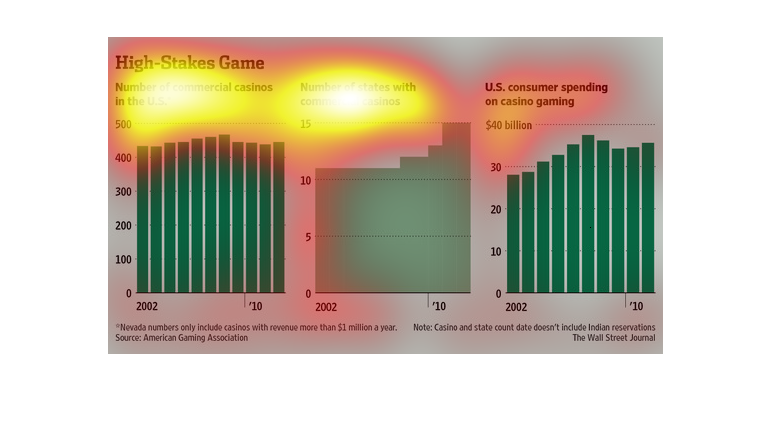
These graphs depict the number of commercial casinos in the U.S., number of states with commercial
casinos, and the amount of spending on casino gaming all showing an increase from 2002 to
2010
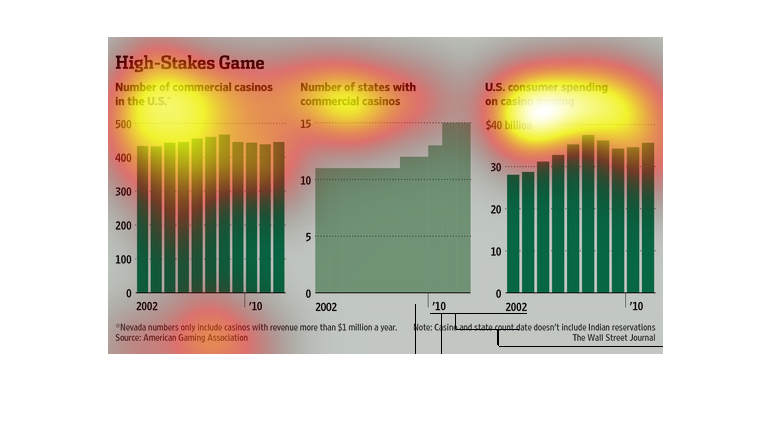
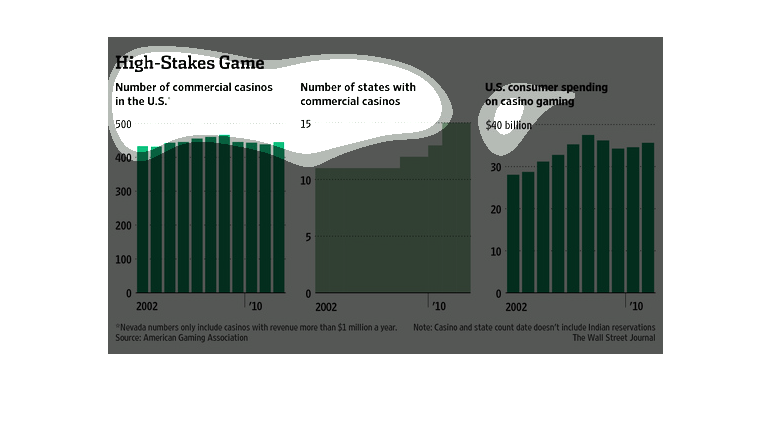
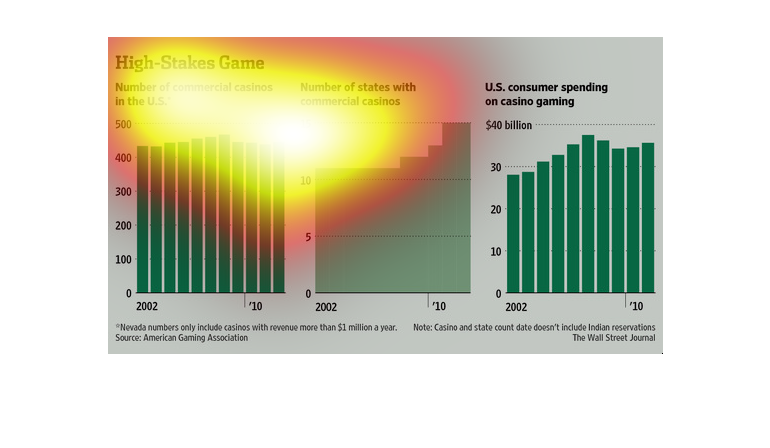
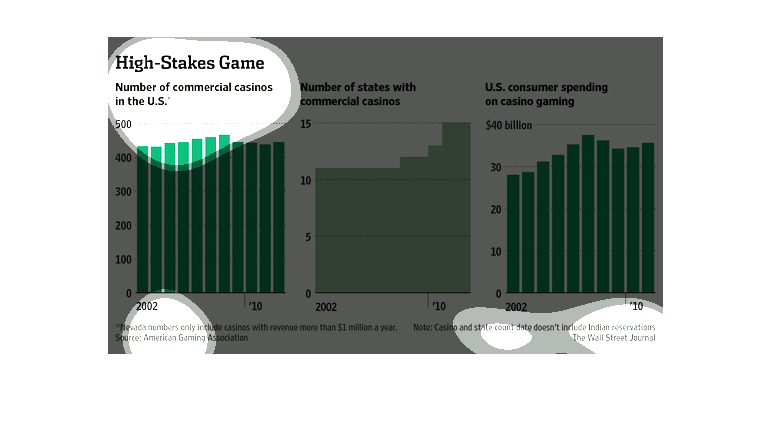
This image shows several charts depicting the numbers of casinos in the United Sates. The
numbers have remained relatively the same over time. Data was taken from 2002 to 2010.
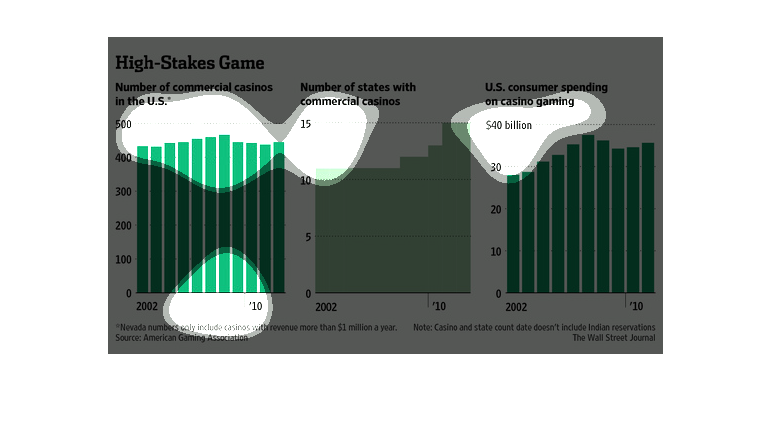
This chart is presentation of three charts. One is the amount of commercial casinos in the
US in 2002-10. The other chart is a growth of commercial casinos by state. The third chart
is on US consumer spending on casino gambling, which rose to 40 billion by 2010.
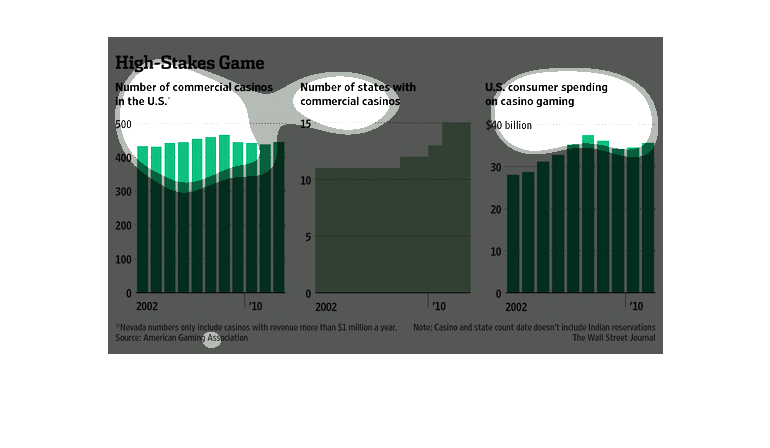
This is a set of three graphs that are being used to show the number of commercial casinos
in the united states, the number of states with casinos and how much money consumers use in
casinos.
The figure presented to the left is titled High Stakes Game.  The figure is a representation
of the statistical data for the number of commercial casinos.
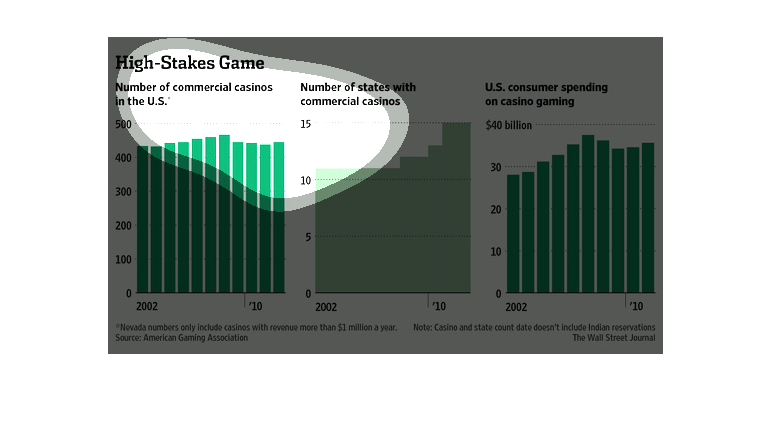
This chart from the Wall Street Journal shows how there is a growth in casinos in the united
states mostly at the state and indian territories level.
In this study conducted by the Wall Street Journal- from various different sources of record-
we see that in the span of ten years- 2000 to 2010- the rise in legal casinos nationwide.

The image has three parts and three bar charts. The first give the number of commercial casinos
in the US, which has remain mostly steady over the period 2002-10. Another chart shows how
the number states with casinos has grow over the same period. The last shows a steady consumer
spending on casino games, more or less.
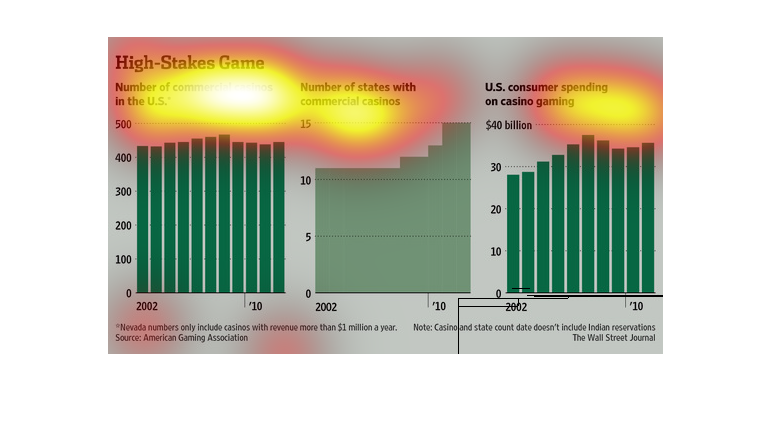
This image shows or depicts in statistical bar graph formats information concerning the number
of casinos by country, state and how much consumers are spending on gambling overall.