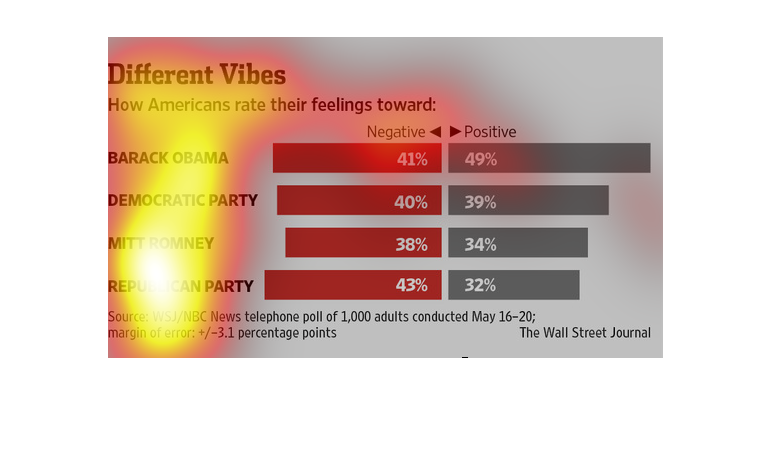
Graph showing different American viewpoints on Barack Obama and Mitt Romney including the
positive and negative feelings attributed towards each politician.
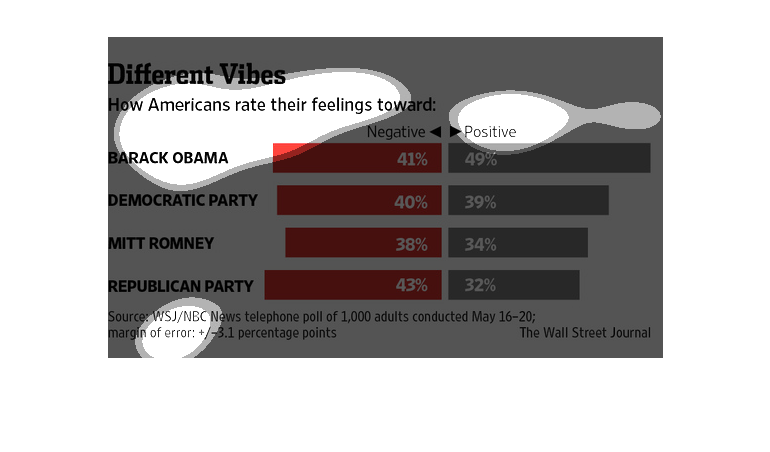
This image shows a chart depicting American citizen  feelings over Barack Obama, Mitt Romney,
the Democratic Party, and the Republican Party. Overall, Americans feel more positively towards
Obama.
This is a chart representing how Americans has positive or negative associations with Barack
Obama, the Democratic party, Mitt Romney, and the Republican party.
This chart describes as well as depicts how americans  describe their feeling as a comparison
between Obama, mitt romney, democratic party, and republican party.
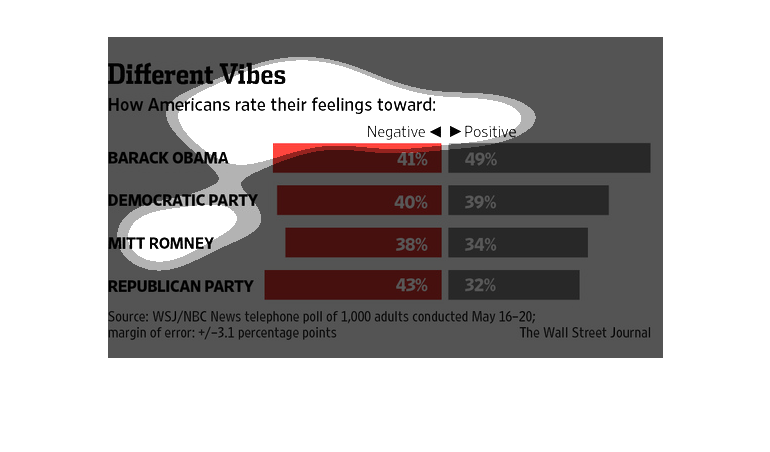
This chart depicts poll results on how Americans feel towards Obama, Romney, the Democratic
party, and the Republican party. For example, Americans have more positive feelings toward
Obama than negative.
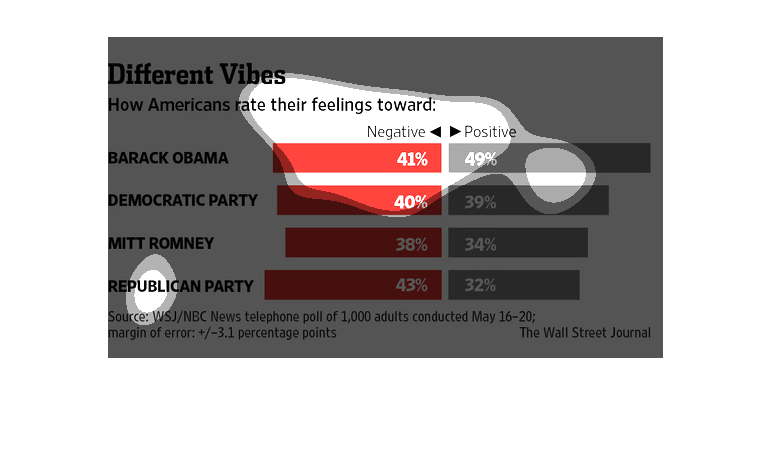
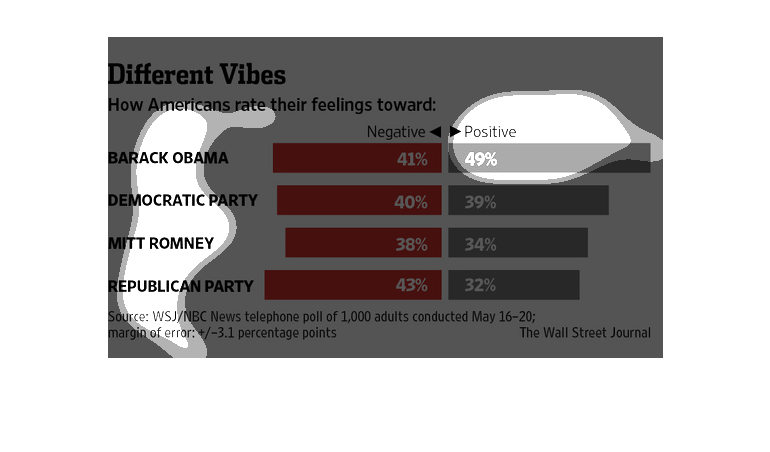
This chart describes different vibes. Specifically, how Americans rate their feelings toward
Barack Obama and others. Different categories are represented by different colors.
This image shows or depicts in bar graph statistical format data concerning how americans
rate their feelings towards various political entities and their parties.
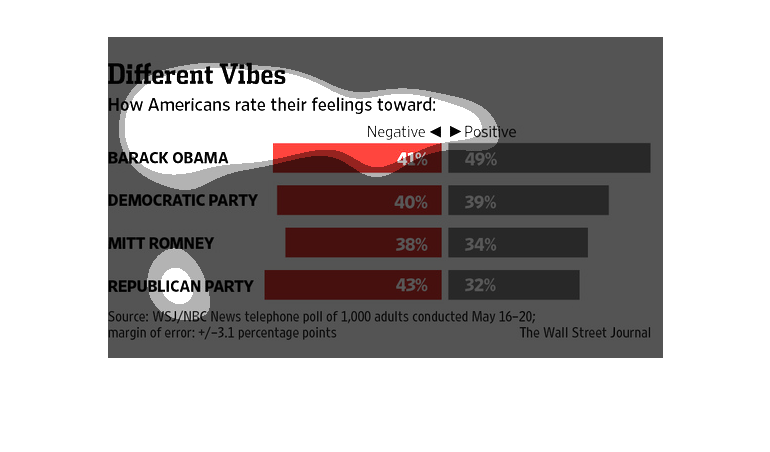
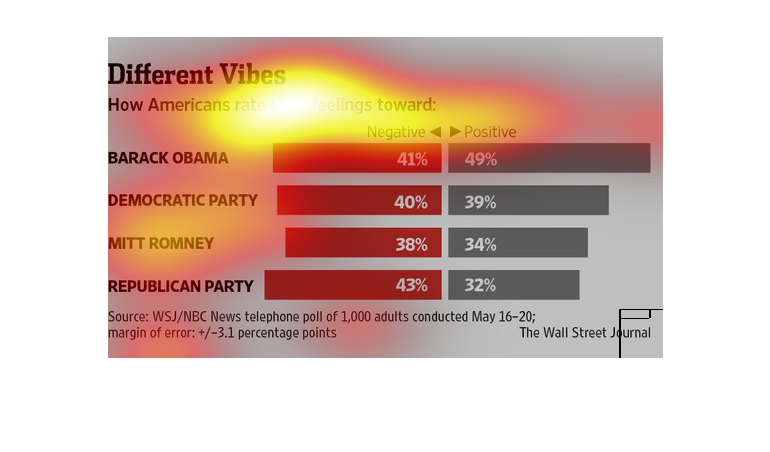
This chart from the Wall Street Journal shows how American sentiment is like for certain politicians
and political parties during the 2012 presidential election
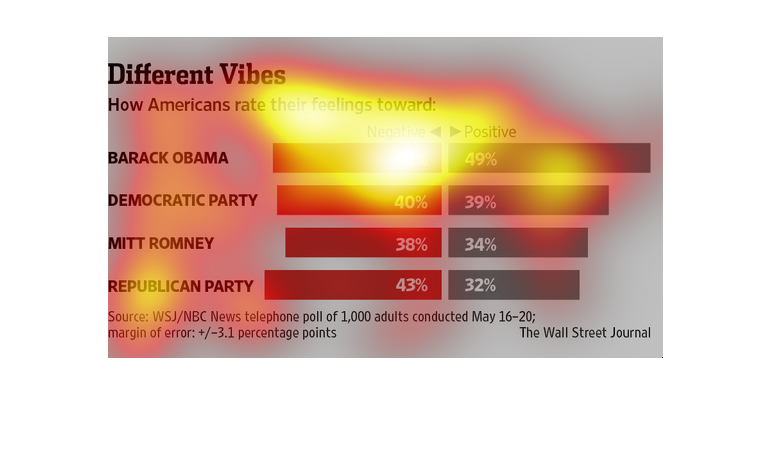
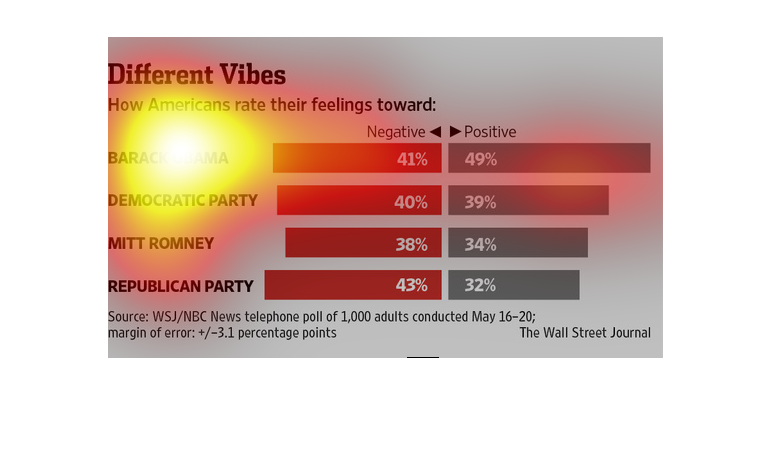
The figure presented to the left is titled Different Vibes.   The figure is a representation
of the statistical data for how Americans rate their feelings.
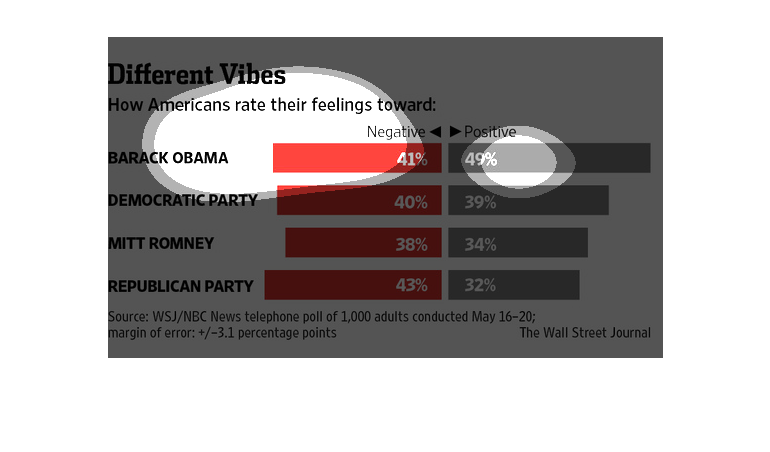
This chart from the Wall Street Journal shows how the country rates certain politicians and
parties during the 2012 presidential election. It measures favorability.
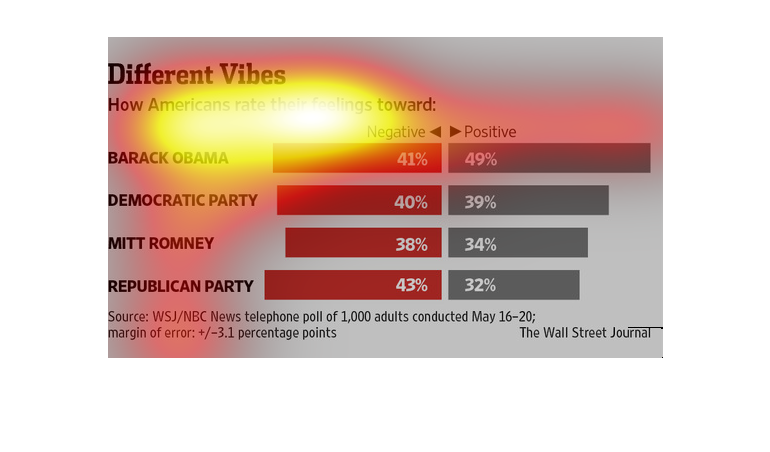
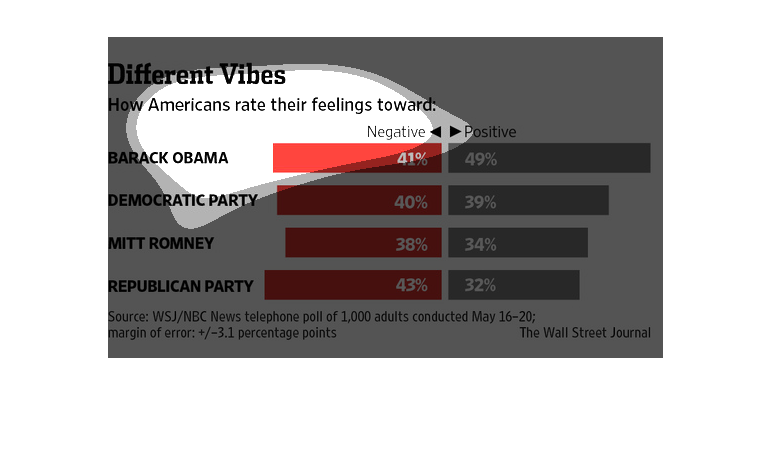
This chart is showing the opinions of 1,000 Americans and how they rate their feelings towards
political parties. Barack Obama has the most positive feelings while the Republican Party
has the most negative feelings from Americans.
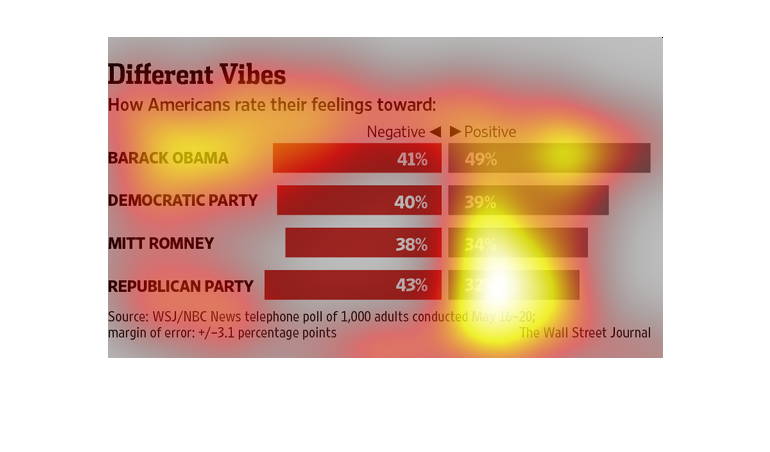
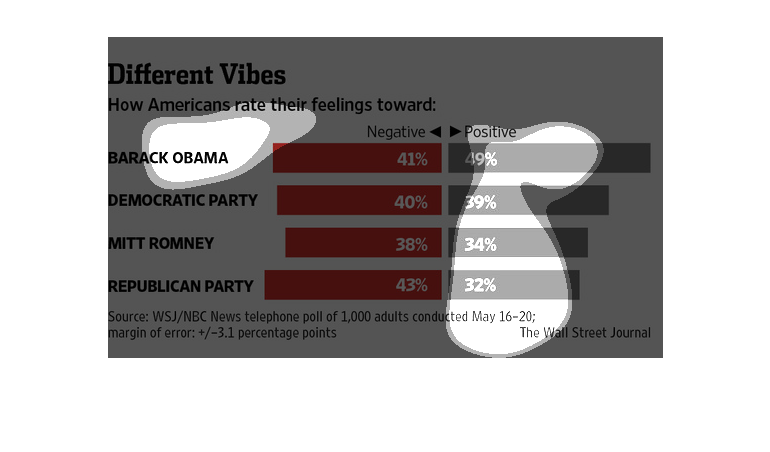
This image is a poll.  It reports how Americans rate their feelings toward Obama, the Democratic
Party, Romney, and the Republican Party.  Image shows how the former two have greater positive
reports, while the latter two less so.
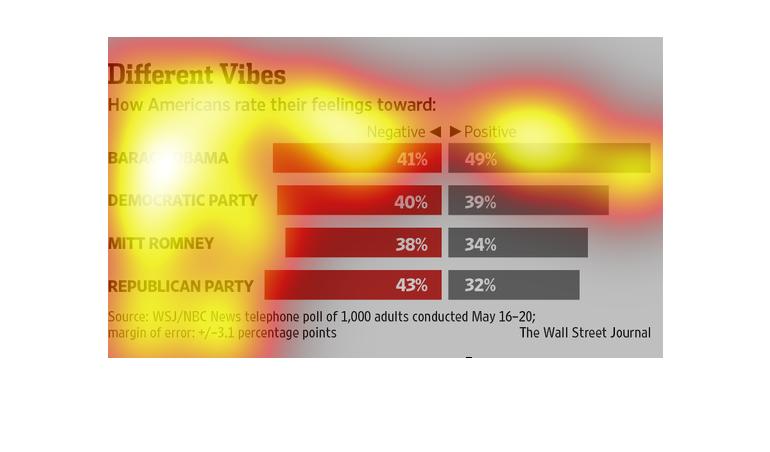
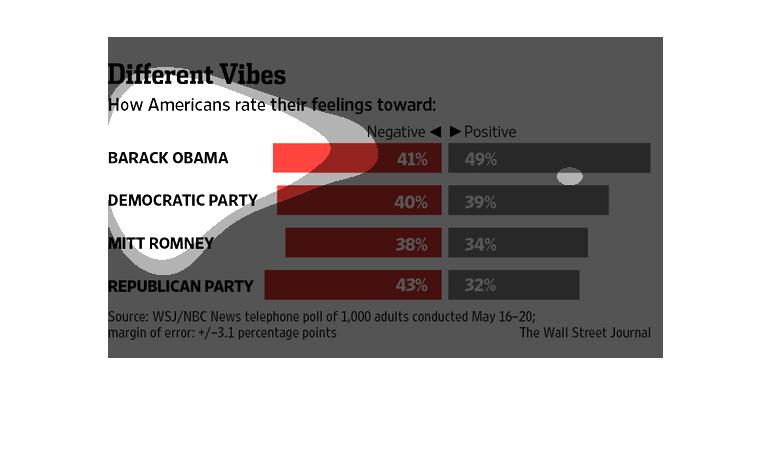
This graph is a people survey talking about how they feel about different subjects, including
Barack Obama, Democratic Party, Mitt Romney, and republican party. The graph is broken into
positive and negative.