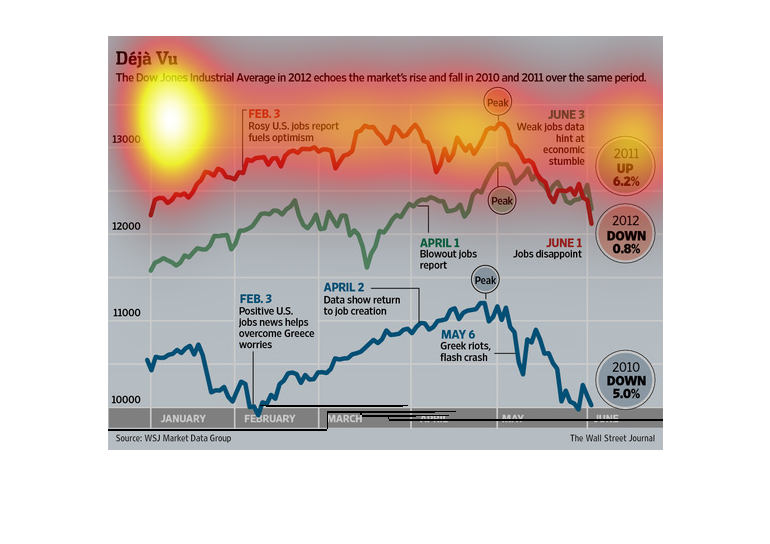
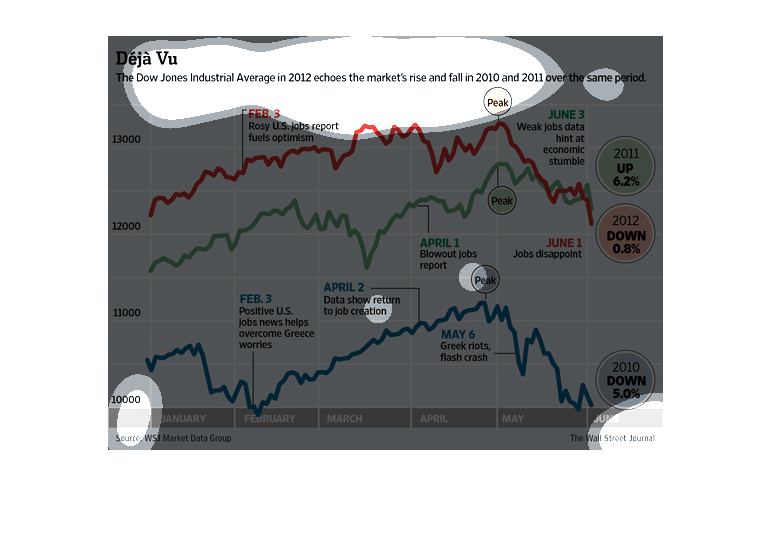
This chart from the Wall Street Journal shows how the Dow Jones Industrial average is experiencing
similar market trends from the boom and bust cycles of the past

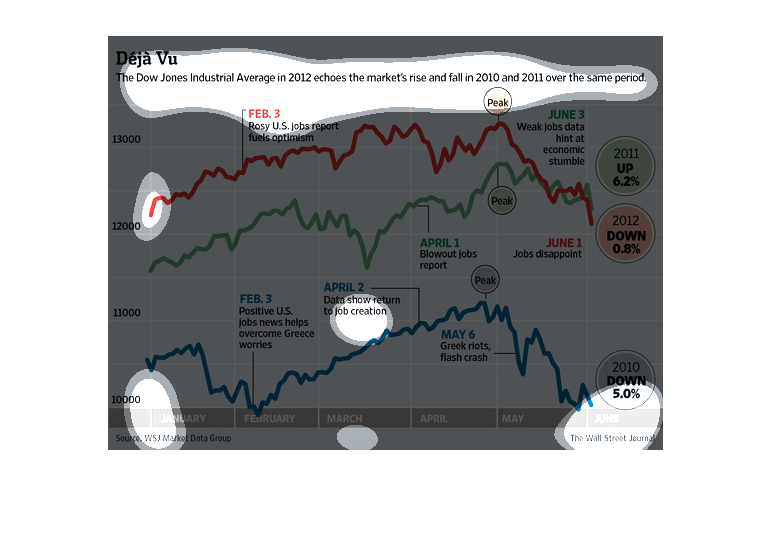
The image depicts The Dow Jones Industrial average in 2012 appearing similar to the fluctuations
that occurred in 2010-2011 over the time period studied.
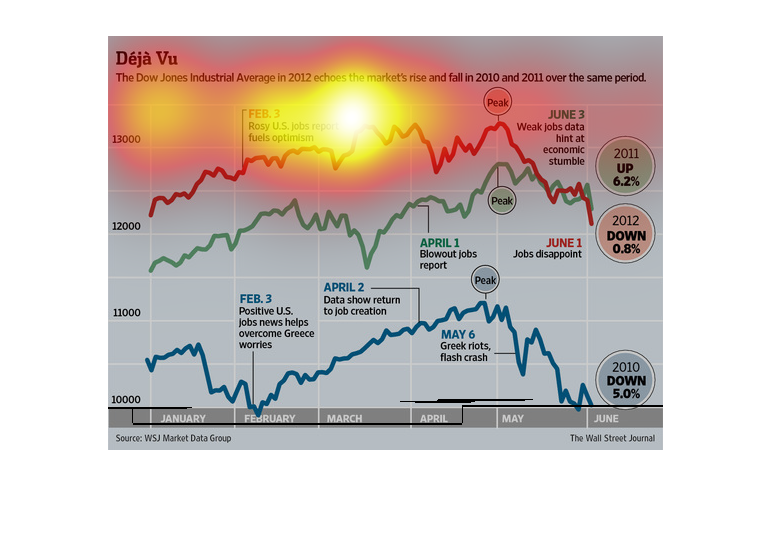
The figure presented to the left is titled Deja Vu.   The figure is a representation of the
statistical data for the Dow Jones industrial average in 2012.
This chart depicts the Dow Jones Industrial Average stock index in three years: 2010, 2011,
and 2012. It's rise and fall over the same period of time is similar over all three years.

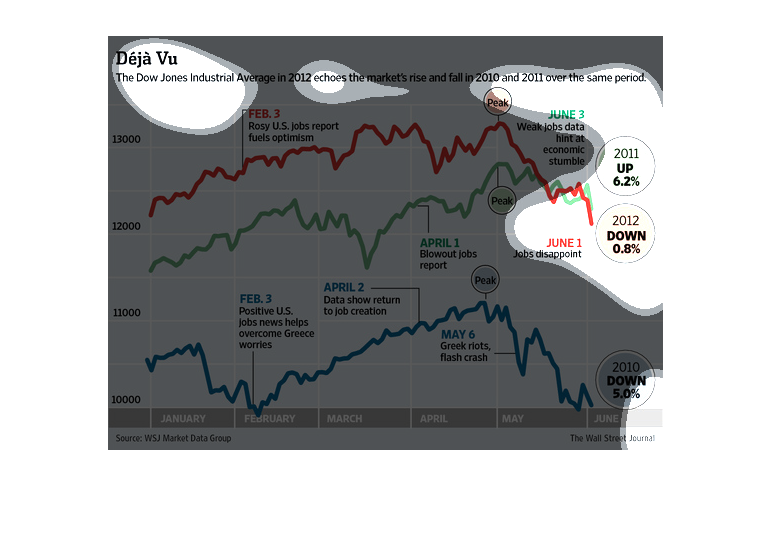
The Dow Jones Industrial Average for 2012 shows similar price action as that of the Dow Jones
Industrial Average for the year 2010 and 2011 during similar time frames.
This shows the Dow Jones Industrial stock exchange's average in 2012 mirrors the markets rise
and fall over the same period.  It has milestones and dates along the line graph.
This chart from the Wall Street Journal shows how the market movements in the Dow Jones Industrials
is reminiscent of the movements before the 2008 crash
This image, in a massive graphic, discusses the Dow Jones Industrial Averages 'echoing' of
2010 and 2011 over the same period of time.  For instance, although the DJIA was down 0.8%
in 2012, 5.05 in 2010, and up 6.2% in 2011, the overall graph lines are similar from year
to year.
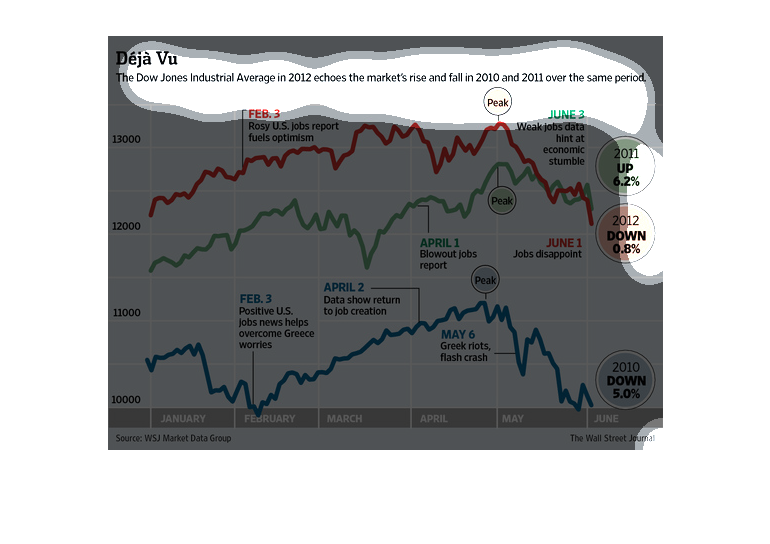
This is a graphic comparing the performance of the Dow Jones industrial average in the years
2010, 2011, and 2012. It does the comparison by means of a line graph. The set of line graphs,
when compared, show a similarity in performance between the three years.
The Dow Jones Industrial average from 2010-2012 follows the same basic pattern of rise and
fall each year. The first quarter of the year is marked by a rise and then fall, repeated
by another rise and fall in the second quarter.
This graph shows the trend of the dow jones industrial average in multiple periods. Multiple
trends are represented using line graphs. They are differentiated using different colors.