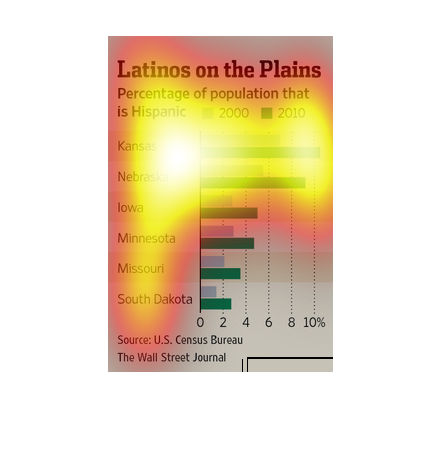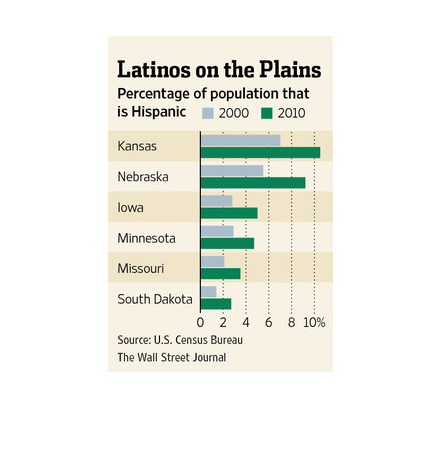
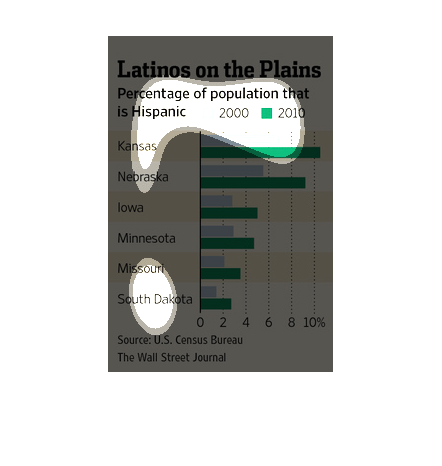
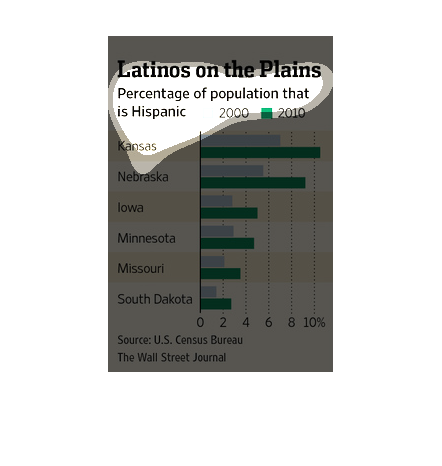
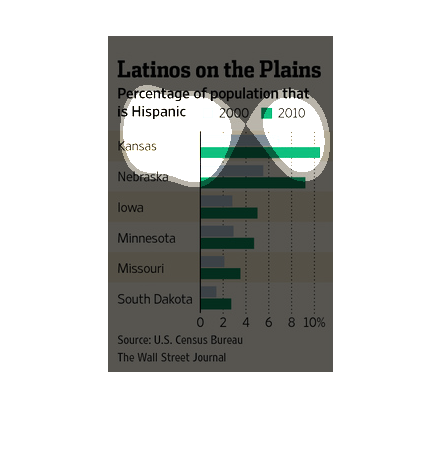
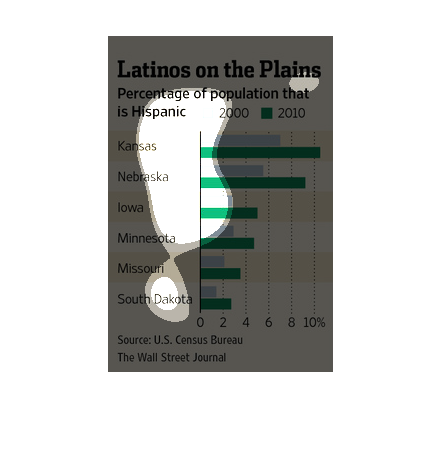
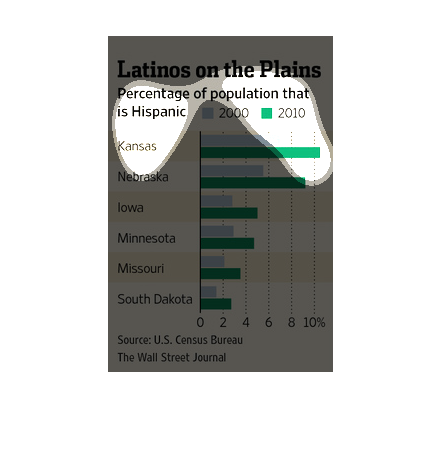
This image is entitled "Latinos on the Plains."  It shows  the percentage of population that
is Hispanic.  Numbers from 2000 are shown in blue, and numbers from 2010 are shown in green.
 The states shown are:  Kansas, Nebraska, Iowa, Minnesota, Missouri and South Dakota.  Percentages
range from 0 to 10.  The source is the U.S. Census Bureau.  The image appeared in The Wall
Street Journal.
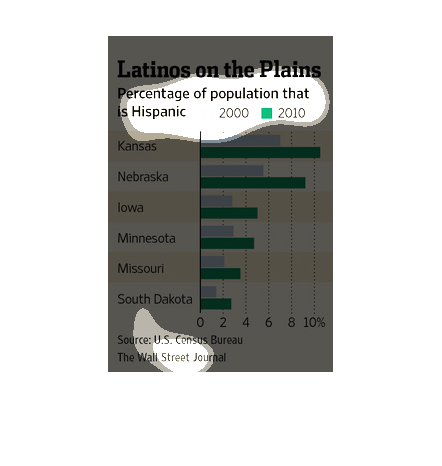
This graph depicts the percentage of the population that is Hispanic across the United States
Great Plains, with particular high percentages in Kansas, Nebraska, and Iowa.
This image shows the percentage of the population that is Hispanic in several states of the
United States of America. Data from 2000 and 2010 is shown.
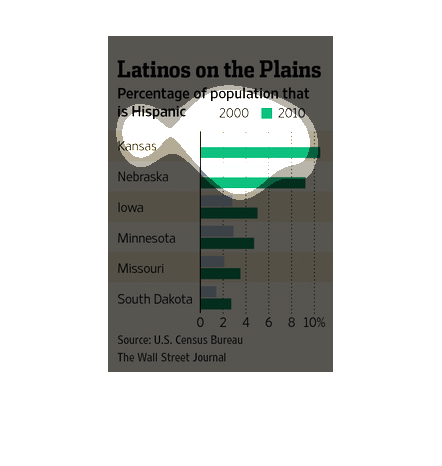
This chart is titled: Latinos on the plains. Showing percentage of population that is Hispanic.
Some of the states listed are Kansas, Nebraska, and Iowa.
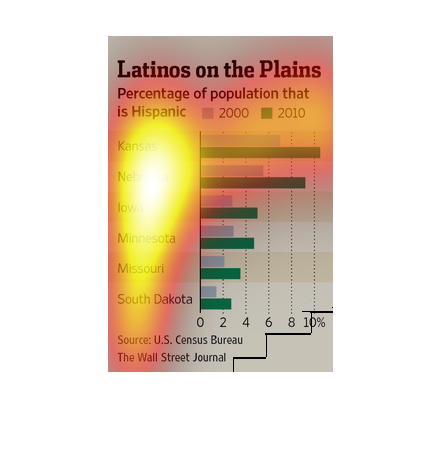
According to US census data, Latino population across the Great Plains area in the United
States has grown from 2000-2010. Specifically in Kansas, Nebraska, Iowa, Minnesota, Missouri,
and South Dakota
This is a graph that is being used to show the percentage number of people who are of Hispanic
heritage that live in the mid west region of the United States.
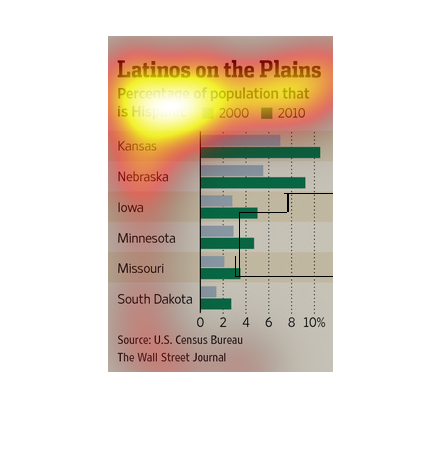
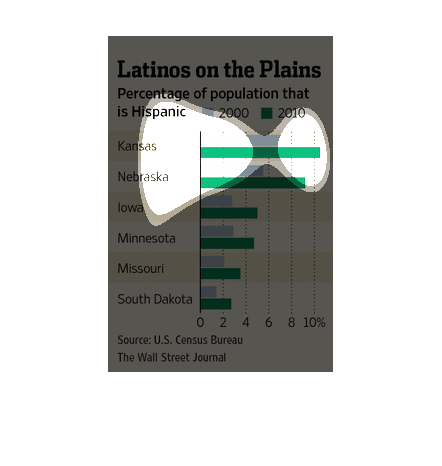
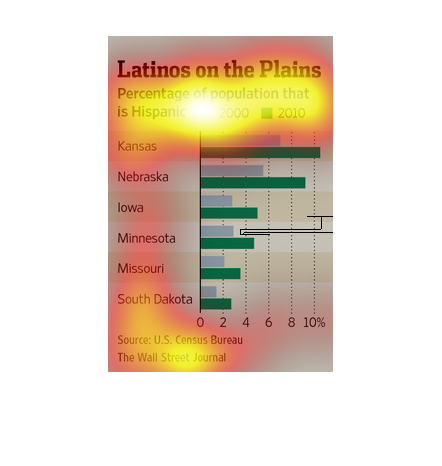
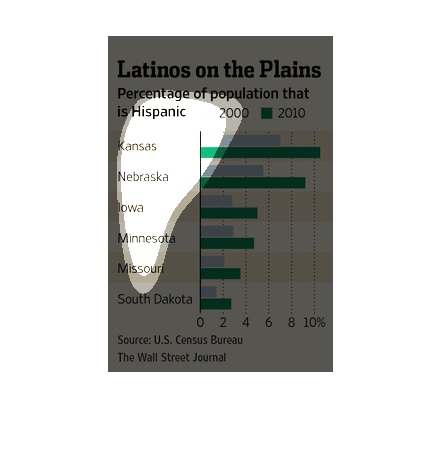
The figure presented to the left is titled Latinos on the Plains.  The figure is a representation
of the statistical data for percentage of Hispanic population.
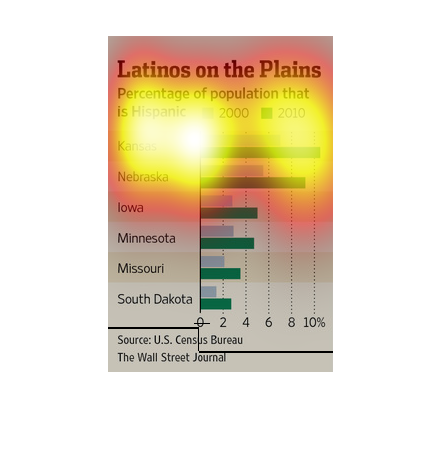
The plains have a set of a whole different kind of settlers ranging in those parts; Latinos.
In this study conducted by the Wall Street Journal we see that the population has increased
quite significantly from states like Kansas, South Dakota, Missouri
In this study conducted by the Wall Street Journal- from information obtained from the U.S
Census Bureau- we see that the rise of the Latinos in the plain states is on the rise.
The figure presented is titled Latinos on the Plains.  The figure is a representation of the
statistical data for percentage of population that is Hispanic.
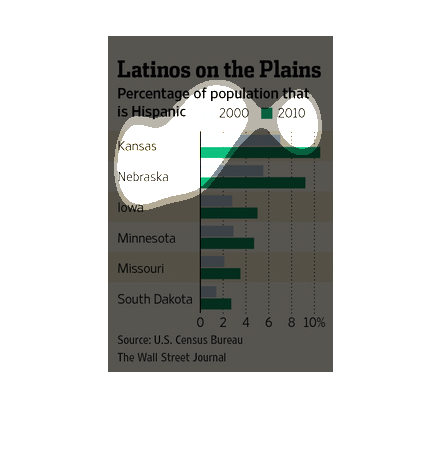
This image discusses the Hispanic population in the US midwest, like Nebraska, Iowa, and Kansas.
The latter has the highest percentage of Hispanics, at 10%. This can be read from the bar
chart for each of the states, which also reports growth of this population over a previous
year.
This chart from the Wall Street Journal shows how the latino and hispanic populations in the
midwestern plains states are increasing over time from 2000 to 2010