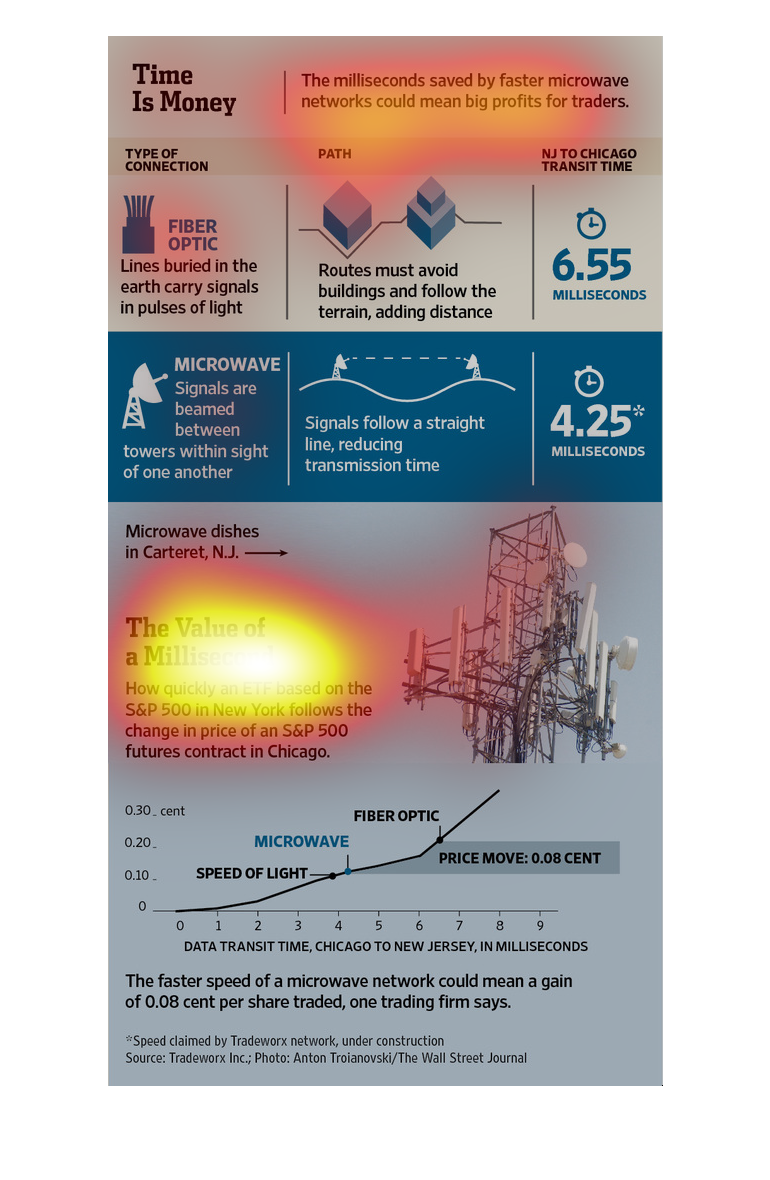
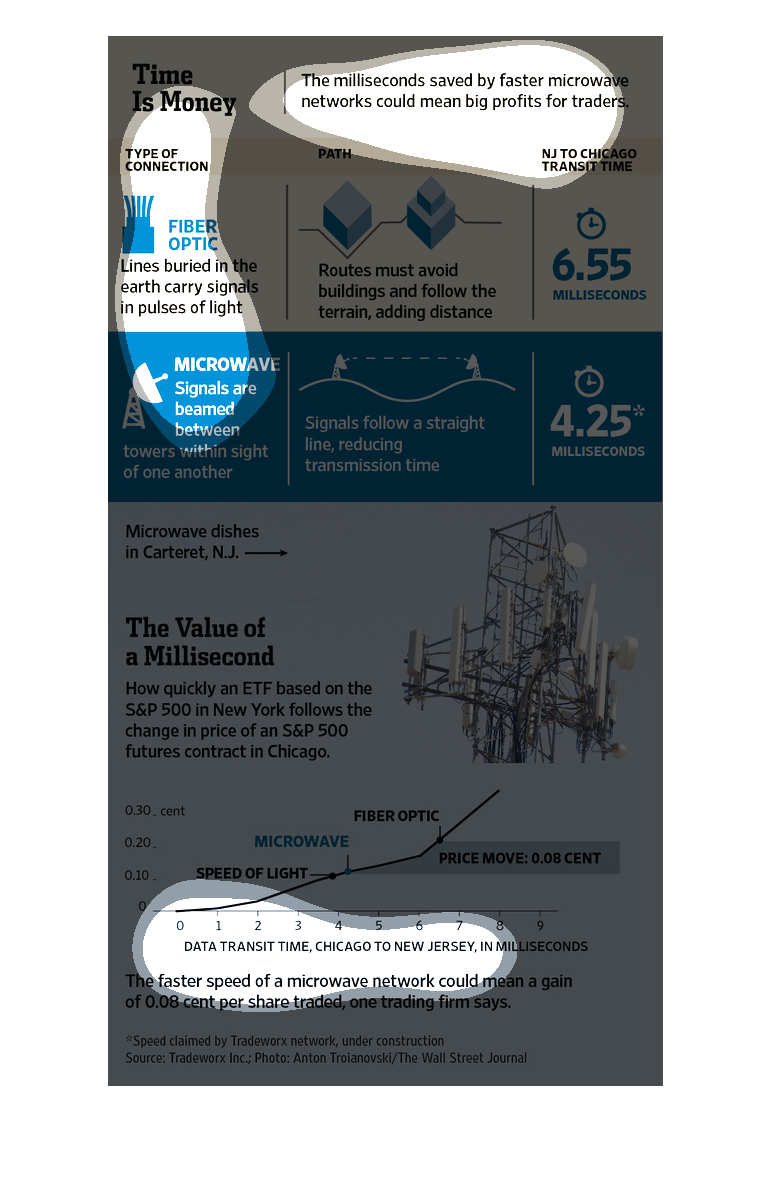
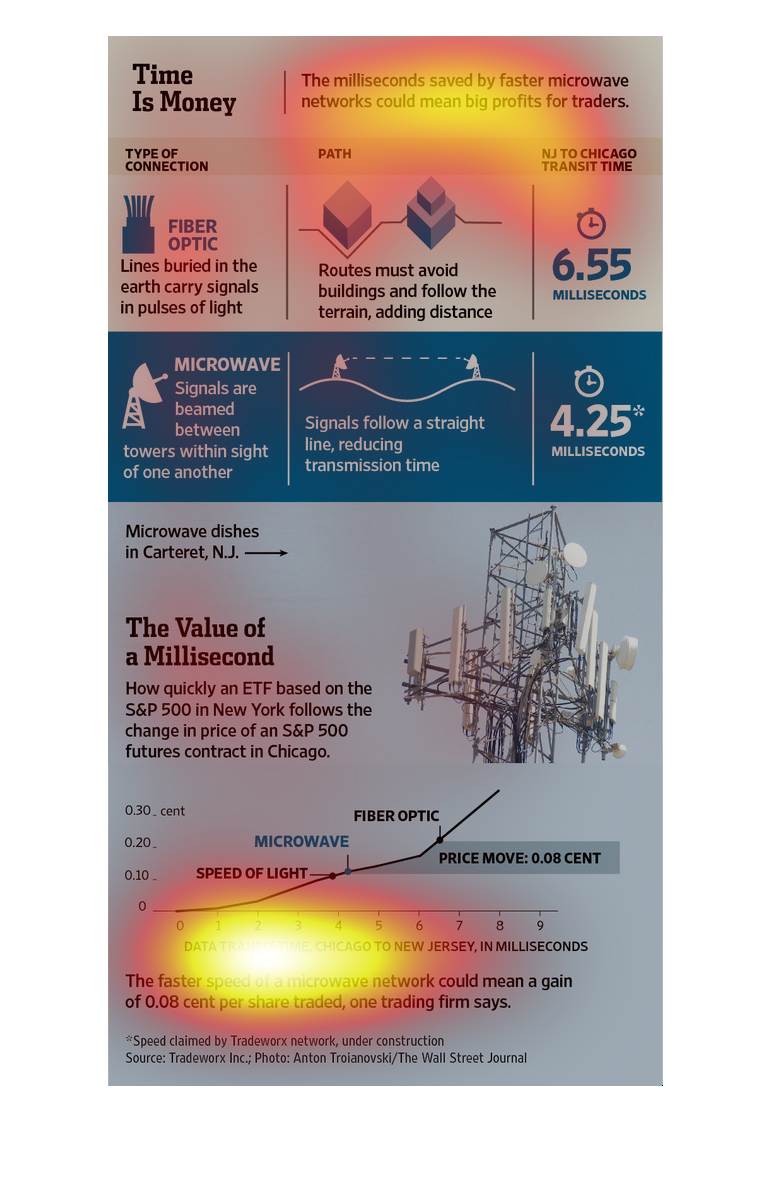
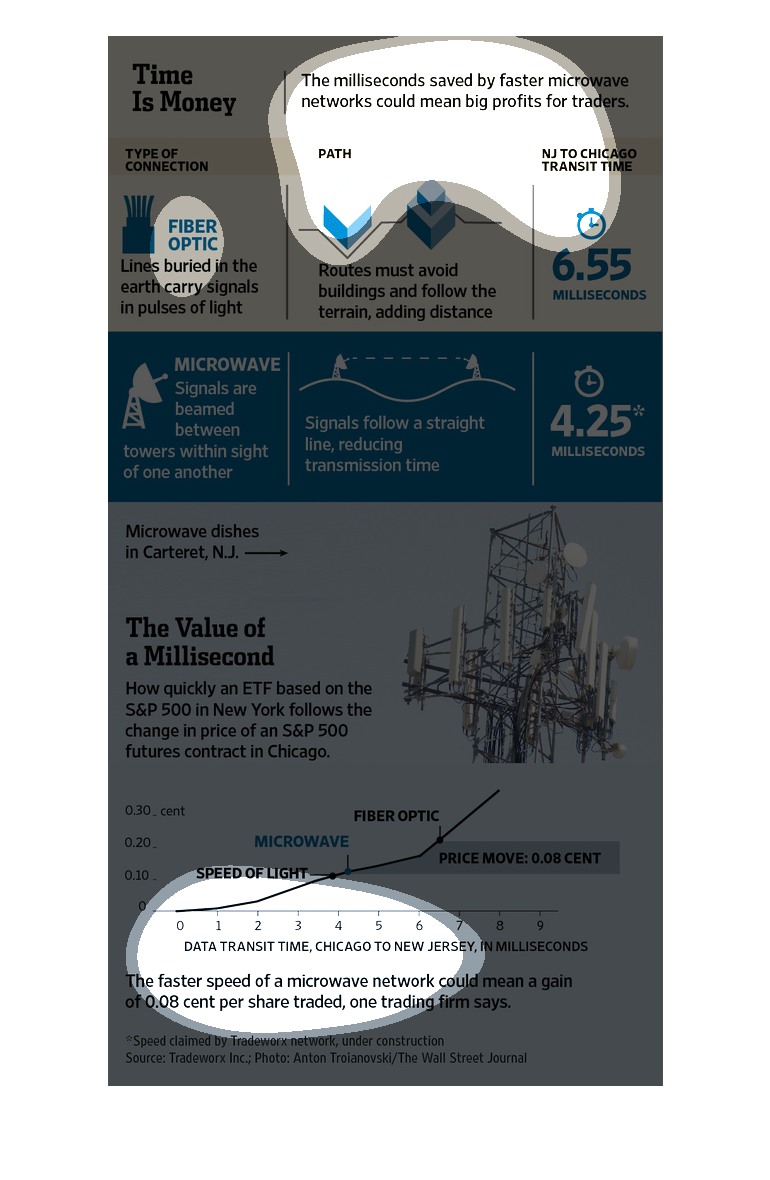
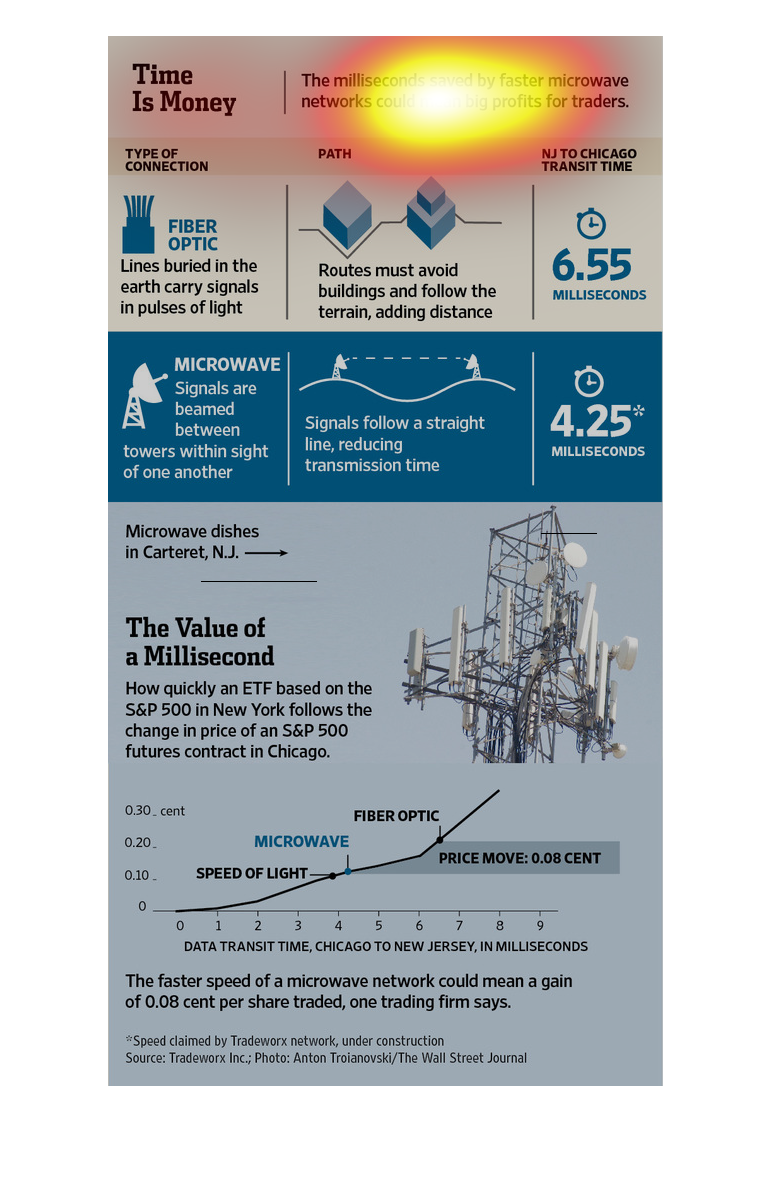
This shows that fiber optic cords that are delivering faster networks could equal huge profits
for traders.  IT details different types of connections, microwave networks, and the value
of a millisecond.
The image is describing the difference in milliseconds between a microwave network and a fiber
optic network and the pricing difference to increase speeds. Faster speeds of a microwave
network can show increase in shares traded.
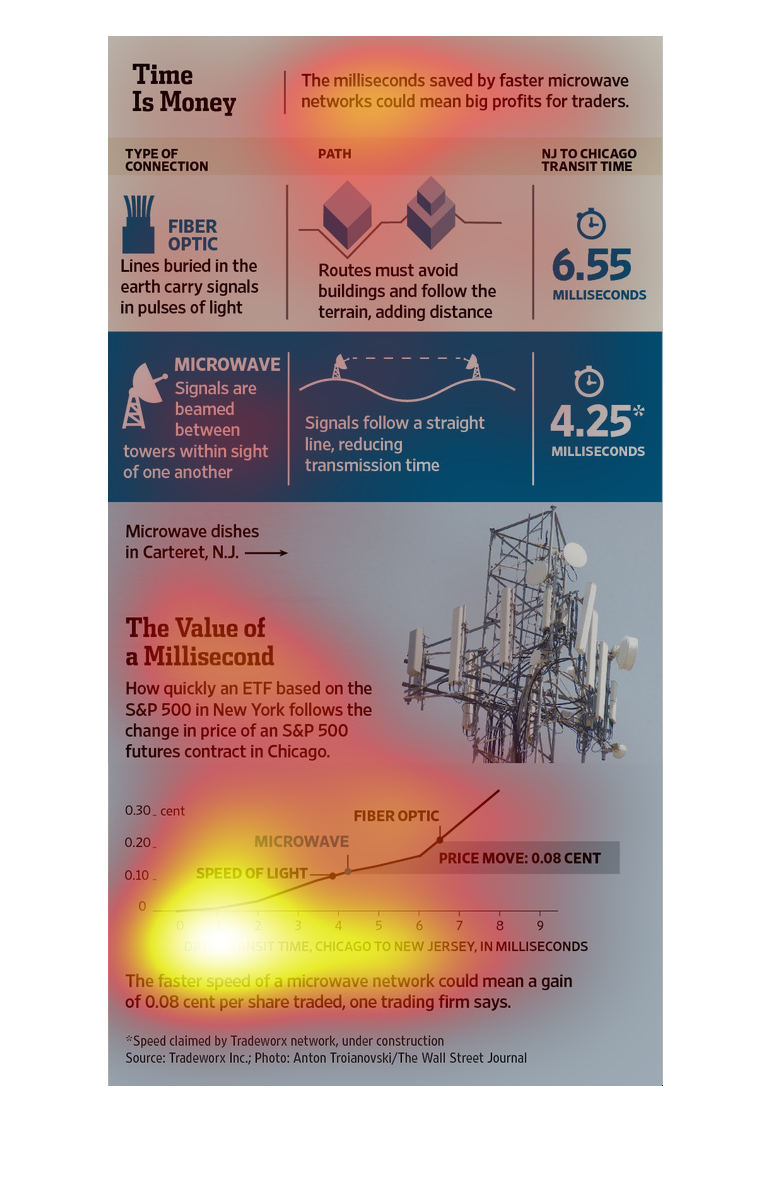
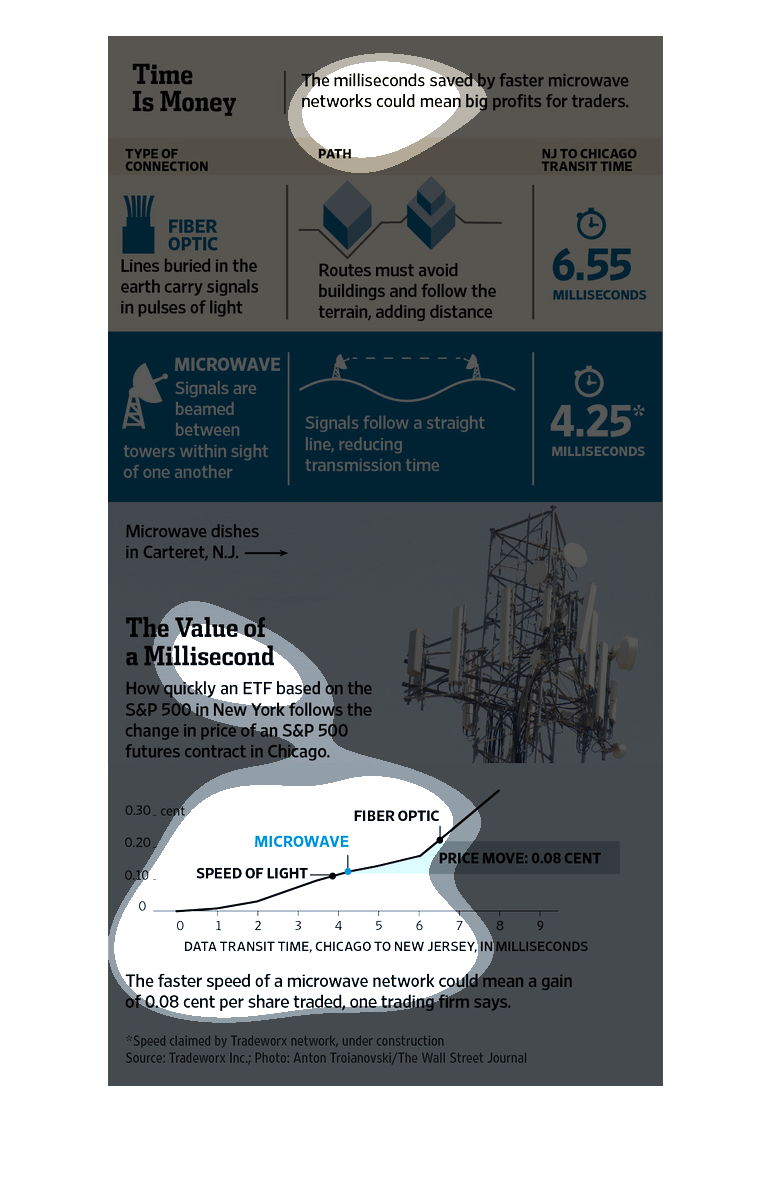
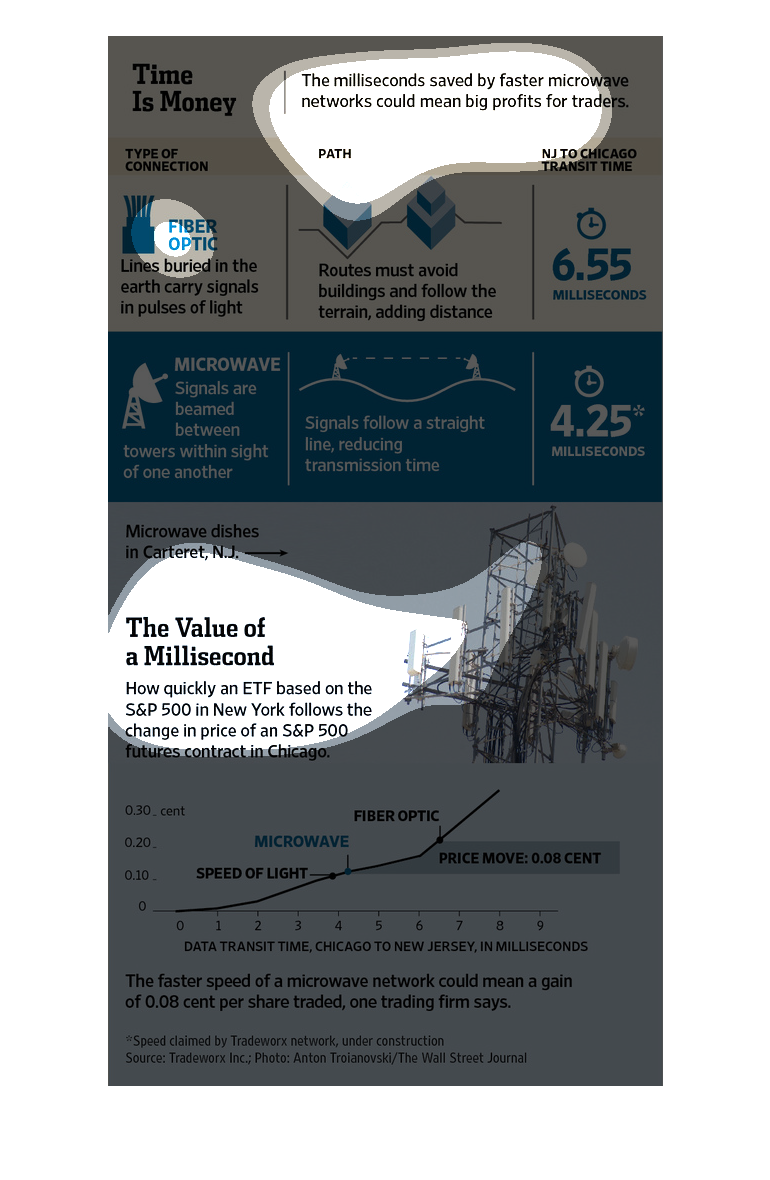
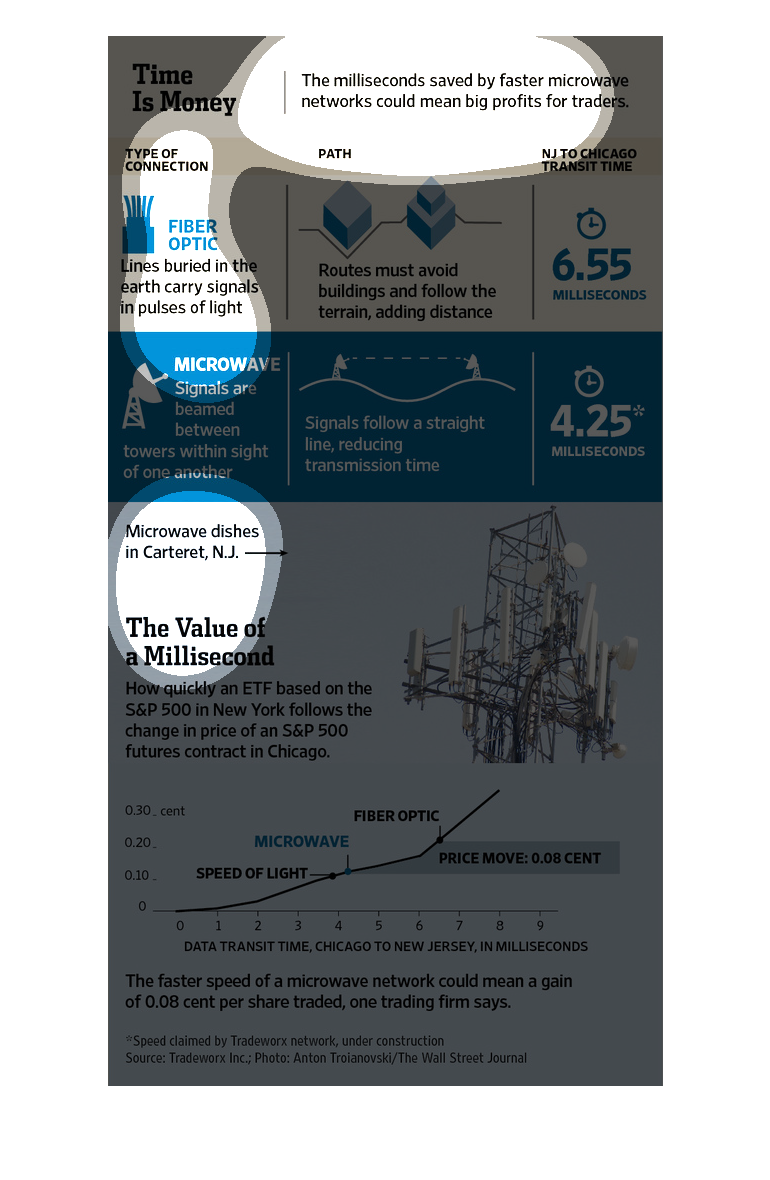
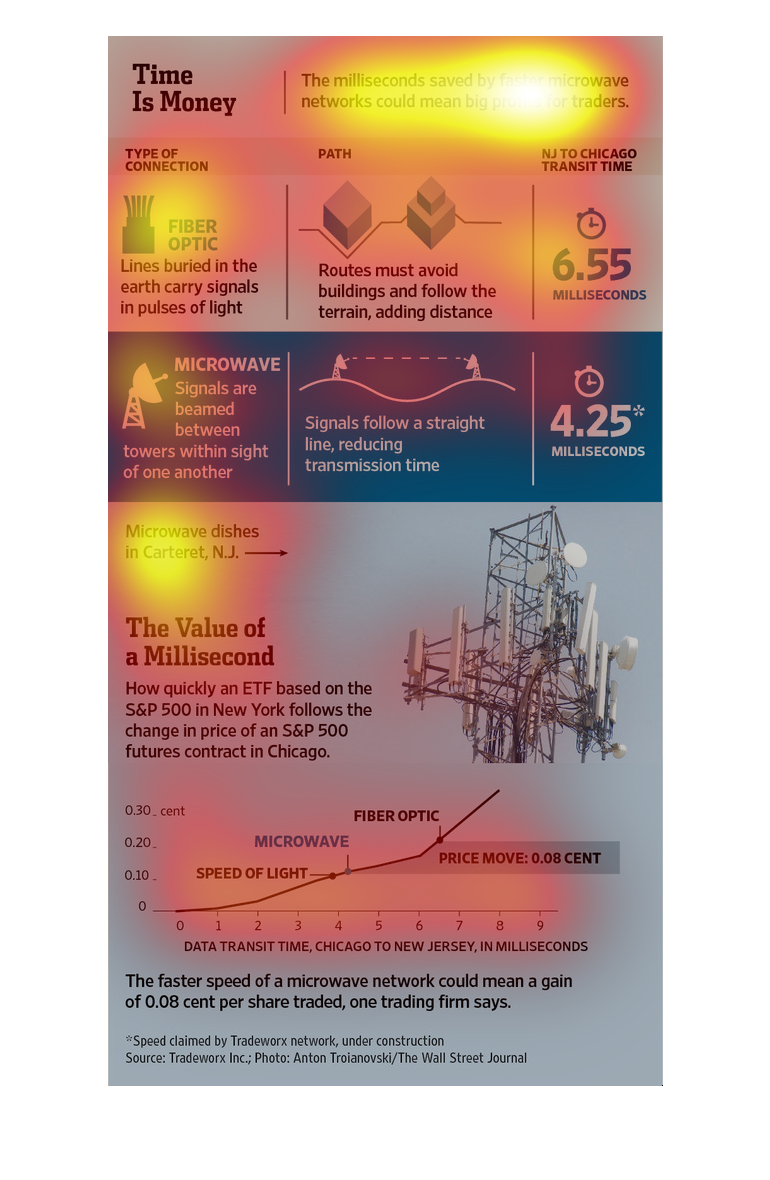
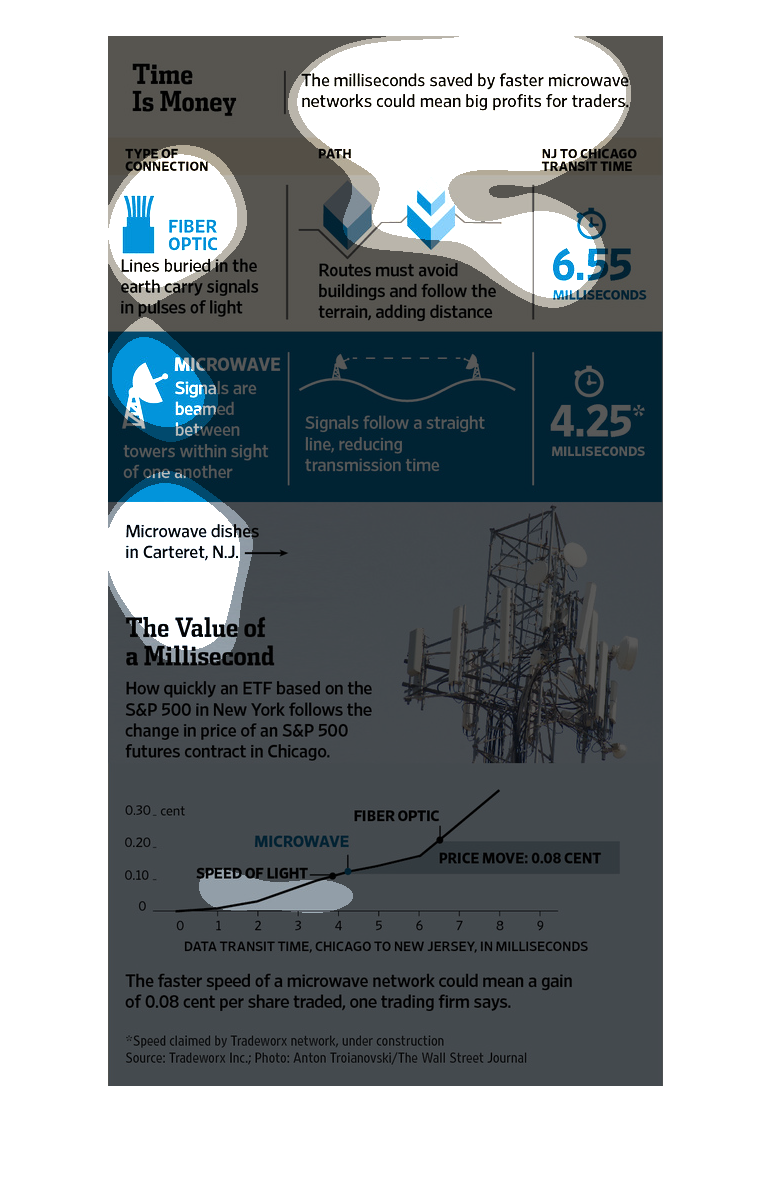
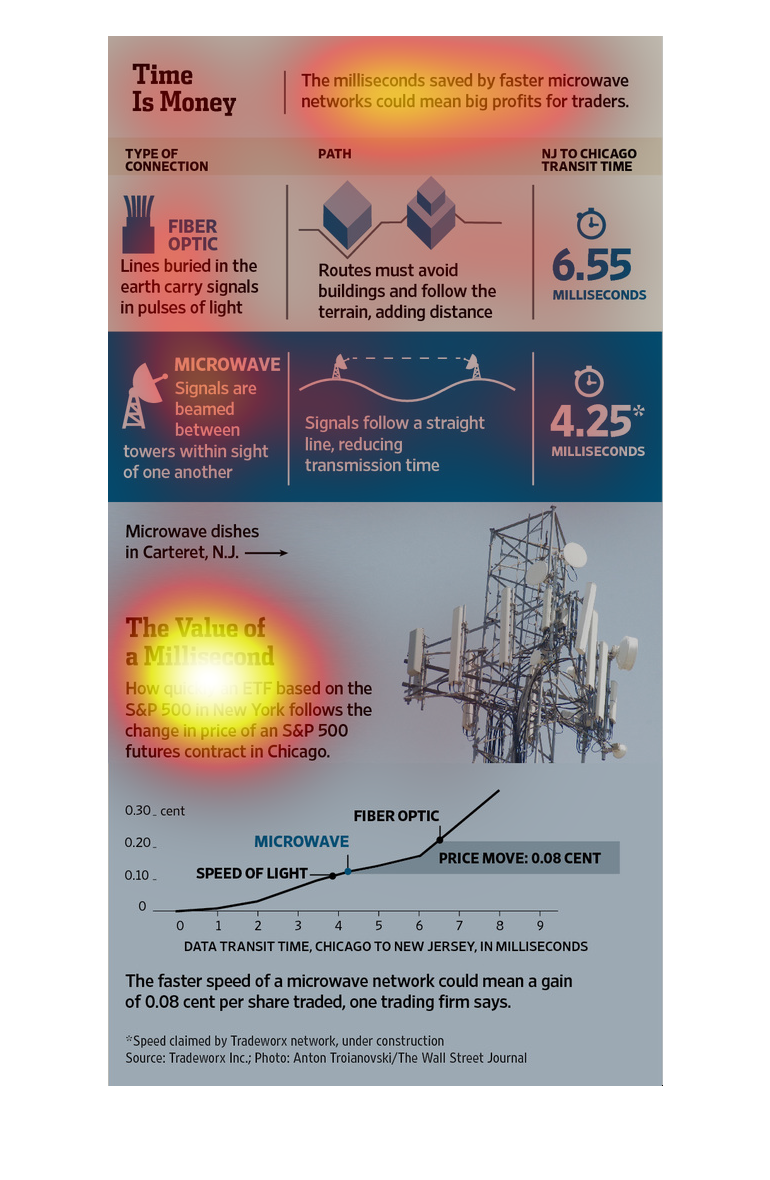
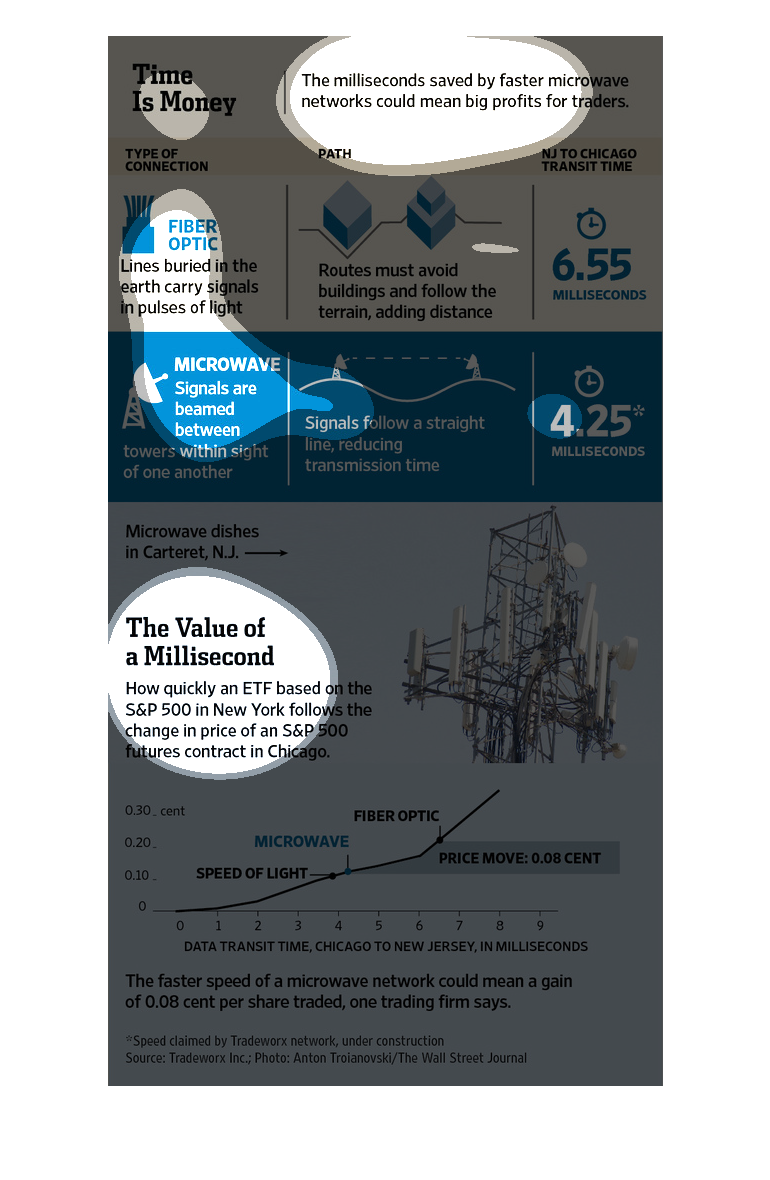
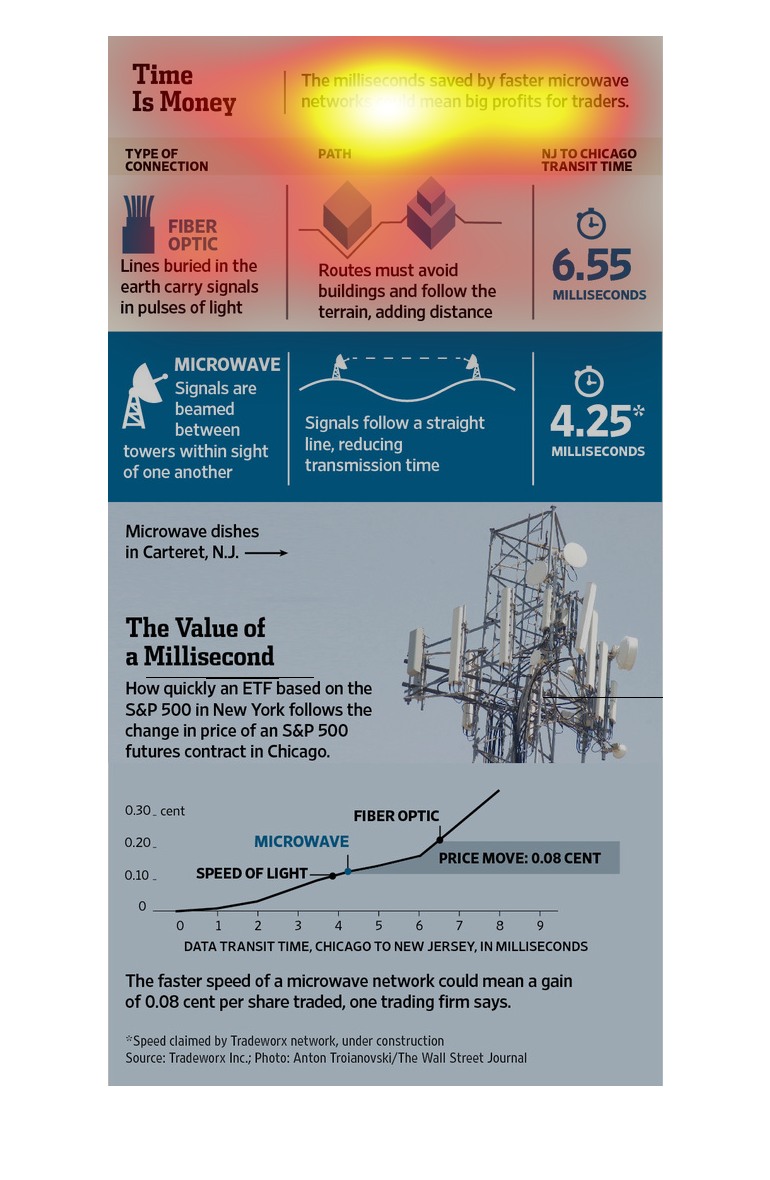
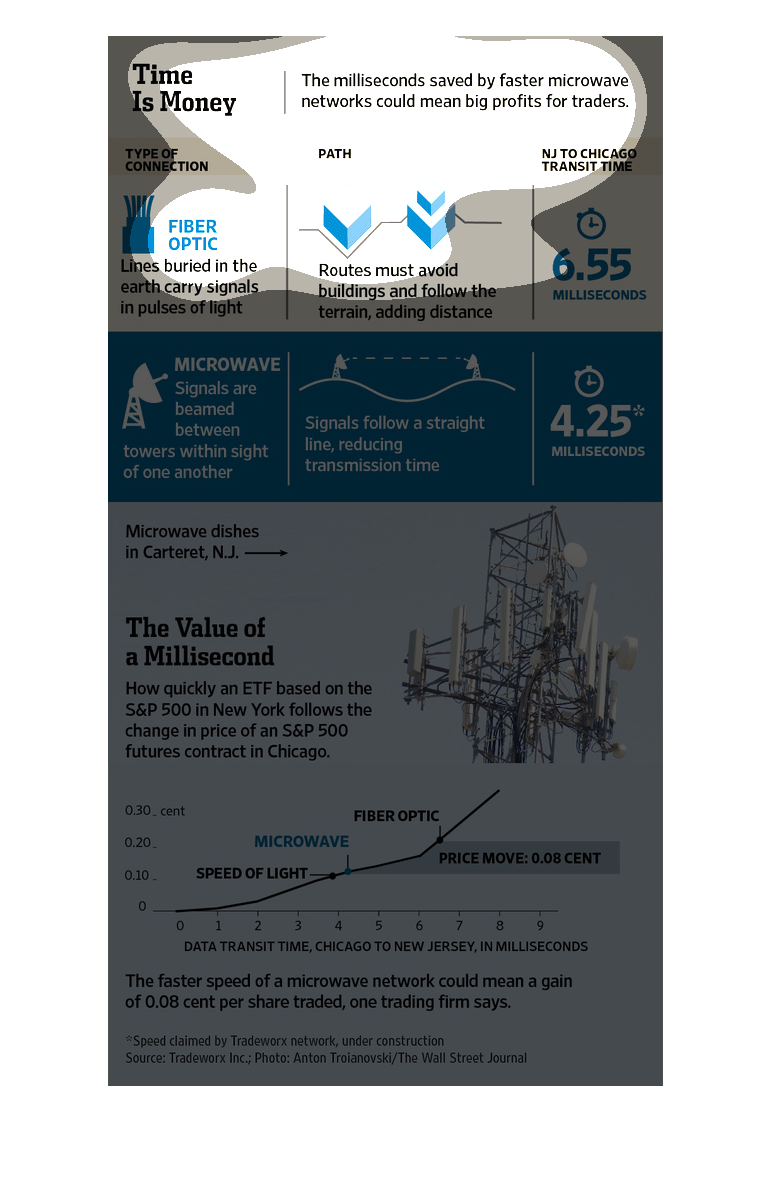
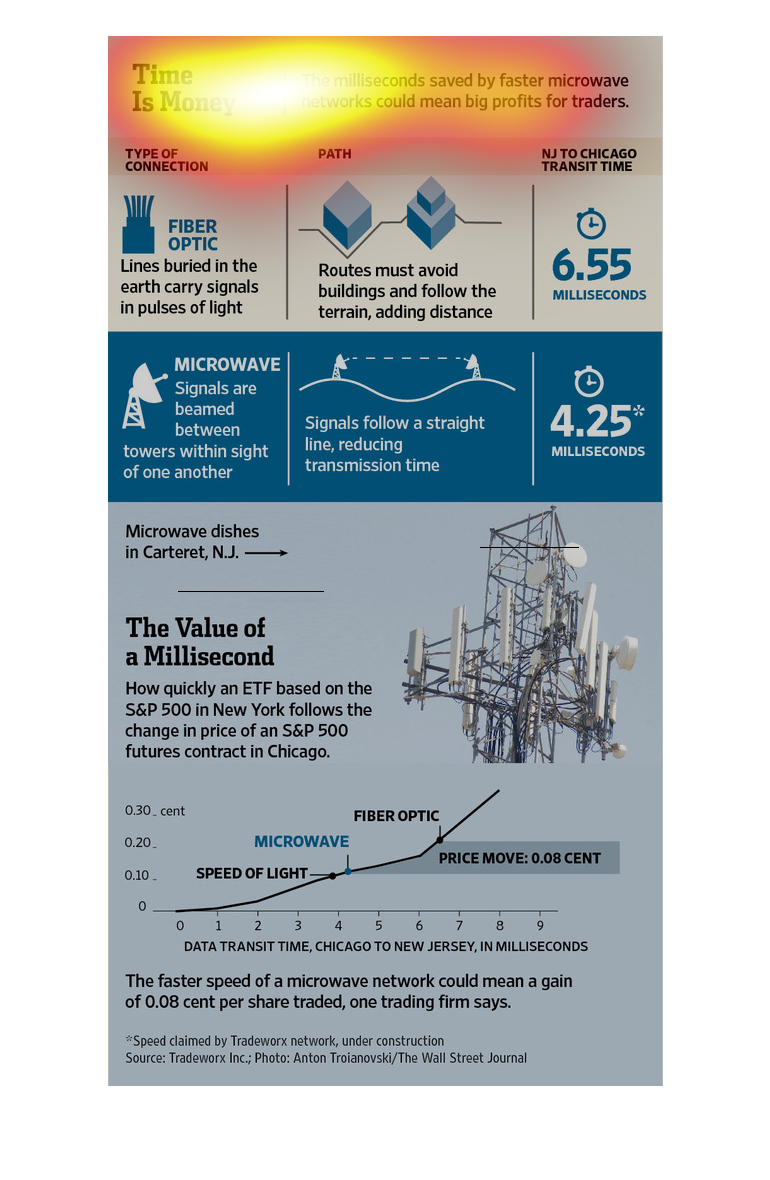
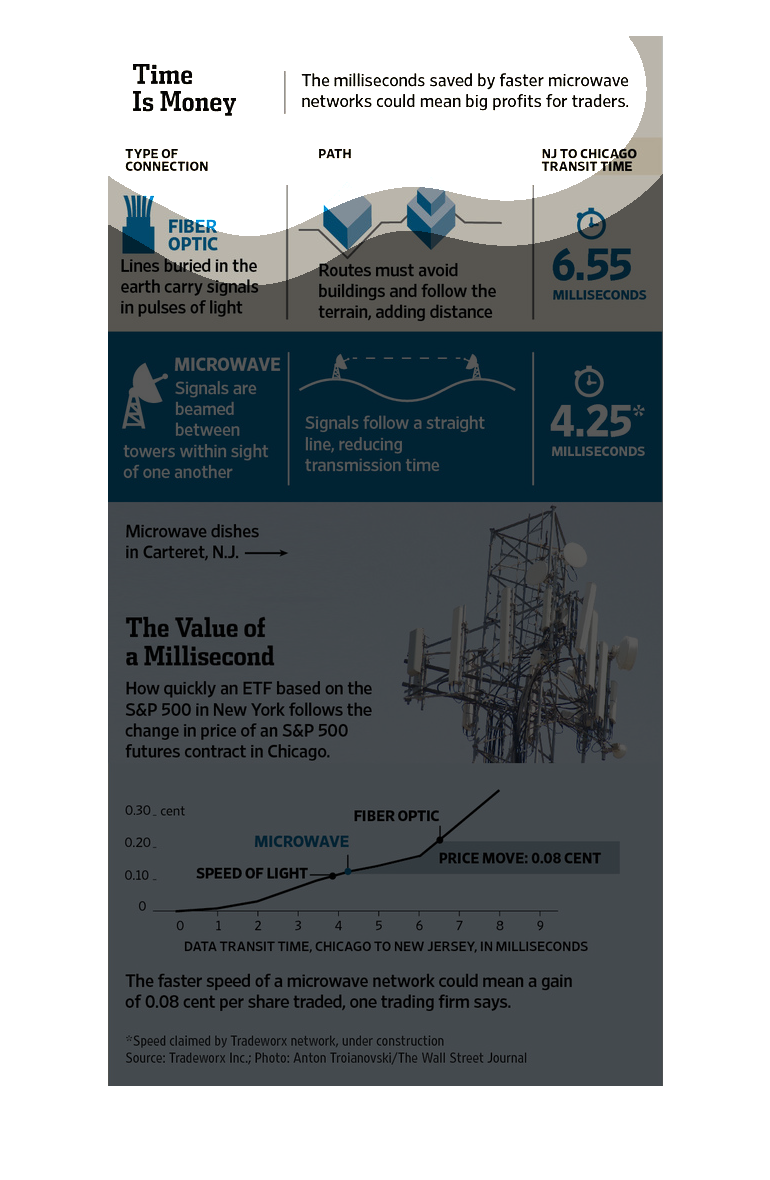
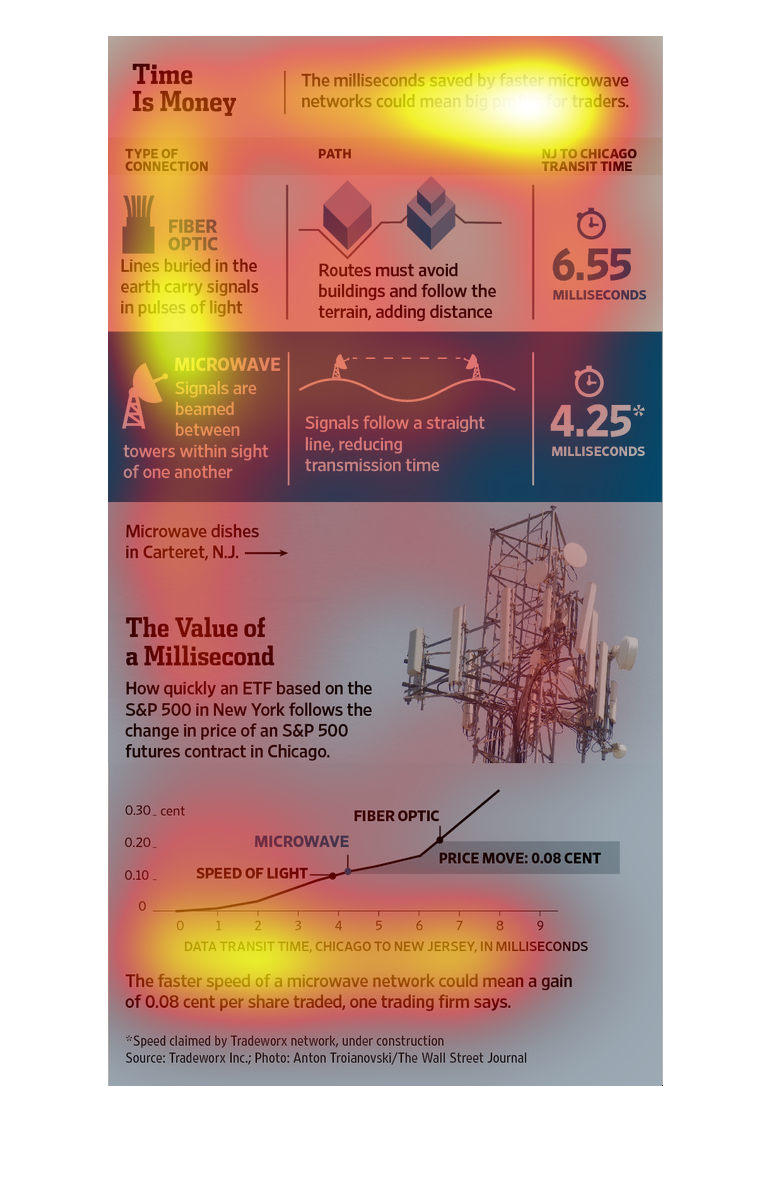
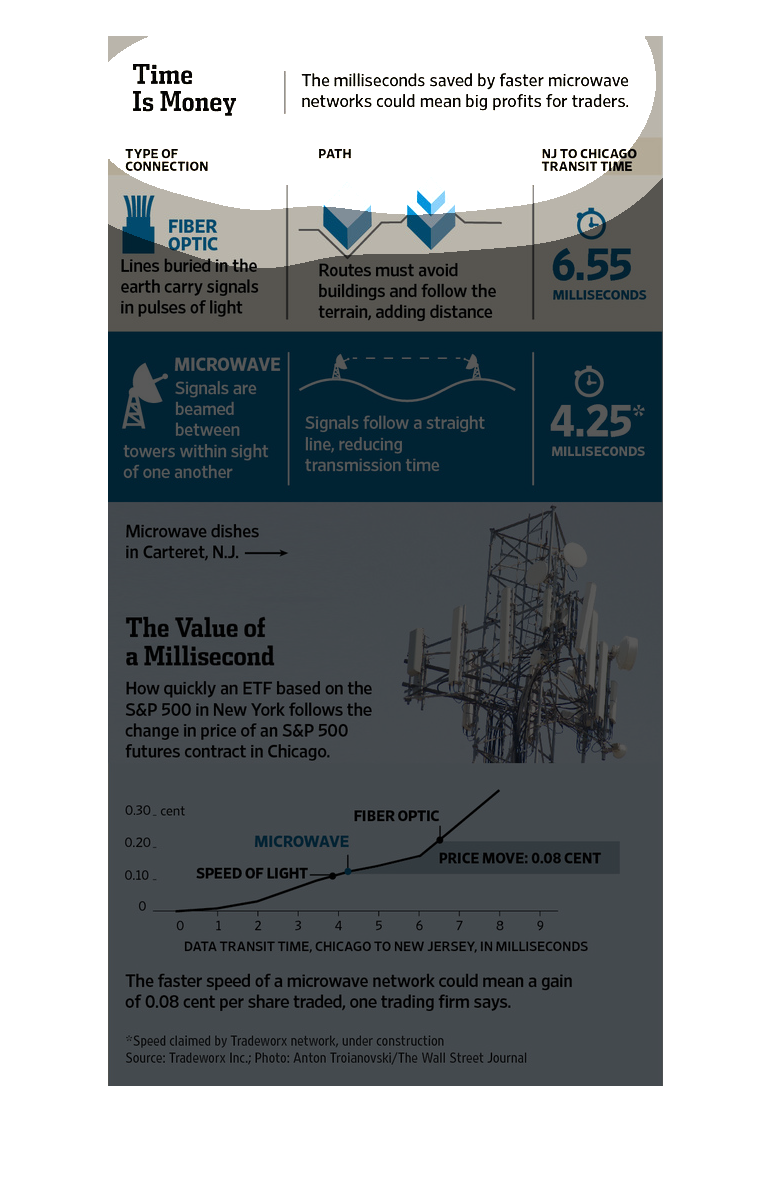
This is an infographic picture about saving money in trading stocks by using faster microwaves
networks. The picture shows how a fiber network works and how long it take to send information.
It then explains how a microwave network would have less obstacles for sending the information
and how it would show up faster. The graph at the bottom shows the data transit time from
Chicago to New Jersey for different types of network setups.
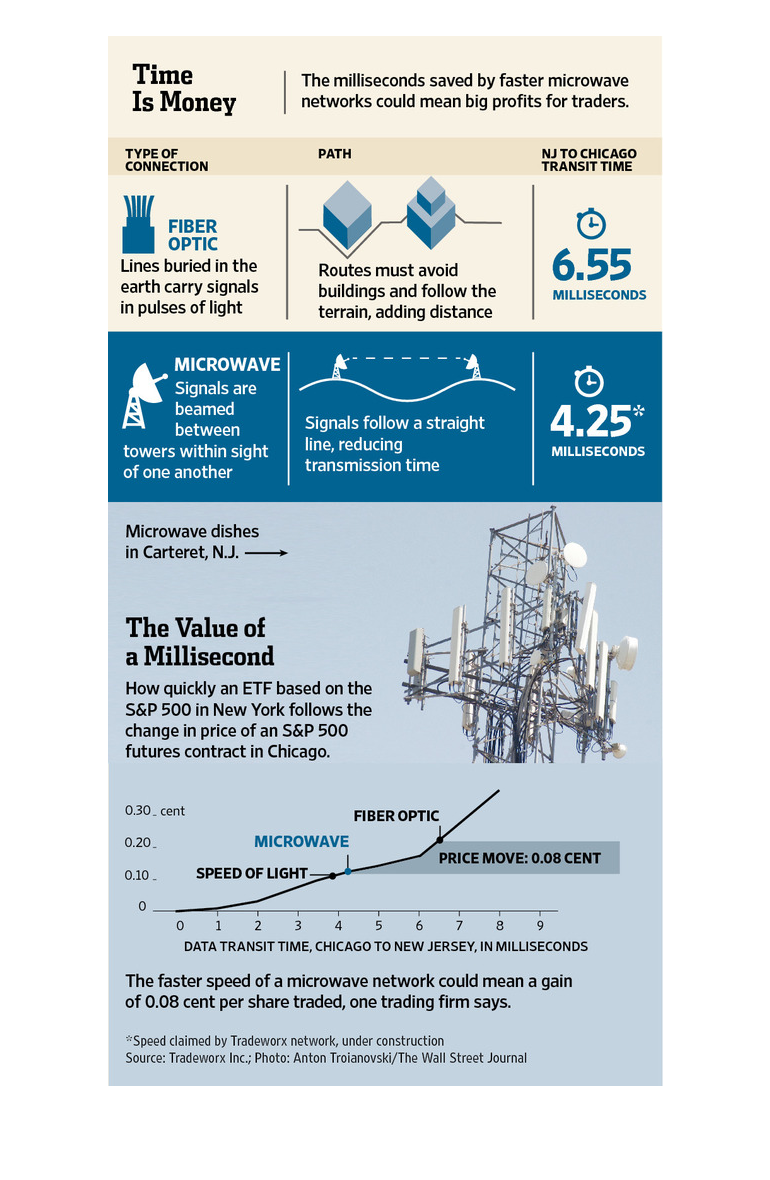
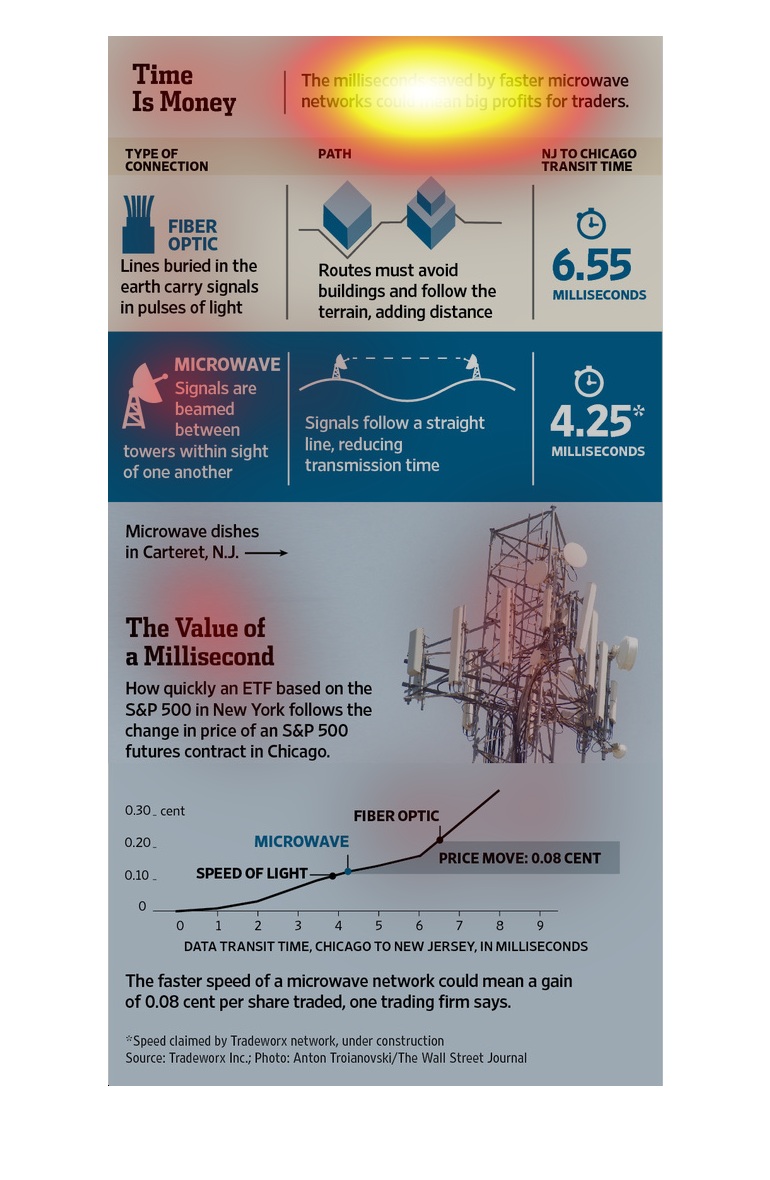
The image depicts the milliseconds saved by faster microwave networks possibly leading to
big profits for traders. The image describes the importance of signals delivery speeds and
evolution in technology enabling faster speeds.
This chart from the Wall Street Journal shows how high frequency (?) or other institutional
traders are making money because of faster networks and technology to make trades
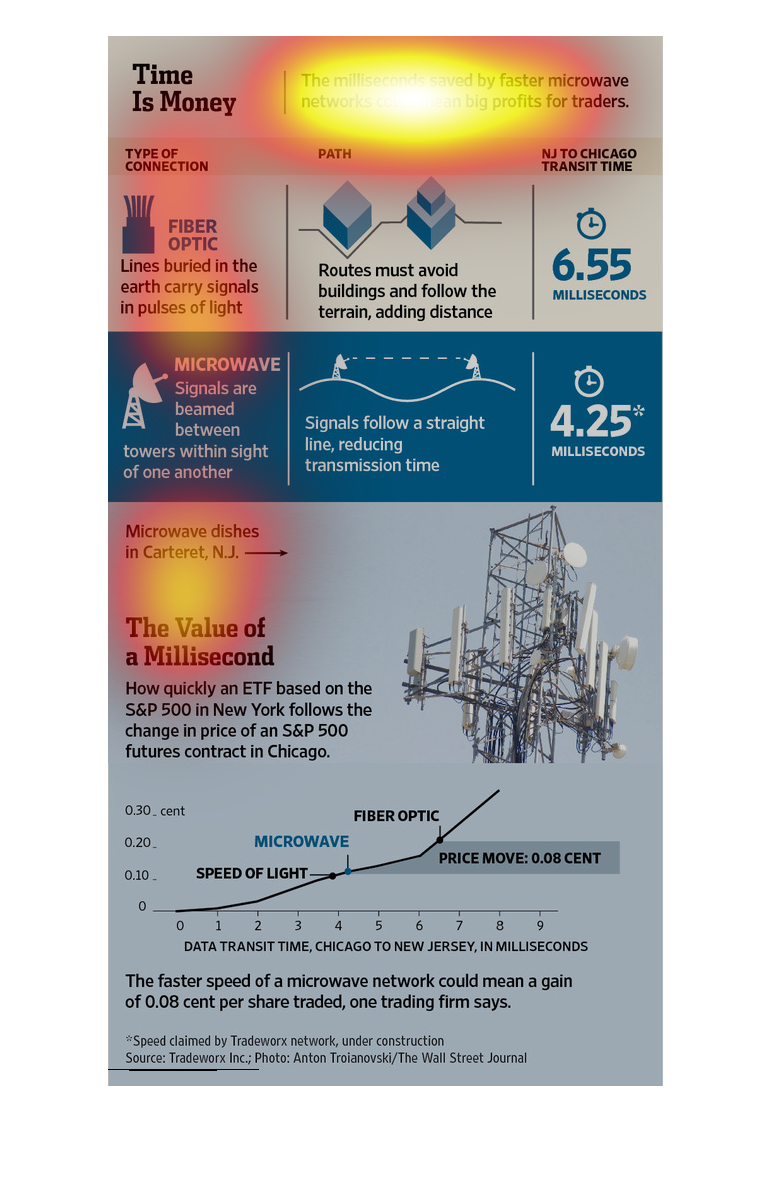
The figure presented to the left is titled Time is Money.  The figure is a representation
of the statistical research data for milliseconds saved for faster networks.
Infograph explaining how traders can make big profits with time saved from using faster microwaves
networks. The value of  millisecond could save 0.08 cents per share trader.
The image depicts the milliseconds saved by faster microwave networks as being profitable
for traders. The faster technology advances, the more benefits traders see from higher stock
prices.
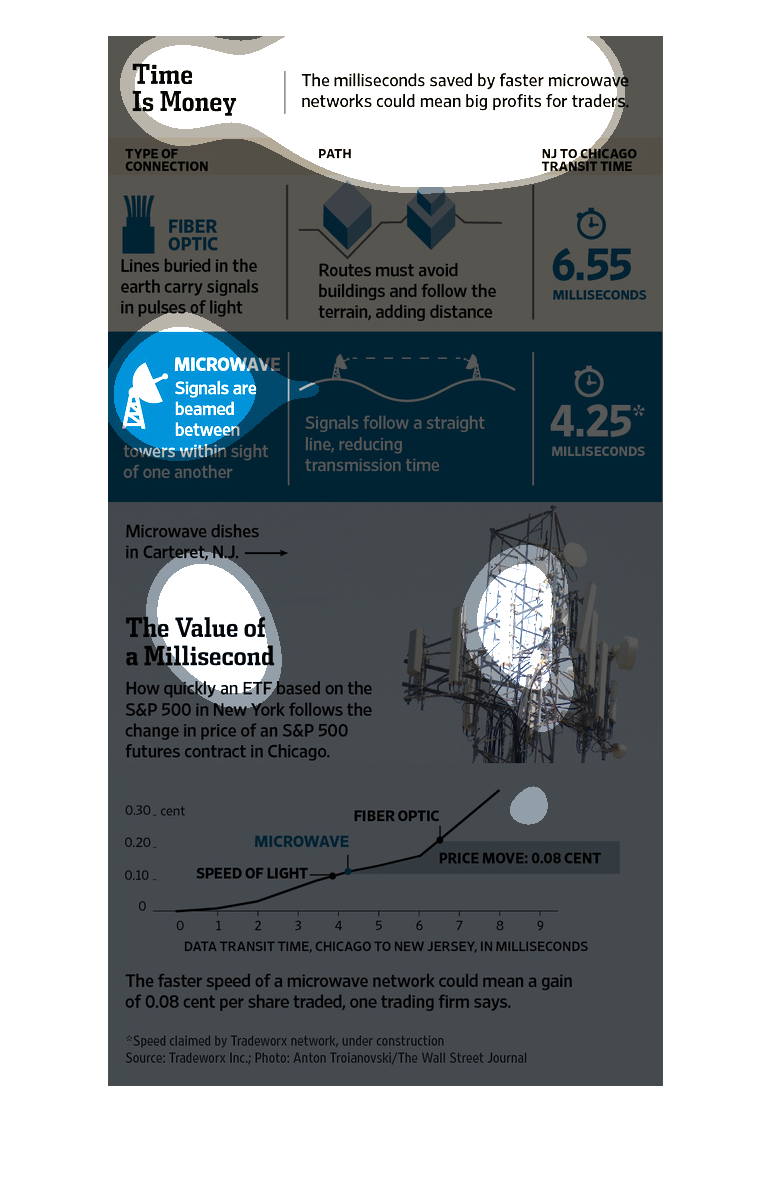
This is a graphic that is mean to illustrate the amount of milliseconds that are actually
saved by faster microwave networks and this could mean big profits for traders.
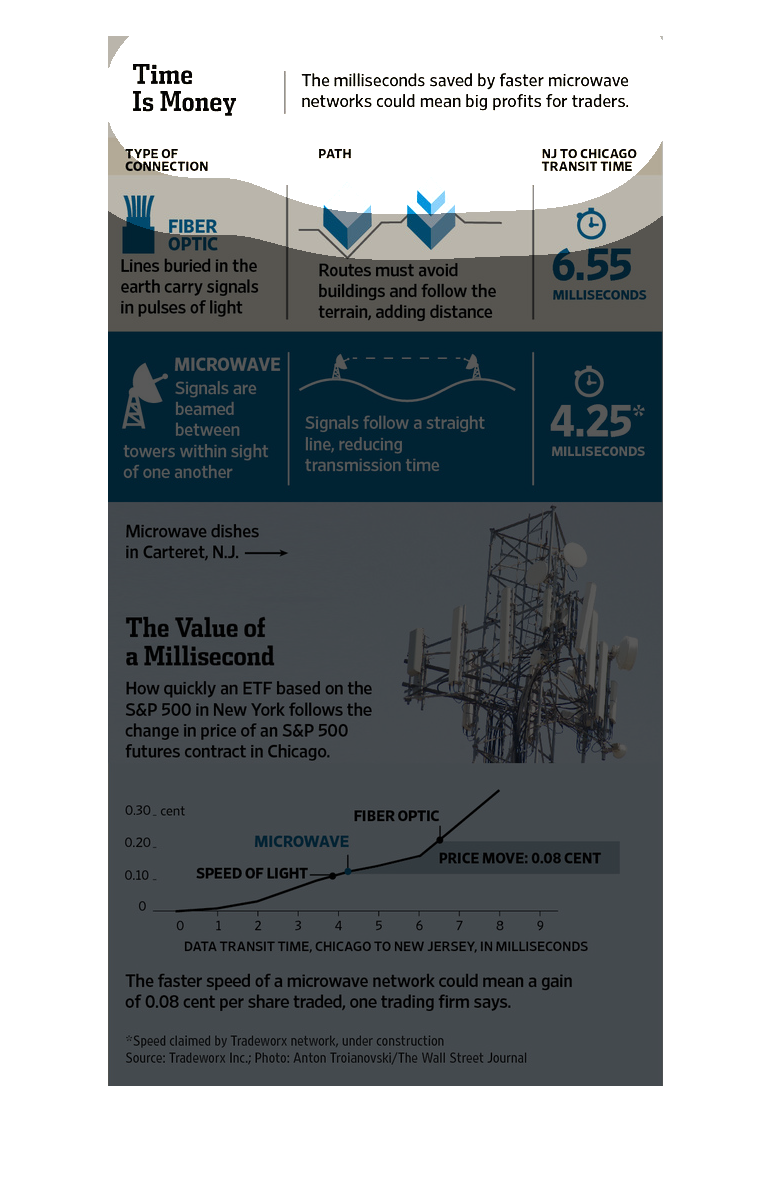
Microwave network speed could make traders big money. Fiber optic lines from NJ to Chicago
would be only 6.5 milliseconds, meanwhile microwave is 4.25 milliseconds. Th chart states
the difference could mean a  "0.08 cent per share" gain per share traded.
This chart describes and depicts the potential advantages and profits that could be made by
companies if milliseconds of time could be saved by faster microwaves.
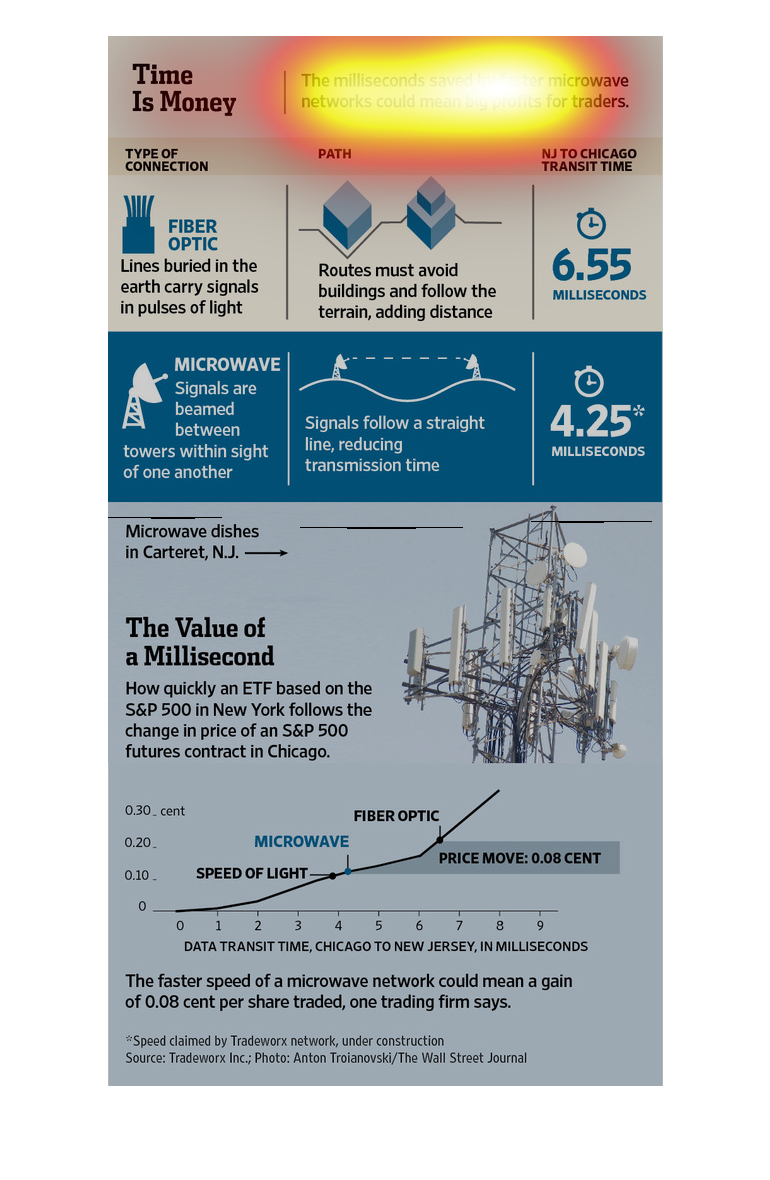
This chart from the Wall Street Journal shows how high frequency and other institutional traders
are beefing up their technological infrastructure to increase trade speeds
This image looks at the impact on time savings in better microwave (fiber optic) transactions
for stock traders.  There is an illustrative picture, of a wifi anteanea system. And surrounding
facts in text which examine the impact of millesecond savings on electronic funds transfers
(EFT) for traders.