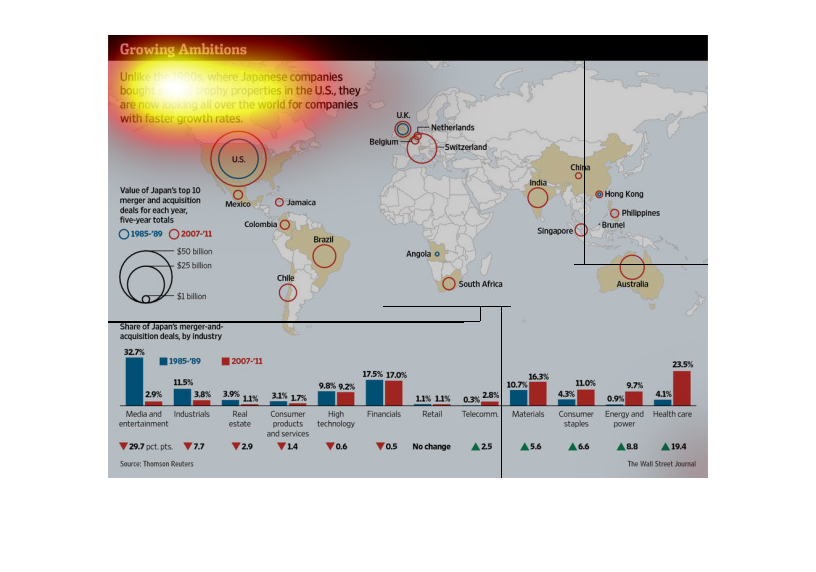
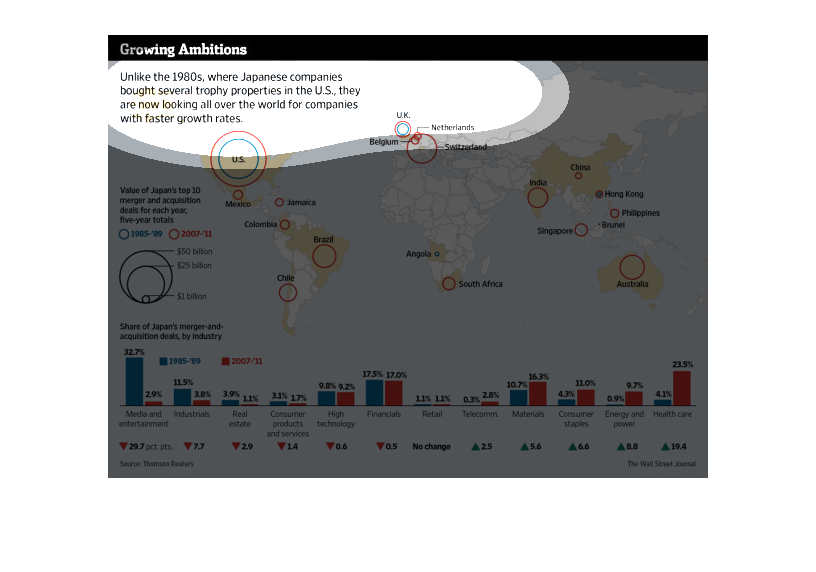
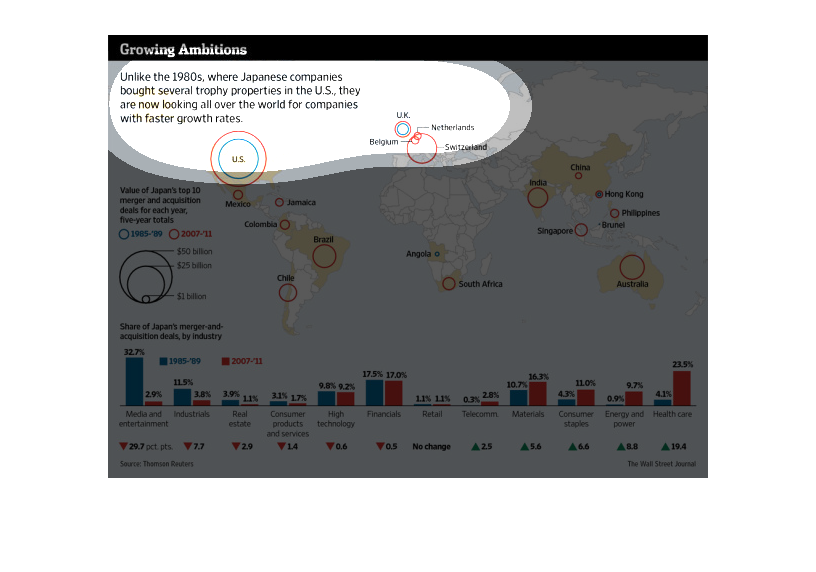
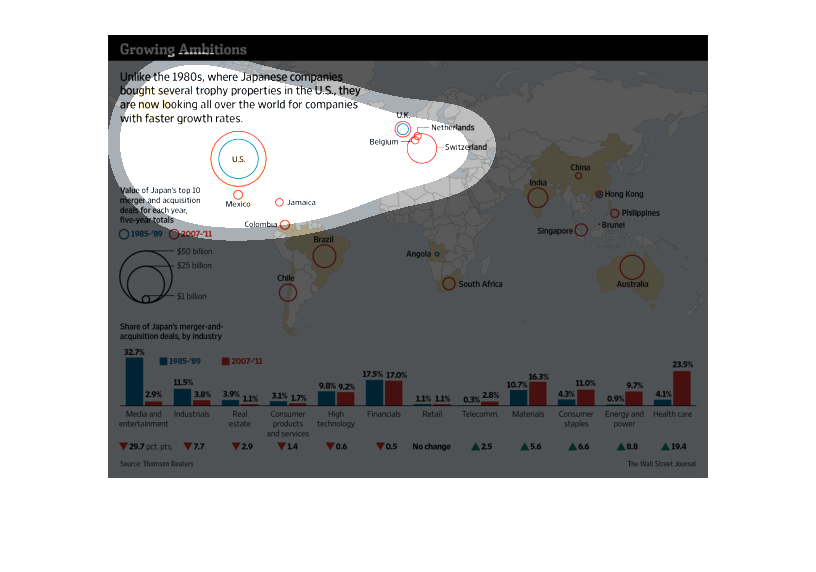
The image depicts how Japanese companies are looking to acquire trophy properties from all
around the world, as opposed to the 1980's when Japanese companies looked primary to the US
when headhunting. Growth rates are cited as the reasoning behind this evolution.
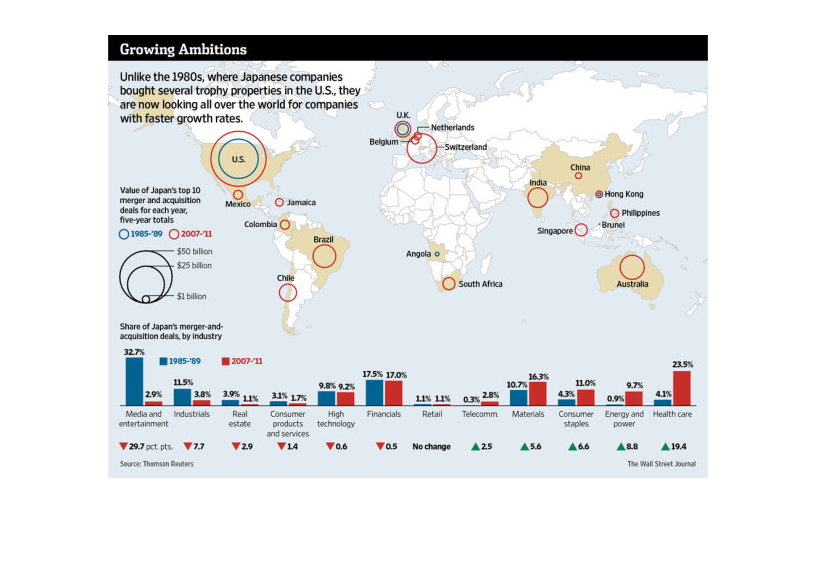
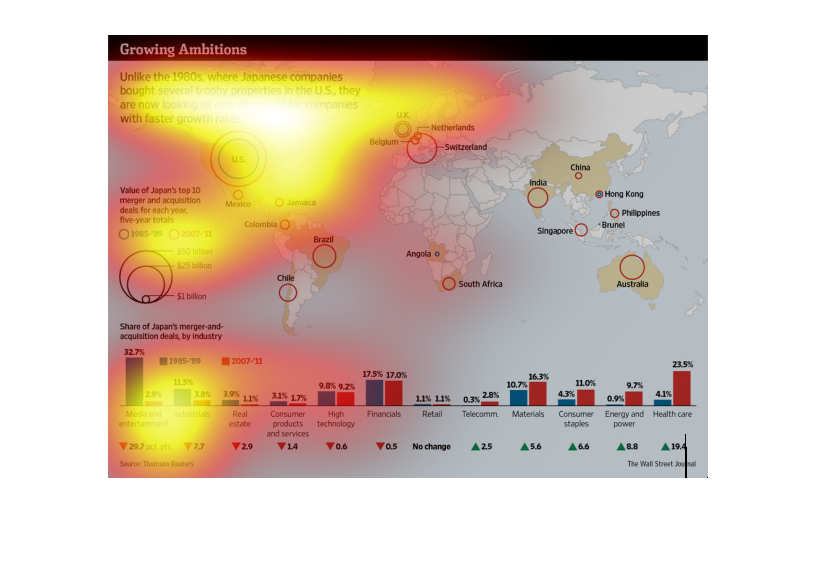
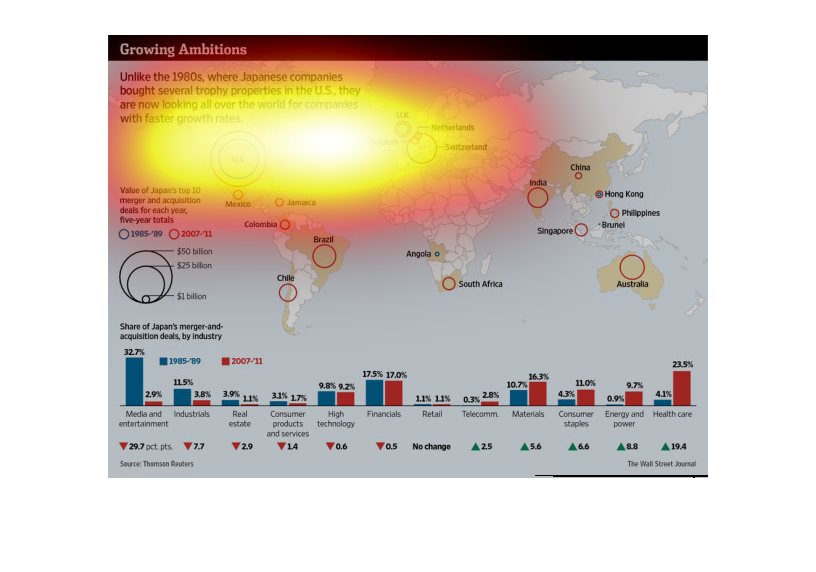
This chart from the Wall Street Journal shows how japanese companies and investors are investing
heavily in real estate around the world and not just in the United states
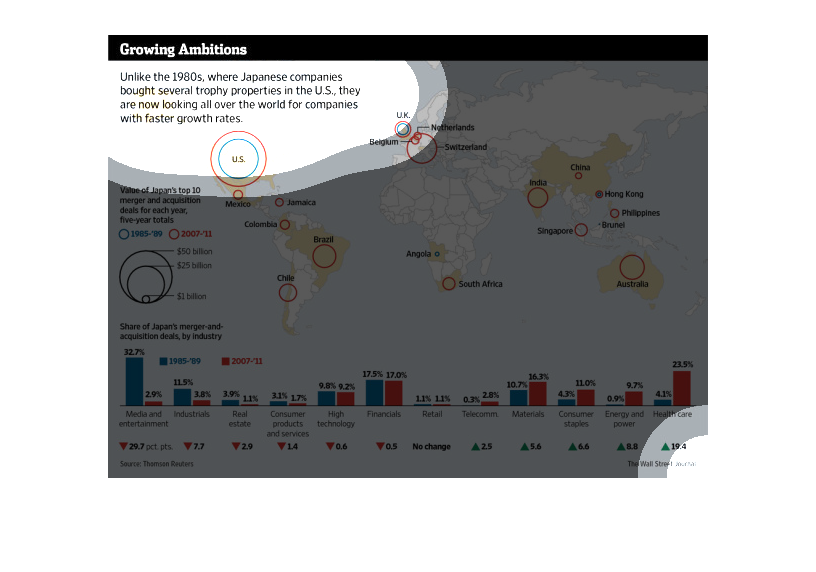
This is a graph that is being used to illustrate that unlike in the 1980s, when Japanese companies
bought several trophy properties in the United States, they are now looking elsewhere.
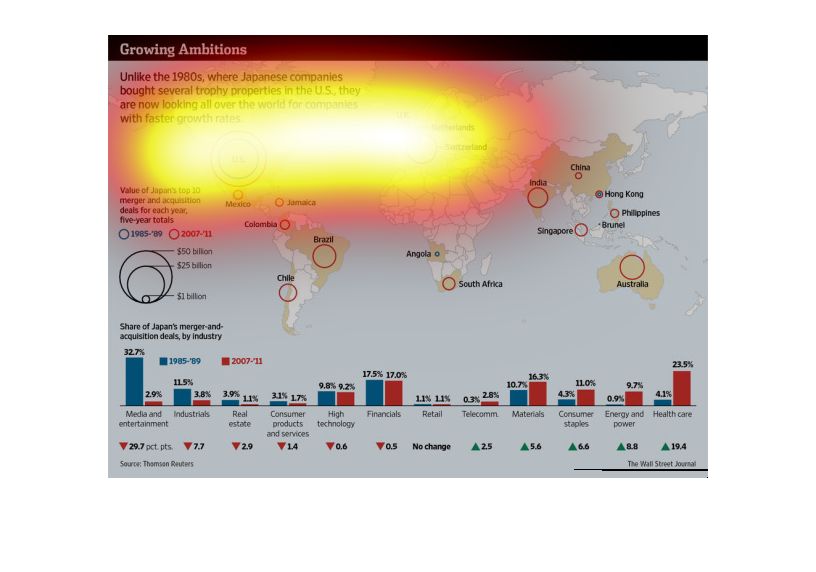
This image shows or depicts in statistical bar graph and World Geographic formats information
concerning Japan's growing ambitions to find or look for companies around the world to produce
faster growth for their economy.
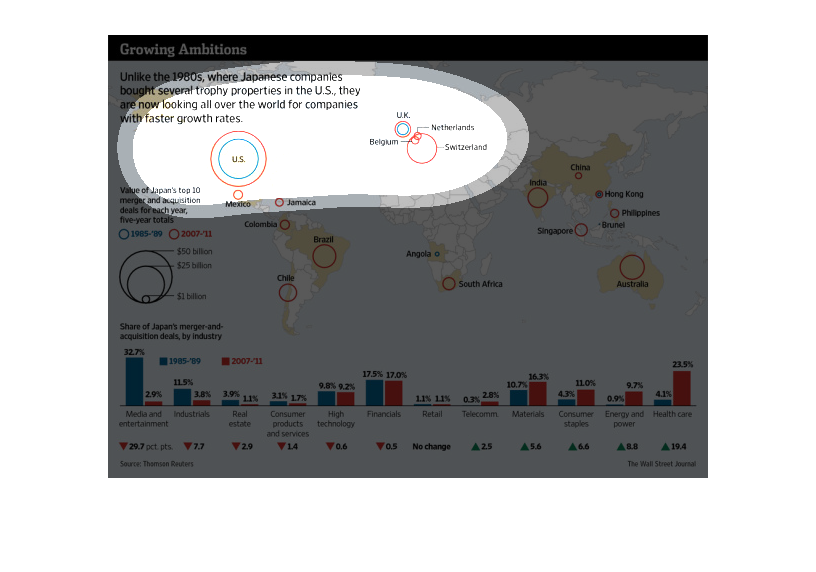
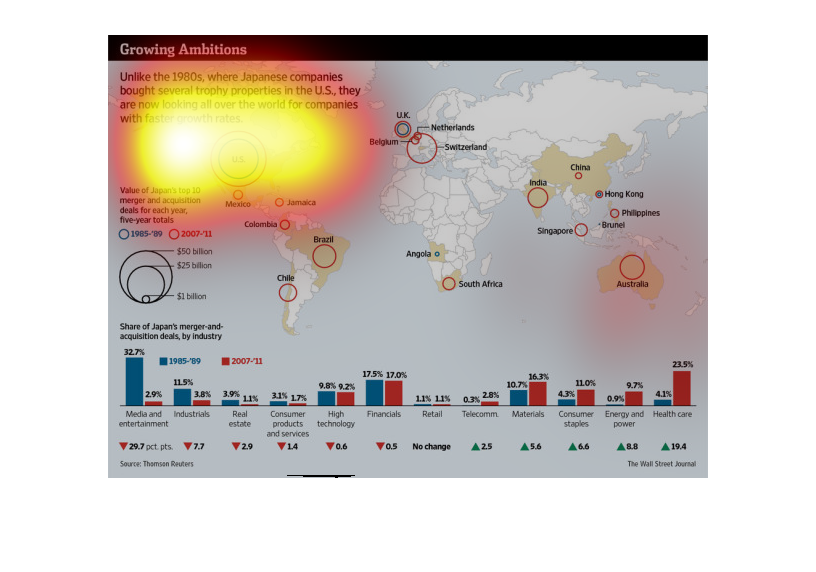
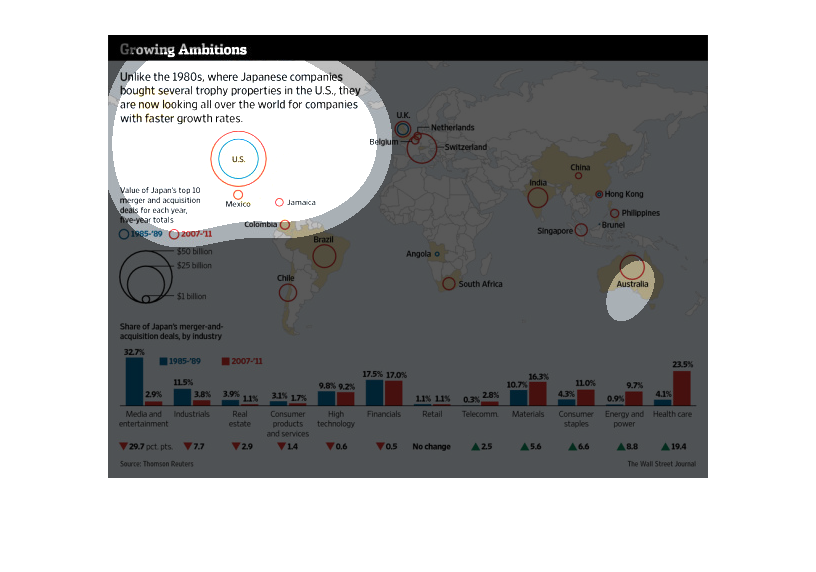
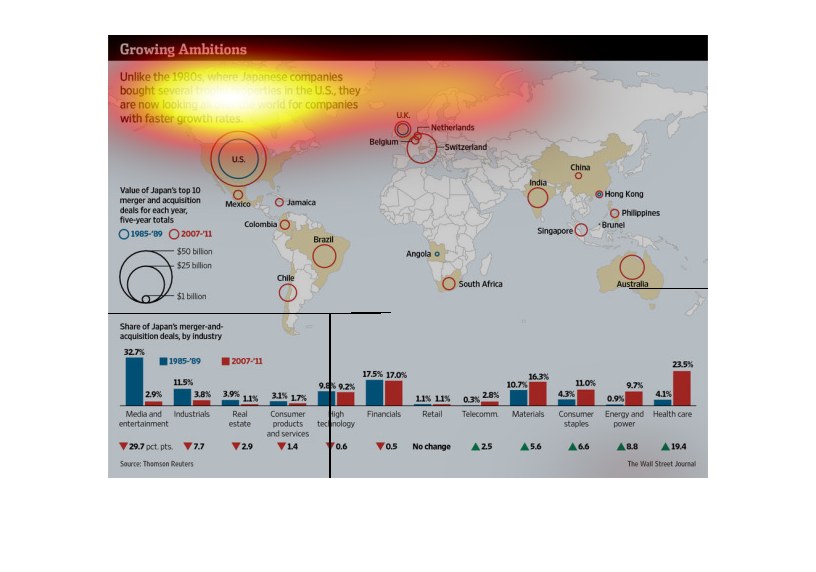
Japan is looking for countries with faster growth rates. In the middle, there is a map of
the world with circles indicating the value of the mergers. Then on the bottom, it shows many
bar graphs about the share of Japan's merger-and-acquisition deals by industry.
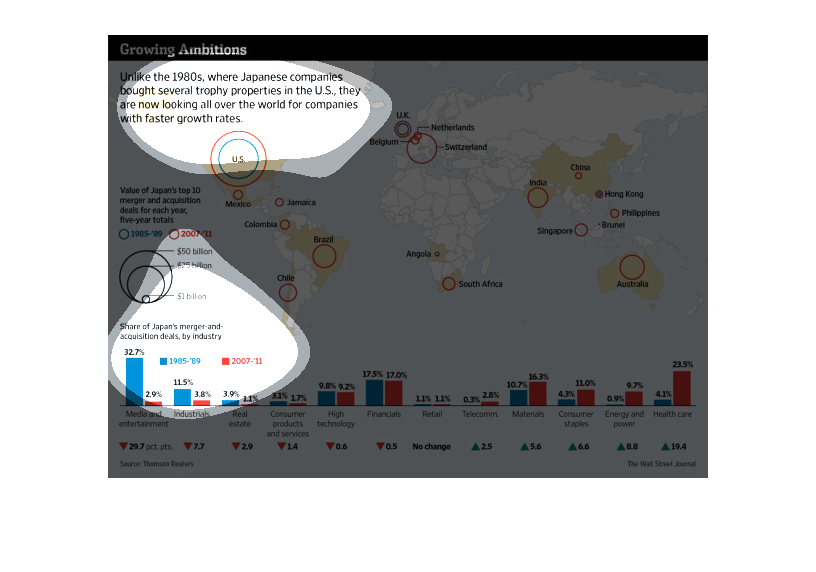
This world map shows, in colored circles, where japanese companies invested in worldwide.
One colored circle represents their 1985-1989 worth, and a proportional circle represents
their worth in 2007 after being acquired. Below is a series of graphs showing japanese market
share, by category.
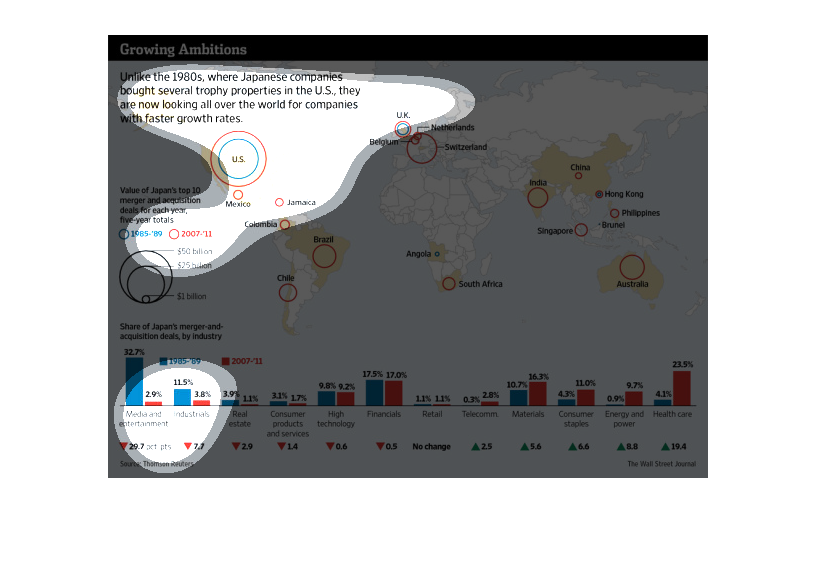
This chart describes and depicts how the country of Japan is now looking to buy whole companies
in countries with faster growing rates, unlike in the 1980's.
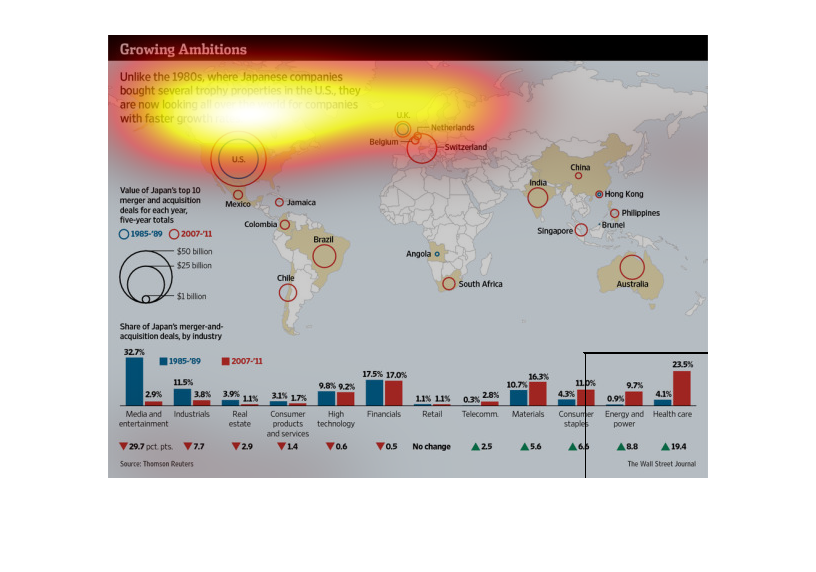
The figure presented to the left is titled Growing ambitions.  The figure is a representation
of the statistical data for Japanese companies buying several US properties.
This chart from the Wall Street Journal shows how the Japanese are more ambitious and willing
to invest overseas in companies and real estate around the world
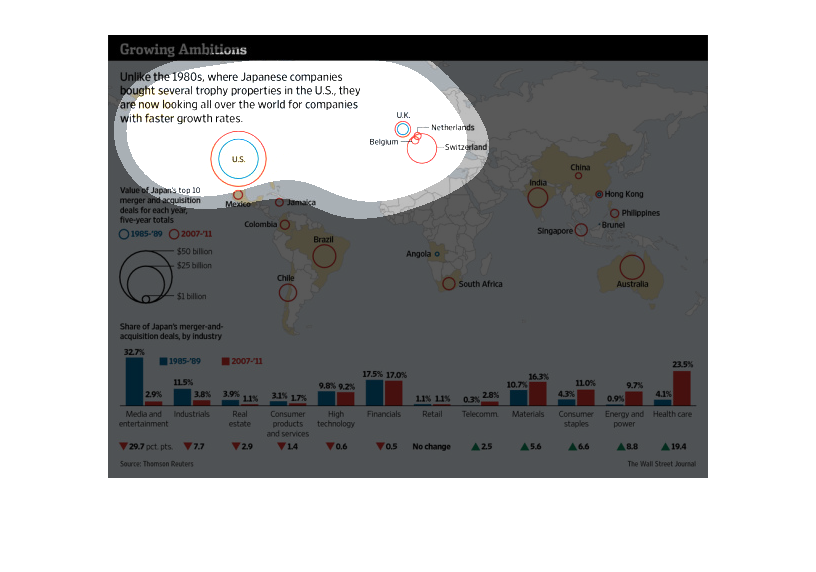
This image is of a world map and discusses how Japan, which once just bought companies in
the US during the 1980s, now buys all over the world.  This includes in the UK, in Brazil,
and in Australia.  A bar chart also shows a greater focus today on financial, consumer and
materials firms, where before it was more in sectors like media and entertainment.
This image shows a map of where many Japanese investor are seeking to invest their money across
the world, rather than just in the United States as they have previously.
This chart titled "Growing Ambitions" shows that Japanese bought several trophy properties
in the 1980's but they are now looking for companies all over the world with faster growth
rates.
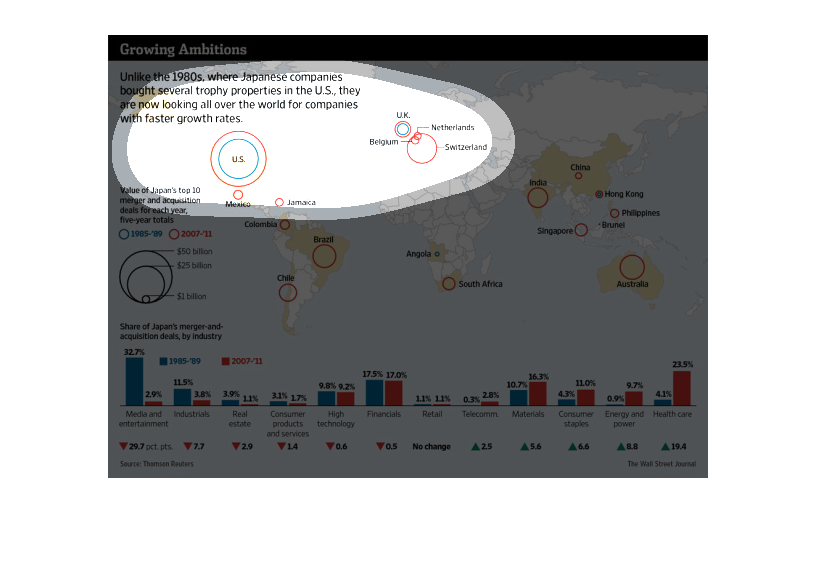
This chart describes growing ambitions. Specifically, unlike the 1980s where Japanese companies
bought several trophy properties. Different categories are represented by different colors.