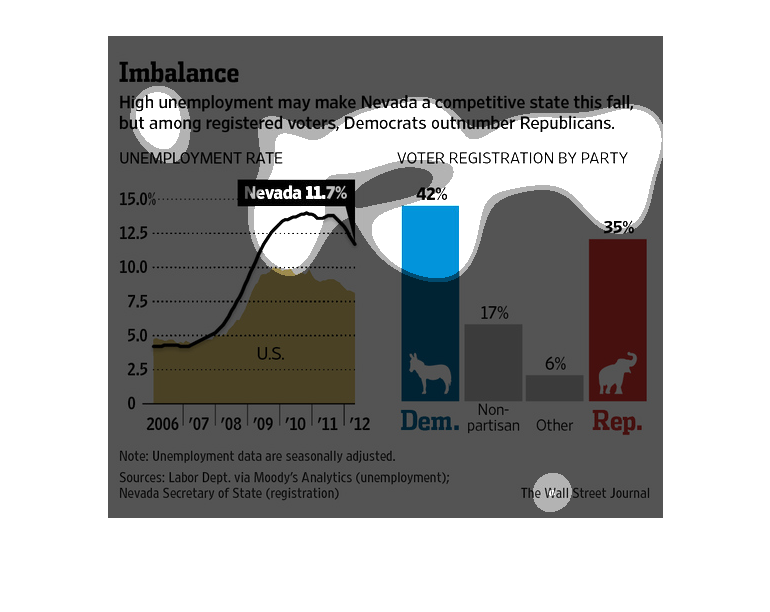
The image depicts high unemployment in Nevada possibly leading to Nevada becoming a competitive
state among registered voters in the next election, with democrats outnumbering republicans.
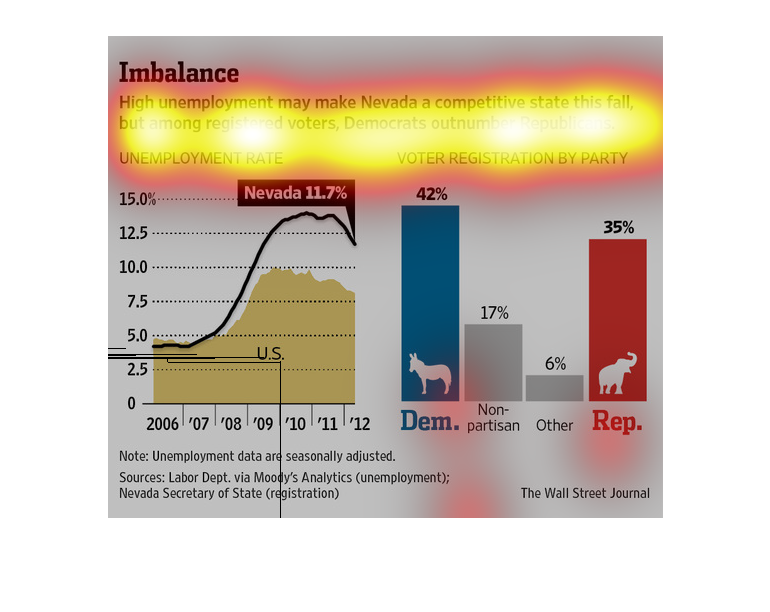
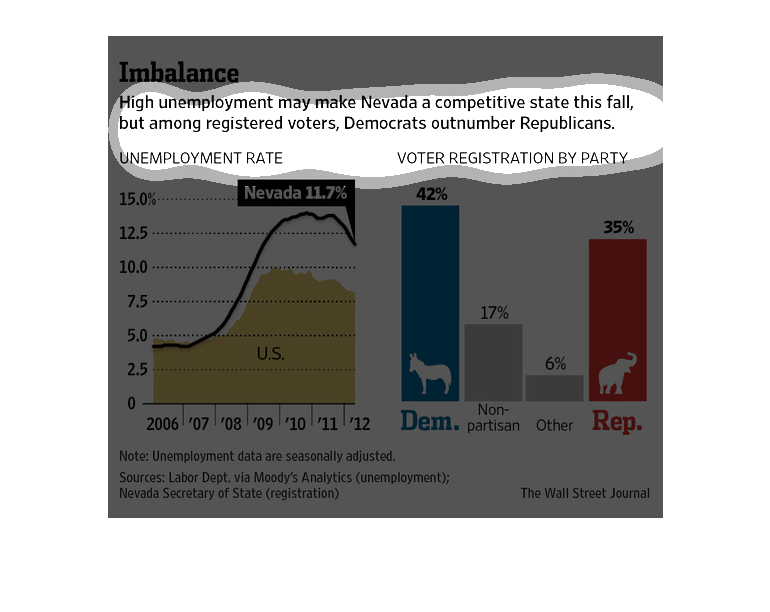
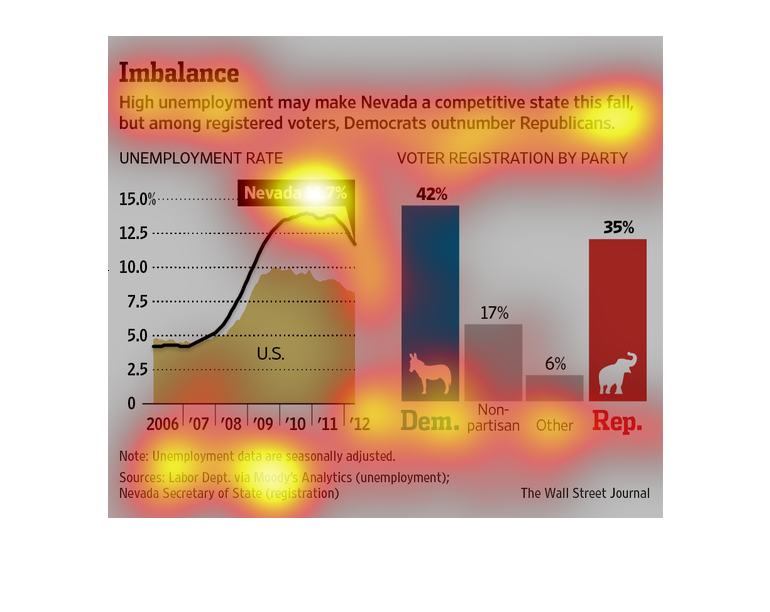
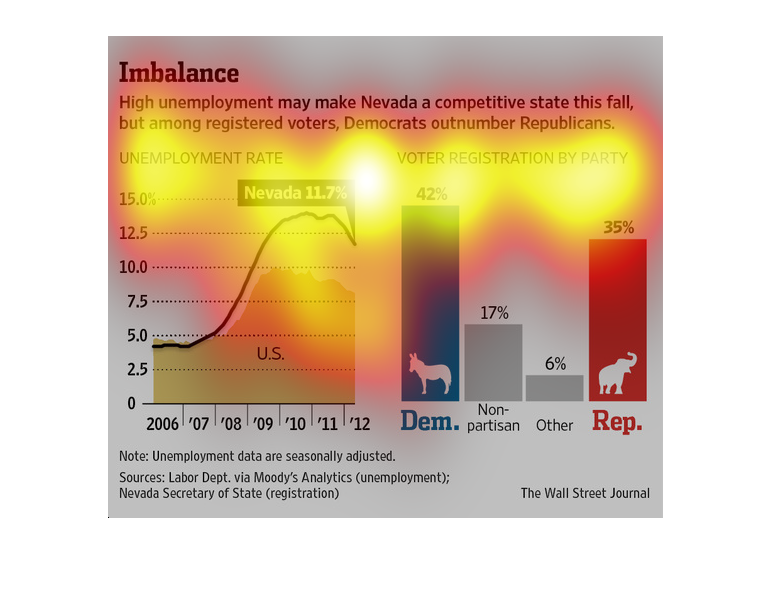
Unemployment in Nevada appears to be noticeably higher than the rest of the US.

These graphs depict that the highest unemployment may make Nevada a competitive state fall
of 2012, but among registered voters, Democrats outnumber Republicans. Nevada's unemployment
is at 11.7%.
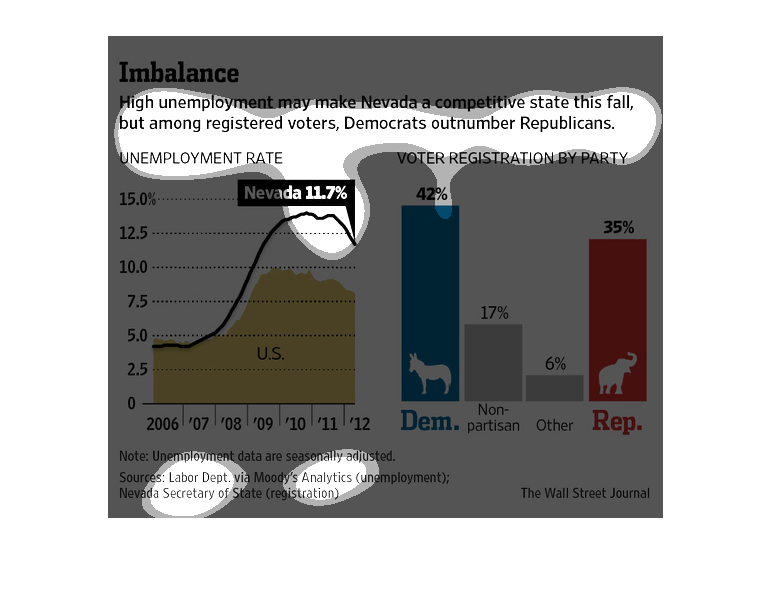
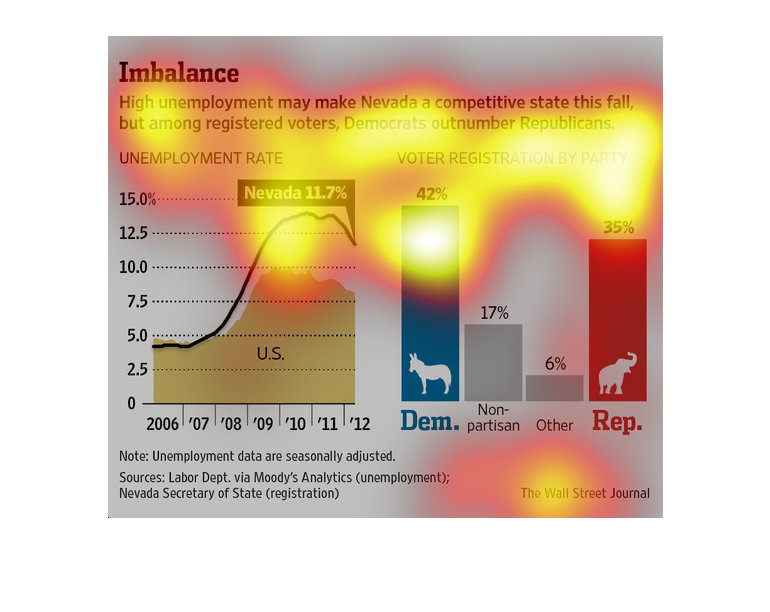
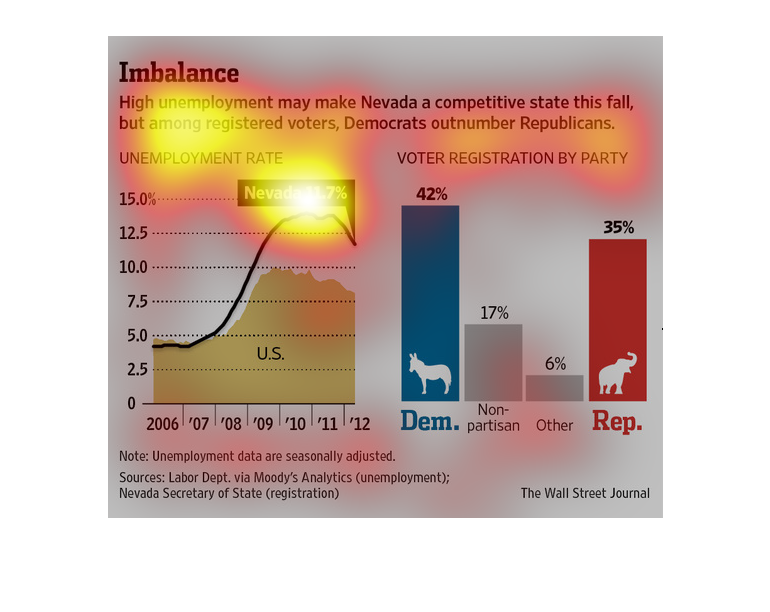
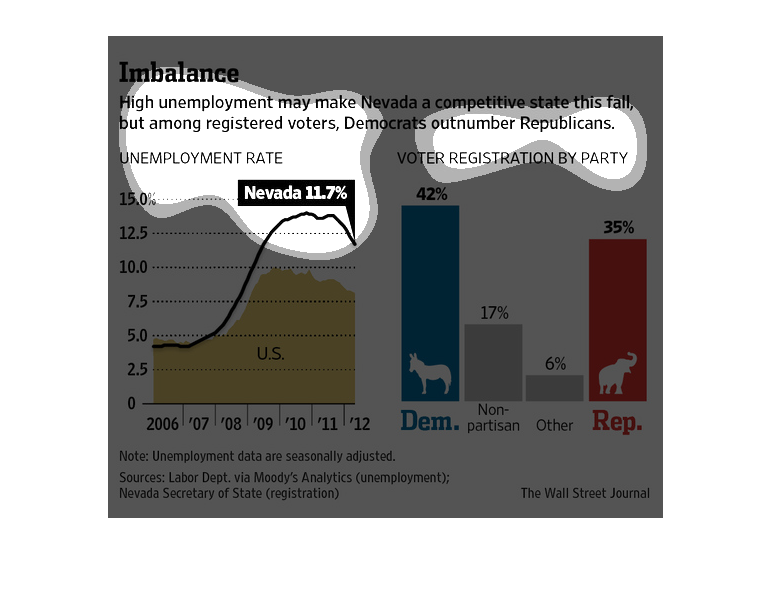
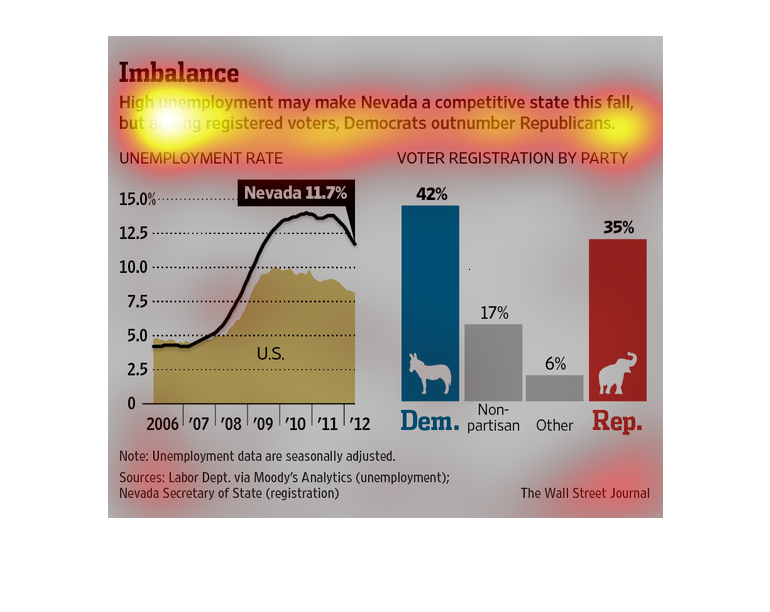
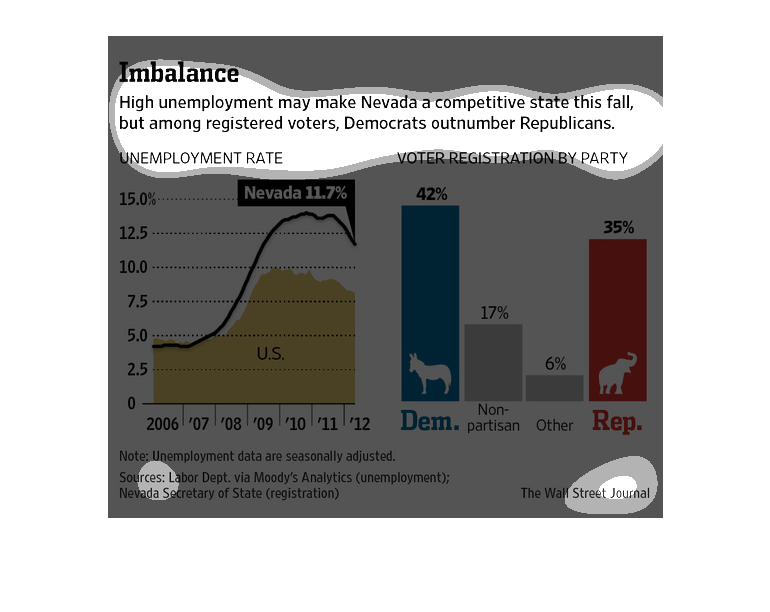
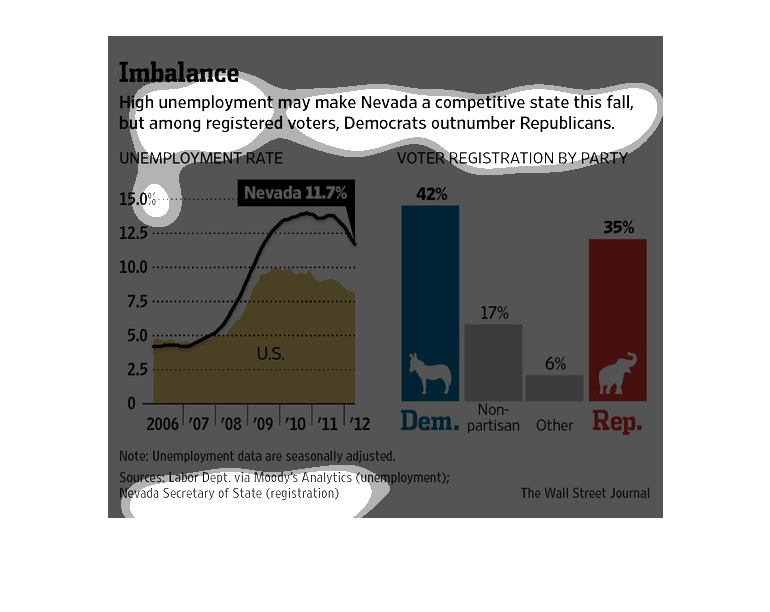
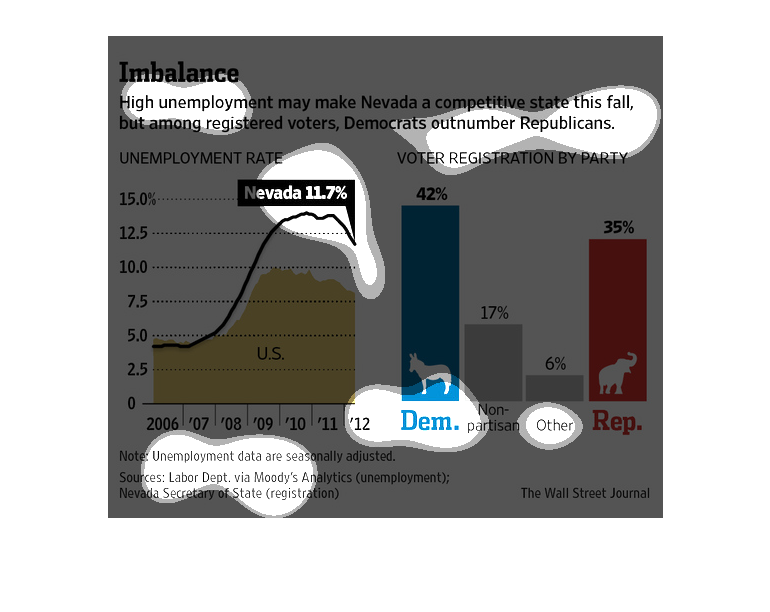
The caption for this image is, "Imbalance, High unemployment may make Nevada a competitive
state this fall, but among registered voters, Democrats outnumber Republicans".  Under this
caption are two graphs.  One graph displays the unemployment rate between 2006-2012.  The
other one showing the number of registered voters by party.
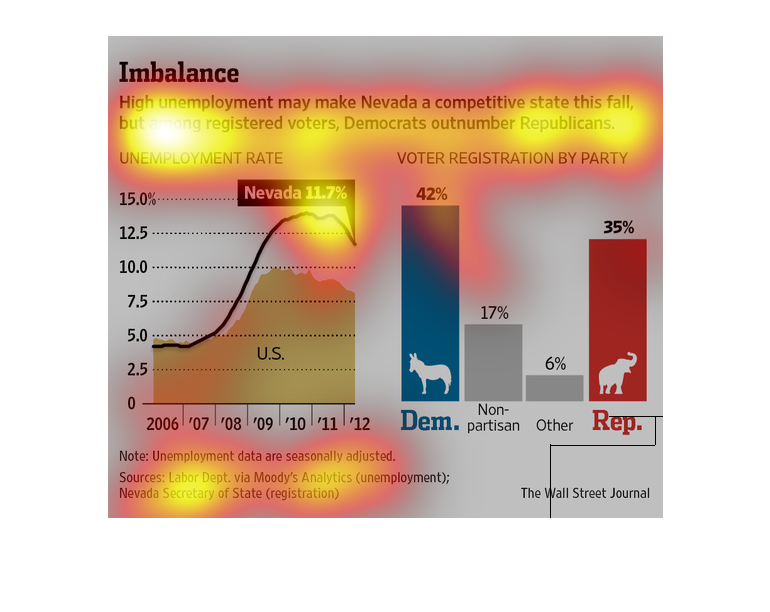
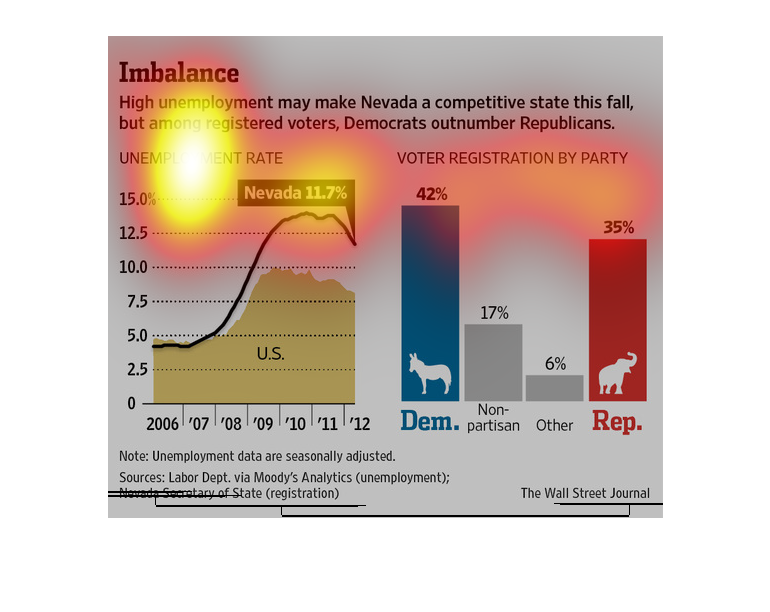
In the state of Nevada- according to a study conducted by the Wall Street Journal- there will
be a lot of completion with the development of a rising voting trend towards Republicans in
a normally Democratic State.
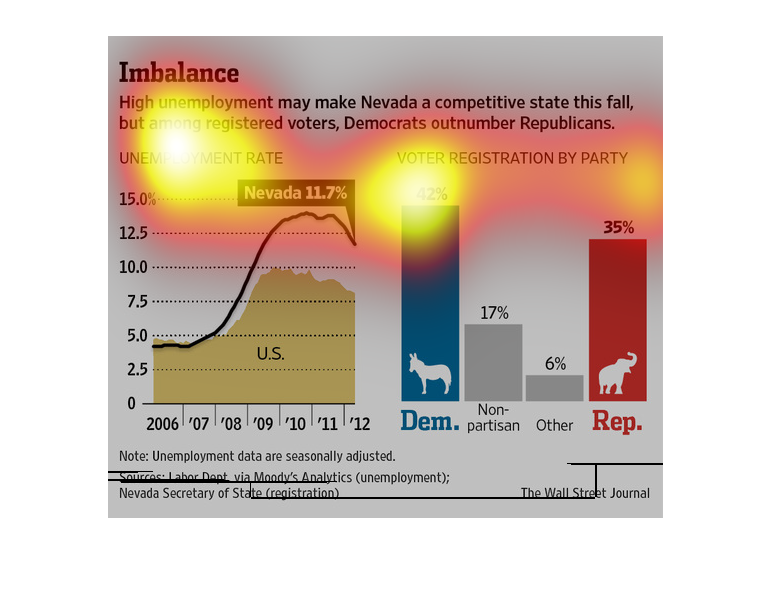
This image shows that the number of Democrats in Nevada is greater than the number of Republicans
in Nevada. It also shows how the Nevada unemployment rate has increased over time.
This image is entitled "Imbalance."  It shows high unemployment may make Nevada a competitive
this fall, but among registered voters, Democrats outnumber Republicans.  Graphs show unemployment
rates and voter registration by party.  Data ranges from 2006-2012.  Unemployment rates range
from 0 - 15%.  The source is Labor Department via Moody's Analytics (unemployment) and Nevada
Secretary of State (registration).  This image appeared in The Wall Street Journal.
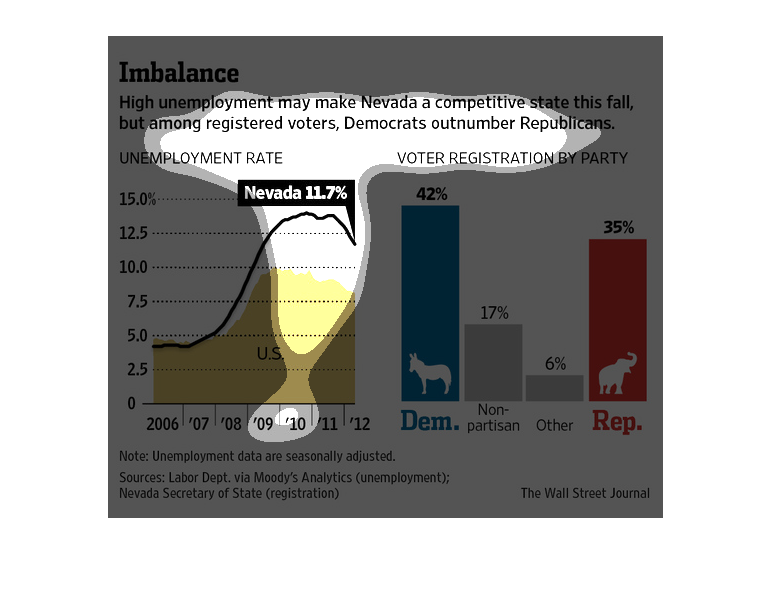
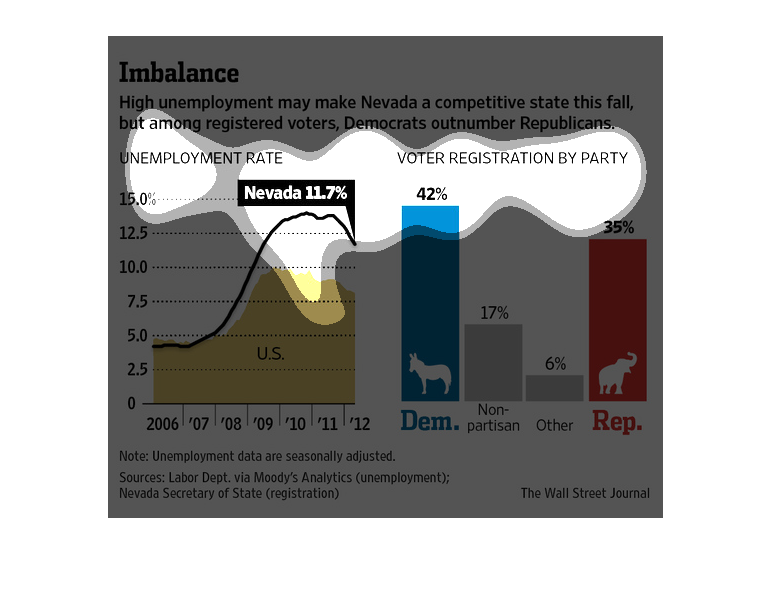
This chart from the Wall Street Journal shows how Nevada may be a swing state in 2012 because
of the state's high unemployment rate. It ended up going democratic
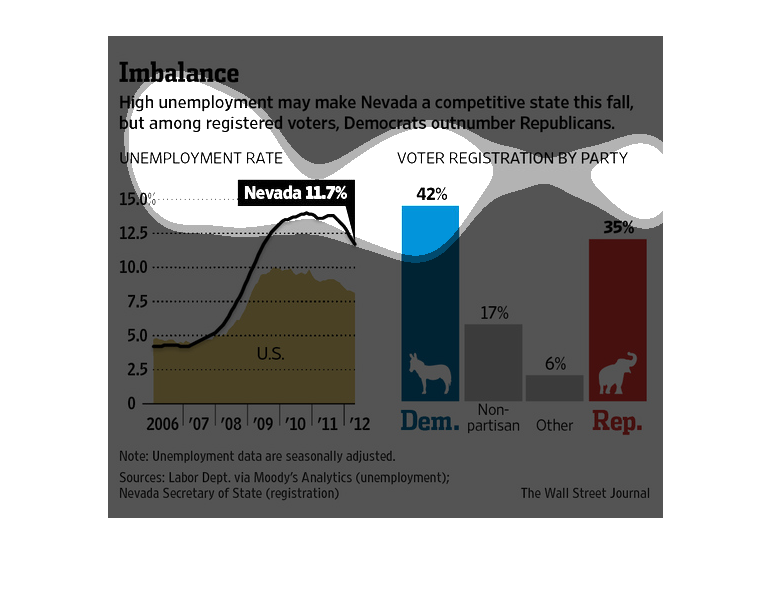
This is a graph that is being used to illustrate that high unemployment could affect Nevada
which is a competitive state in the election. This shows registered voters from both parties.
The figure presented is titled Imbalance.  The figure is a representation of the statistical
data for the low rate of employment in Nevada affecting the election.
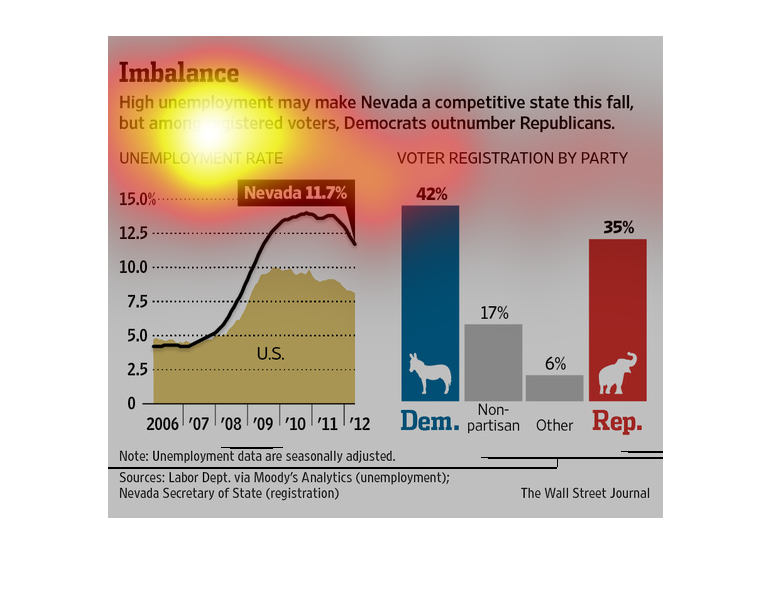
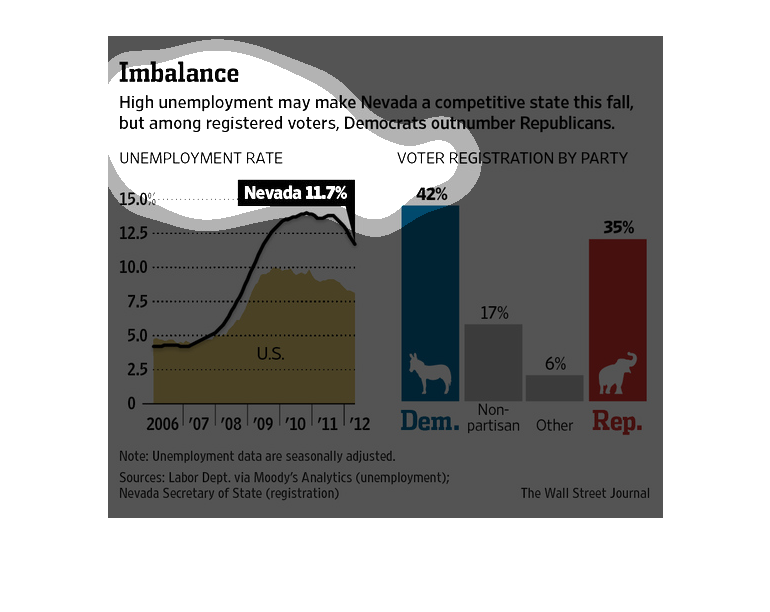
The image depicts how high unemployment may make Nevada a competitive state in the general
election. Registered democrats outnumber Republicans. Nevada's unemployment rate is noticeably
higher than the US average, with Nevada's rate hovering around 11.7%.
This image states the Nevada has a high unemployment rate, which can effect voting.  There
are more democrats than republicans there.  Nevada's unemployment rate is at 11.7%
This chart from the Wall Street Journal shows how the high unemployment in 2012 in Nevada
had the potential to make Nevada a swing state in the presidential election
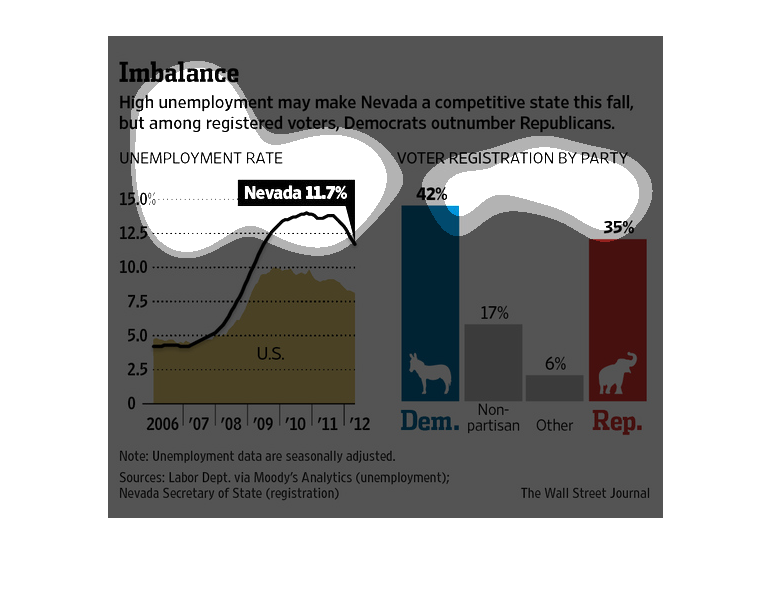
This image shows the percentage of Nevada citizens that are registered with the Democratic
Party, the Republican Party, or as non-partisan or other. This is compared to unemployment
rate in Nevada over time.