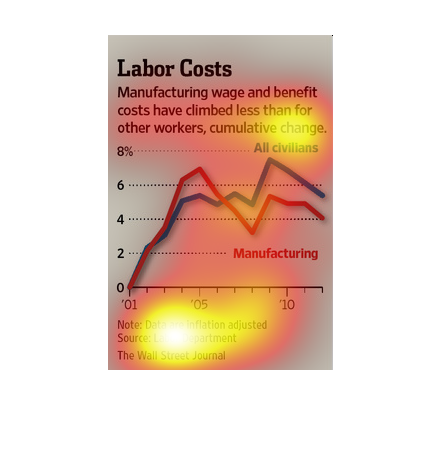
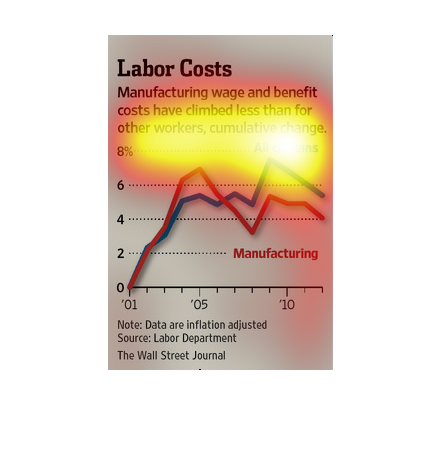
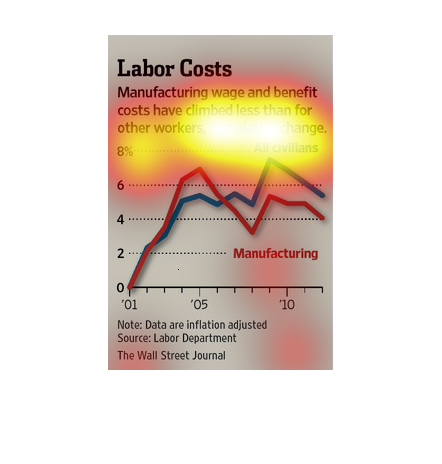
The figure presented to the left is titled Labor Costs.  The figure is a representation of
the statistical research data for Manufacturing labor costs and benefits.
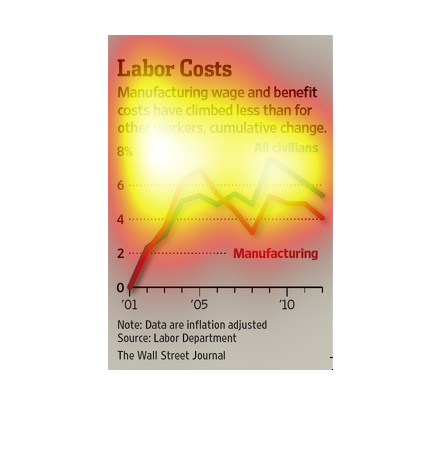
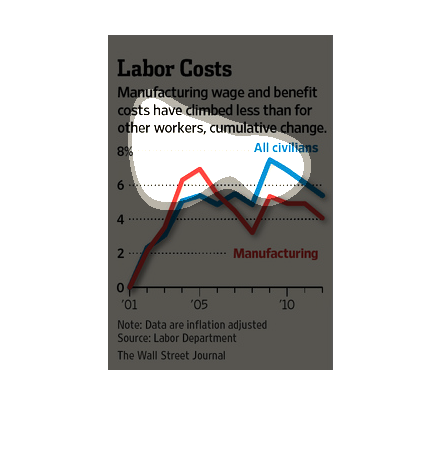
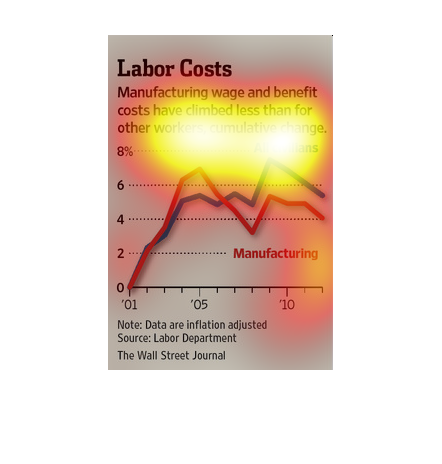
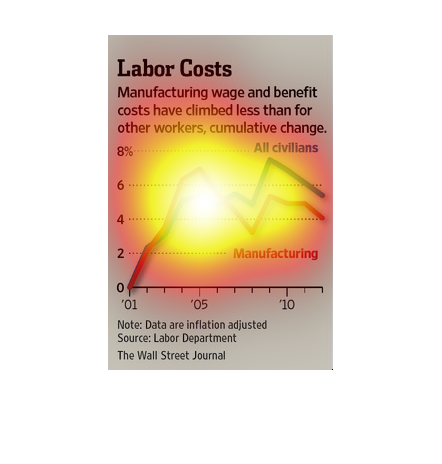
This chart describes labor cost. Specifically,manufacturing wage and benefit costs have climbed.
Different categories are represented by different colors.
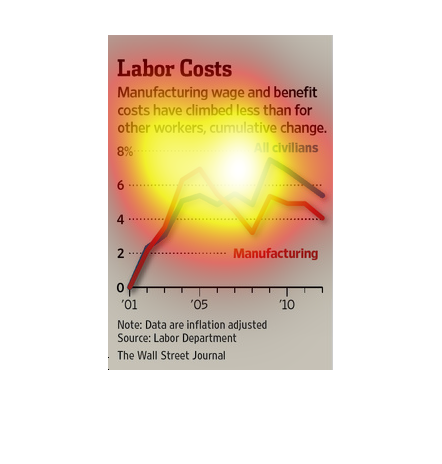
This is a graph that is mean to illustrate that the manufacturing wage and benefit costs have
climbed less than for all the other types of workers between the years 2001 and 2010.
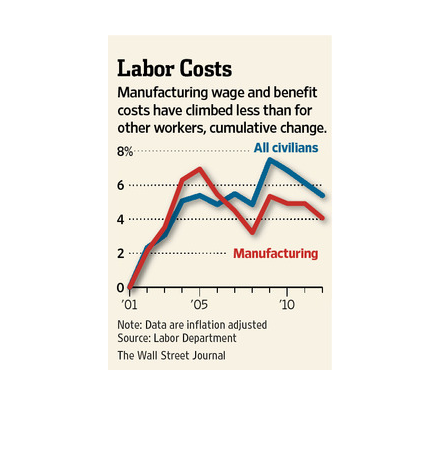
This chart from the Wall Street Journal shows how manufacturing labor costs and benefits have
grown slower than the wages of other industries.
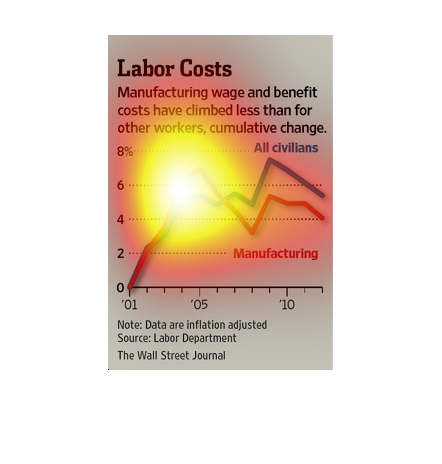
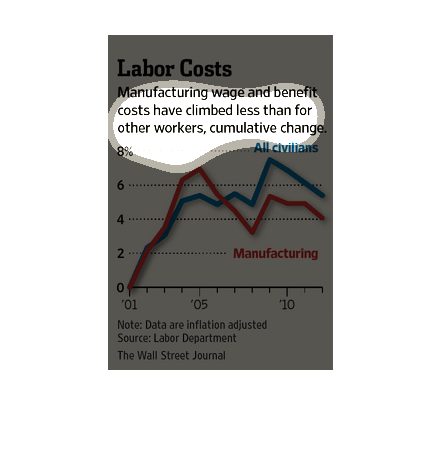
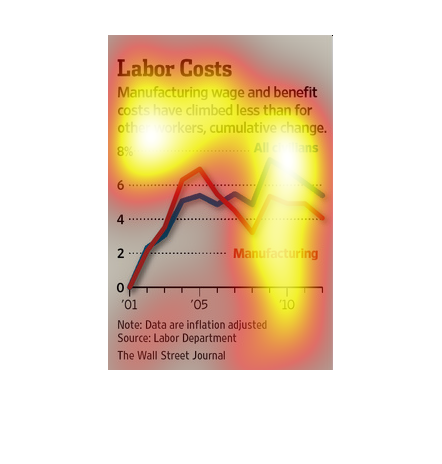
In this study conducted by the Wall Street Journal- from data obtained from the Labor Department-
we see that the hope of finance is very wrought with pitfalls. We see in this graphic the
struggle to keep the balance between wages and manufacturing cost.
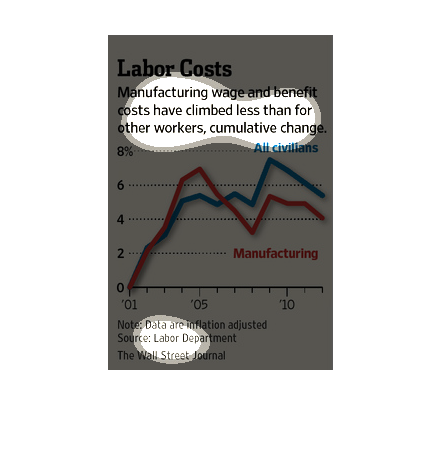
In this study conducted by the Wall Street Journal- from Data collected from the Labor Department-
we see that cost have drastically risen in labor and manufacturing.
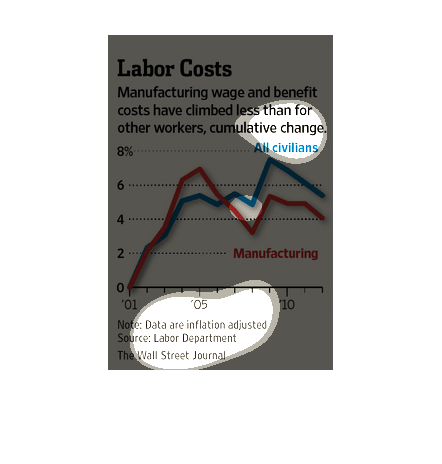
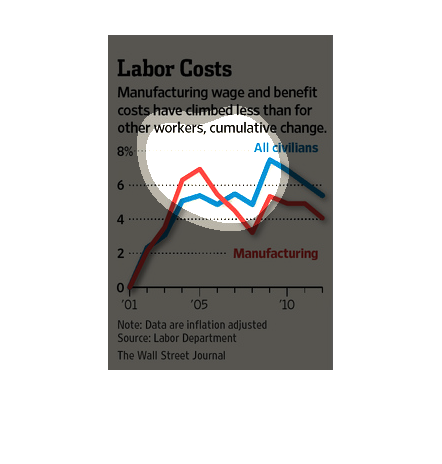
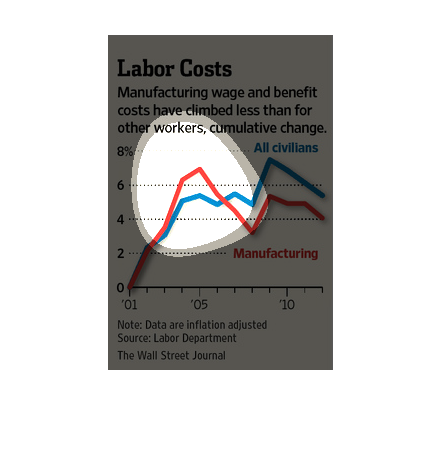
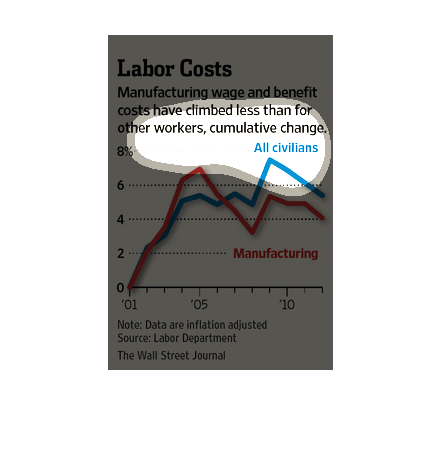
This is a line graph comparing the rise in costs of wage labor in the manufacturing industry
to the rise in costs of wage labor in other civilian industries. It shows that while wage
labor costs in manufacturing have grown, they have not grown as quickly as in other industries.
This images speaks of manufacturing wage and benefit costs. There is a graph, showing data
from 2001 to 2010 for the manufacturing sector vs. the civilian population. The former sector's
costs have climbed less than the latter.
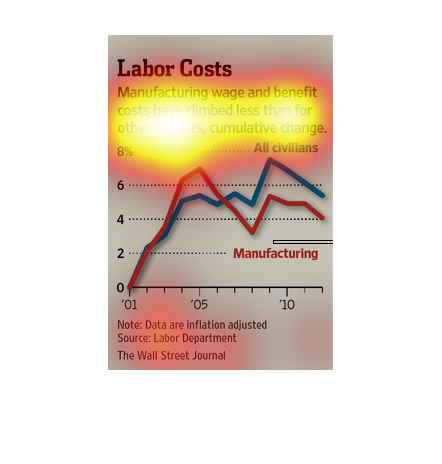
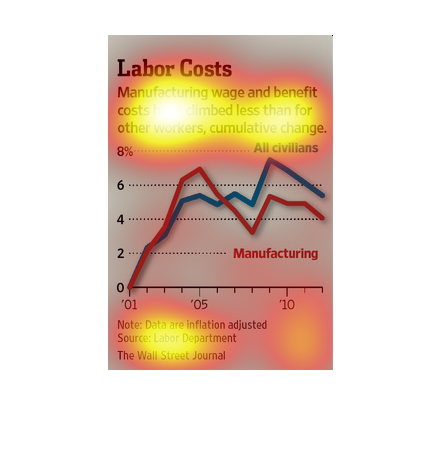
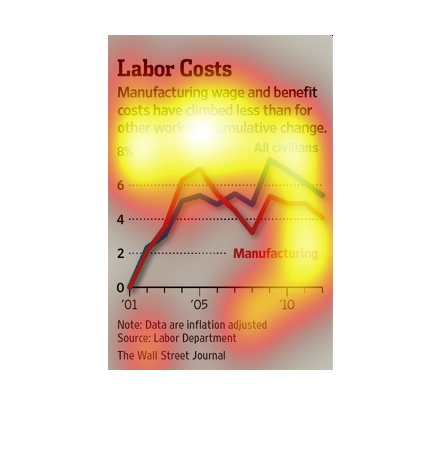
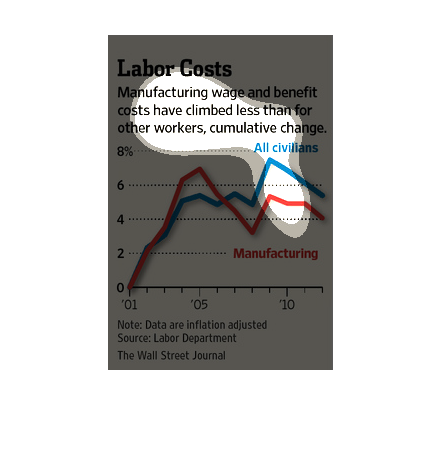
This image shows that employees who work in manufacturing receive less benefits and wage increases
than workers in other industries over time. Both measures have decreased recently.
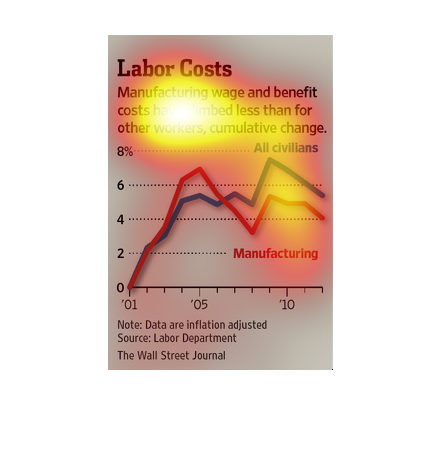
This chart shows that manufacturing wages and benefit costs have climbed less than for other
workers in the labor force.  It illustrates all civilians and manufacturing costs from 2000
to 2011.
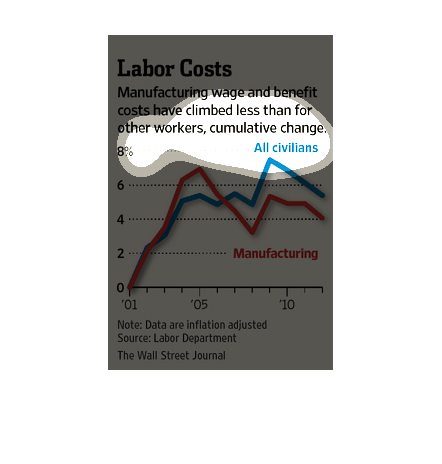
Titled Labor Costs, it is a line graph with red and blue lines,  the blue lines representing
all civilians and red line for manufacturing. The lines go up and down depending.
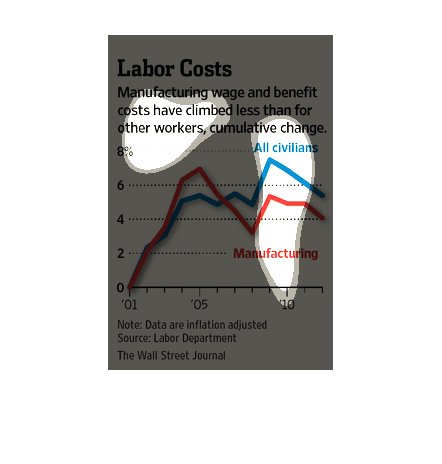
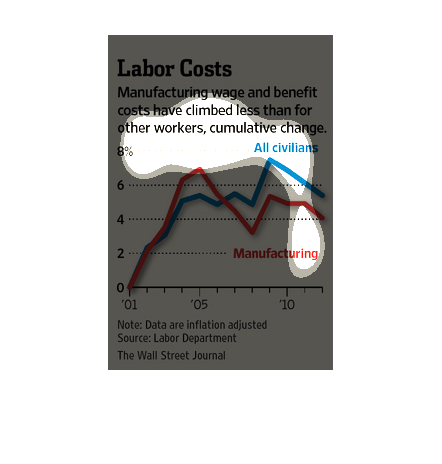
This chart from the Wall Street Journal shows how labor costs and benefit costs for manufacturing
have risen far less than other wages for comparable jobs
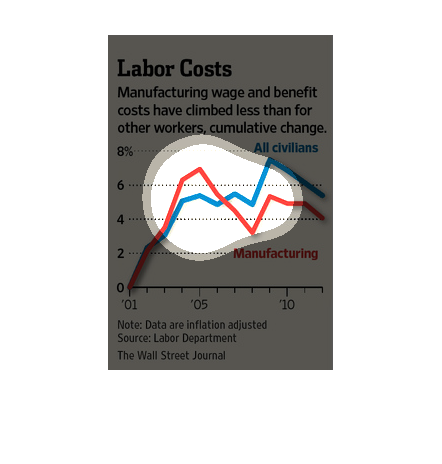
The image depicts how manufacturing wage and benefit costs have increased less than for other
worker, citing cumulative change. Manufacturing costs are around 4%, while All Civilian costs
are around 5%.