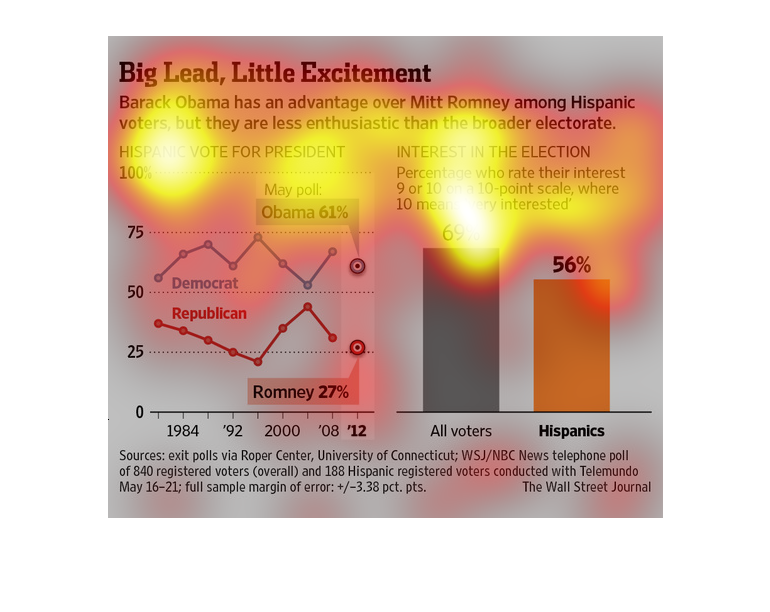
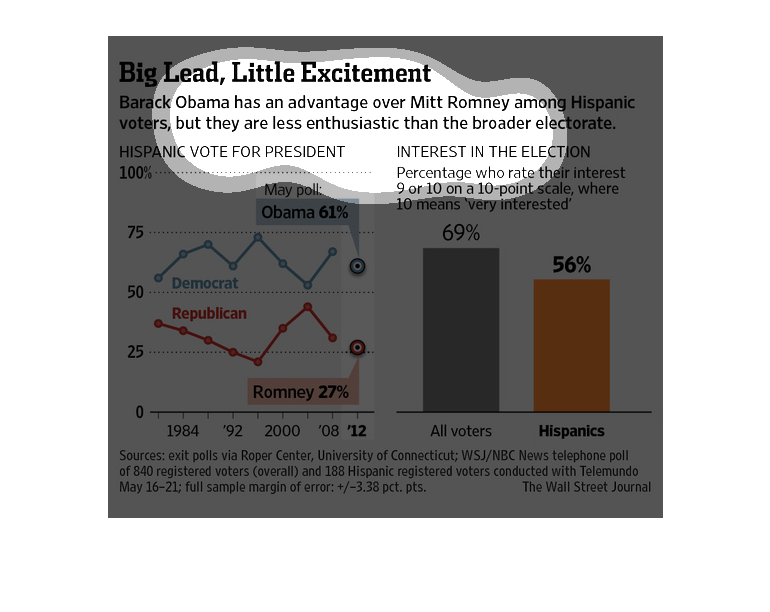
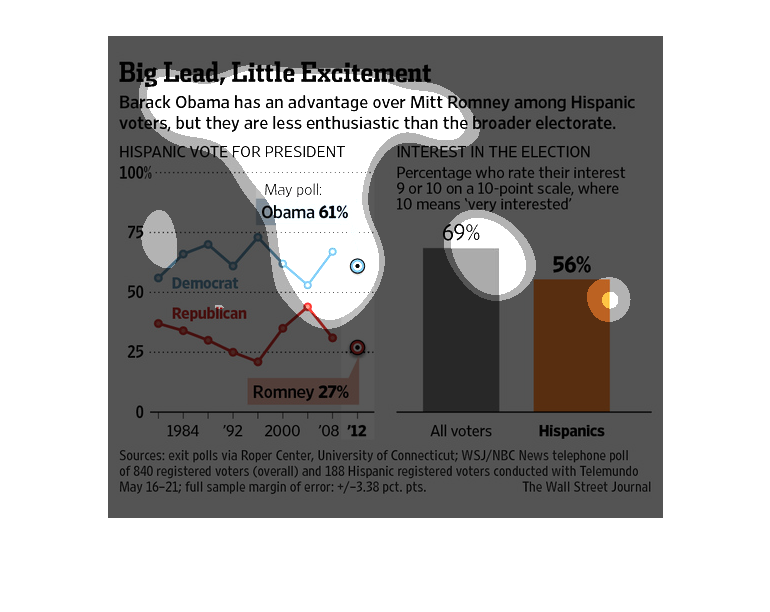
This chart from the Wall Street Journal shows how Barack Obama had a big lead among hispanic
voters in 2012 but that the overall enthusiasm was lower than in 2008
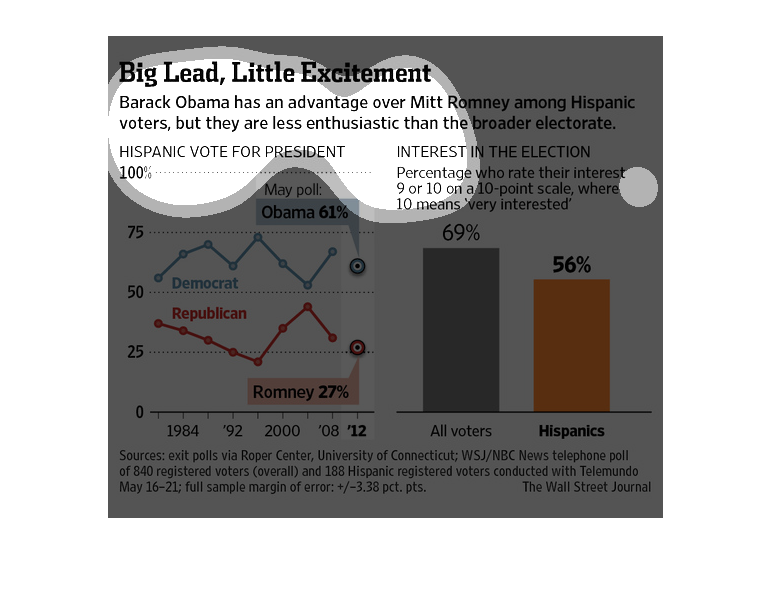
This shows the advantage Barack Obama has over Mitt Romney among the Hispanic voters in the
Untied States presidential election by vote and interest in the election.
The image discusses textually and graphically the Obama-Romney election, saying how Obama
had the lead over Romney regarding Hispanic support, but Hispanics were less enthused than
the rest of the voting population.  One graph shows Obama with 61%, Romney with 27% support.
 Bar chart shows interest with Hispanic voters less than general population.
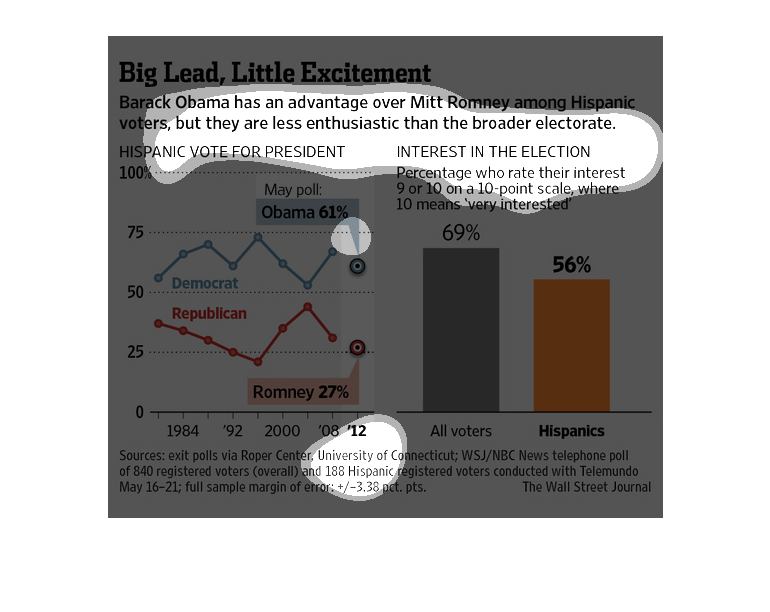
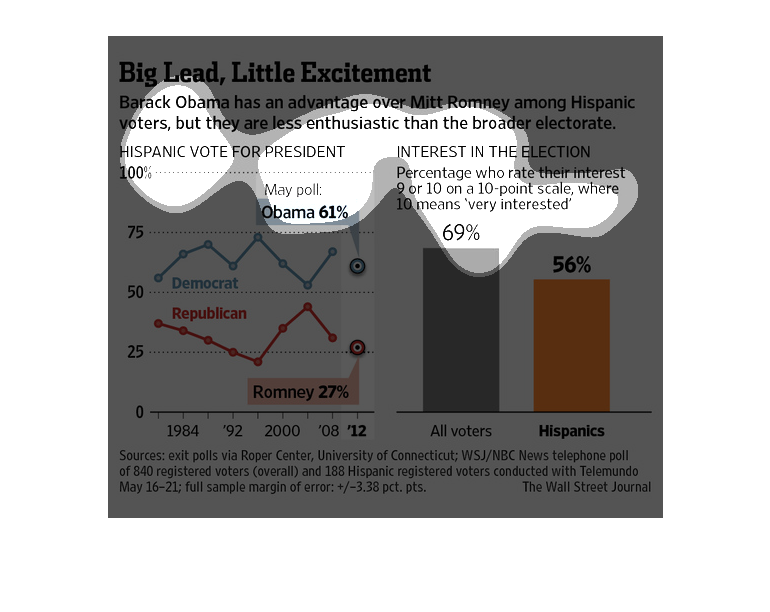
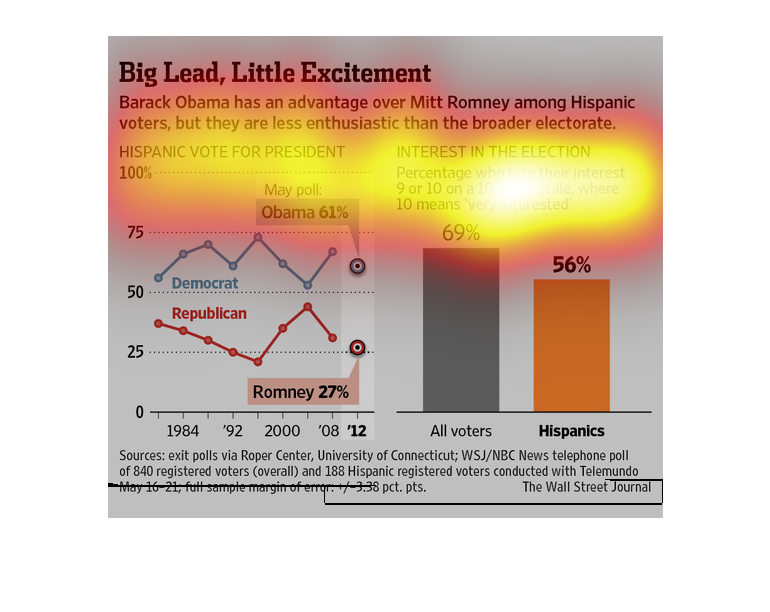
This chart shows about interest for last presidential election (Obama vs. Romney) Hispanics'
interest for the election is much lower than all voters' (69% vs. 56%).
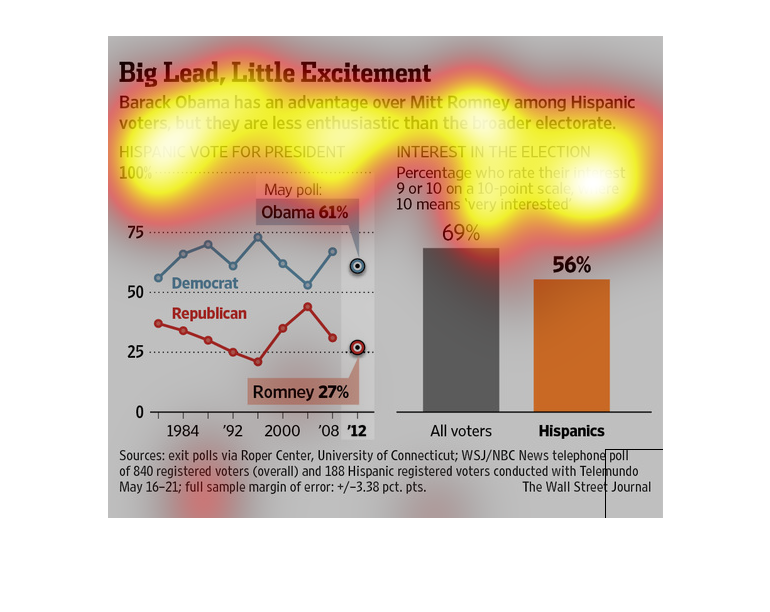
The figure presented to the left is titled Big lead, Little Excitement.  The figure is a representation
of the statistical research data for Barack Obama's advantage.
The image depicts how Barack Obama has an advantage over Mitt Romney among Hispanic voters,
but Hispanic voters are less enthusiastic to vote compared to the broader electorate in the
2012 general election.
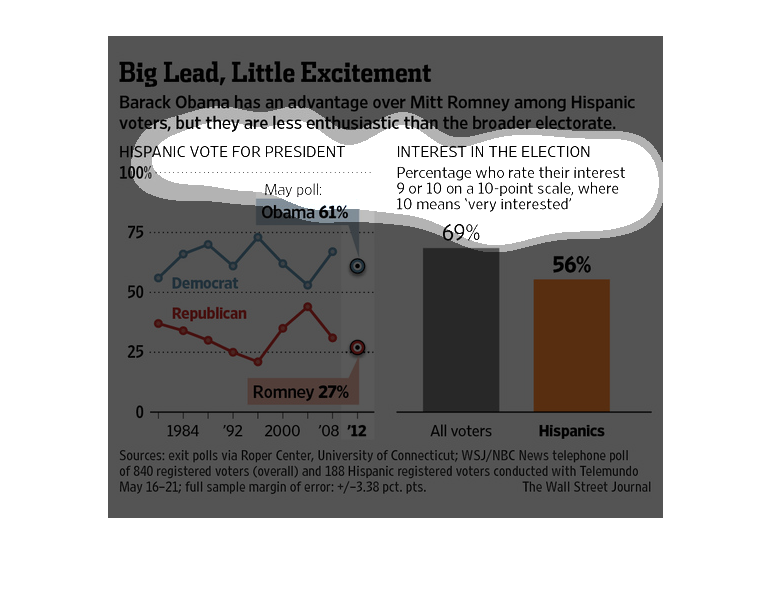
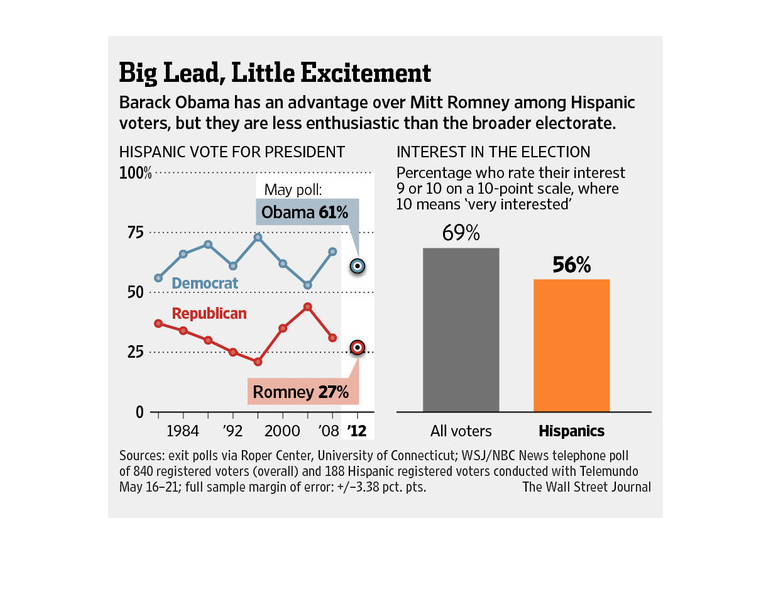
This chart shows Obama had taken the lead in the Hispanic vote over Romney and shows the Democratic,
and Republican Hispanic vote from 1984 to 2012 as well as their interest in the election in
2012.
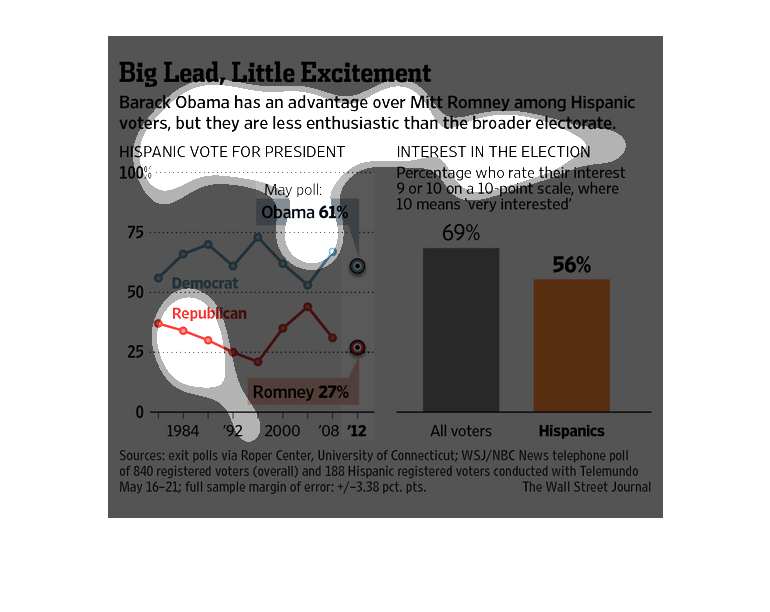
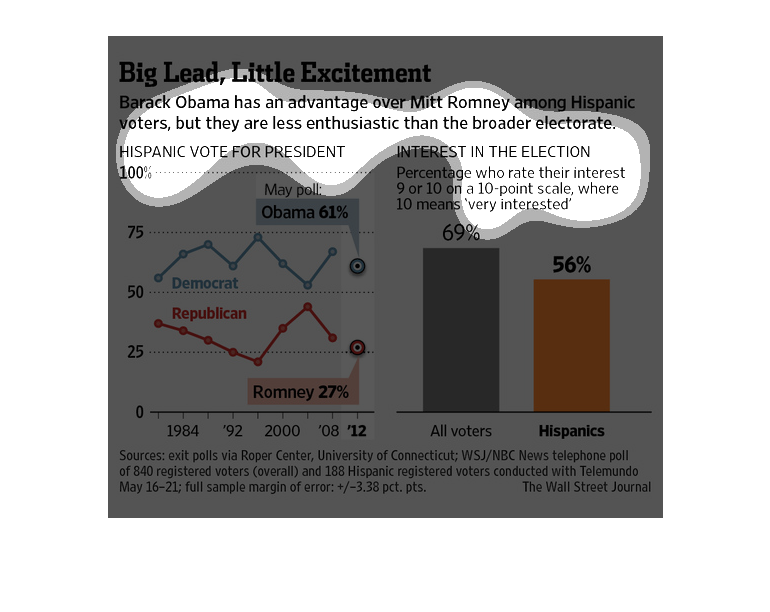
This is a graph that is meant to illustrate that Barack Obama has a slight advantage over
Mitt Romney among Hispanic voters but they are less enthusiastic.
Despite a large lead over Romney with Hispanic voters, there was less excitement. While 61%
 intended to vote for Obama, in terms of interest overall voters was 69%, while Hispanic voters
was  56%.
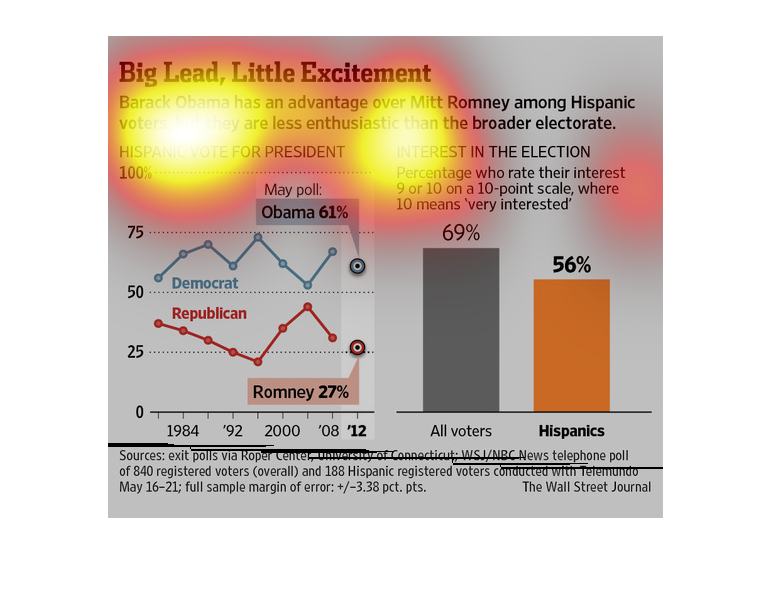
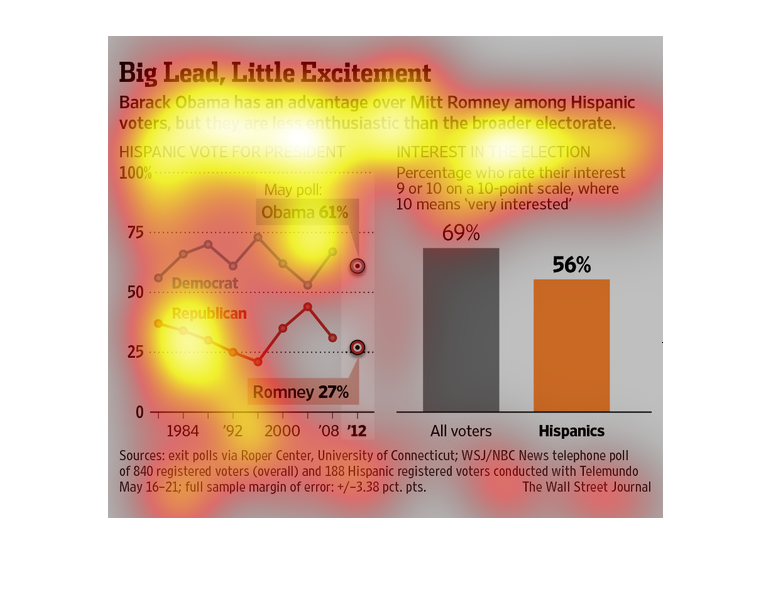
This charts describes and depicts the differences between Barack Obama's and Mitt Romney's
hispanic popularity and also gives information regarding overall hispanic vote.
This chart from the Wall Street Journal shows how Barack Obama has a major lead over Mitt
Romney but that overall enthusiasm is down from 2008
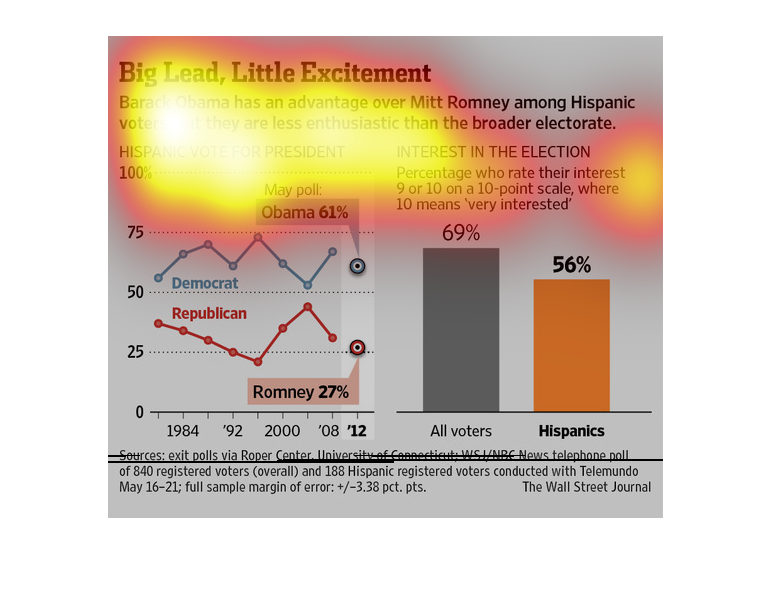
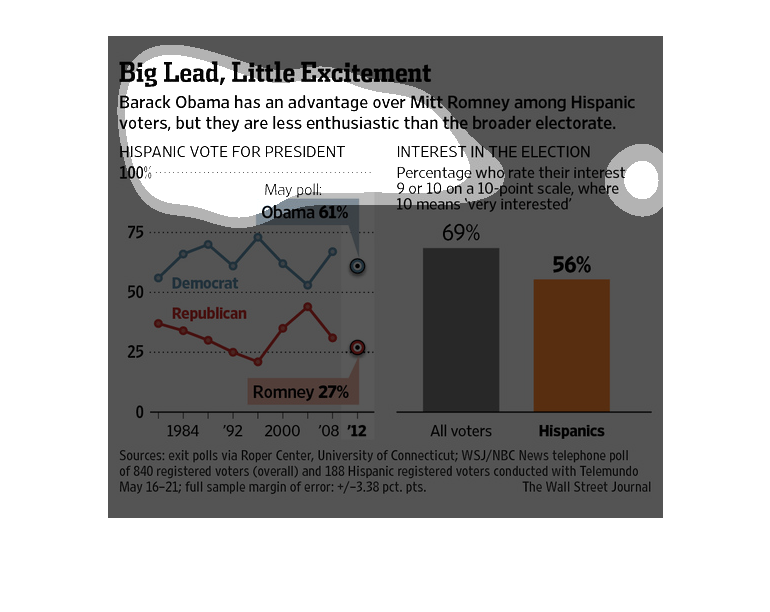
This image looks at the past presidential race between Obama and Romney. The former had an
advantage of the latter with Hispanic voters, but those voters tend to be less engaged in
the process.  Two separate graphs support this claim (a graph, and a bar chart).
These graphs describe the effect of the collective Hispanic vote upon the election of Barack
Obama versus Mitt Romney.  The overarching argument is this: while Obama is significantly
more popular than his Republican contemporary among Hispanics (see the first graph), the "Hispanic"
interest in voting is 10% lower than general voter interest (see second graph), leading one
to wonder whether this popularity will benefit Obama in the long run.