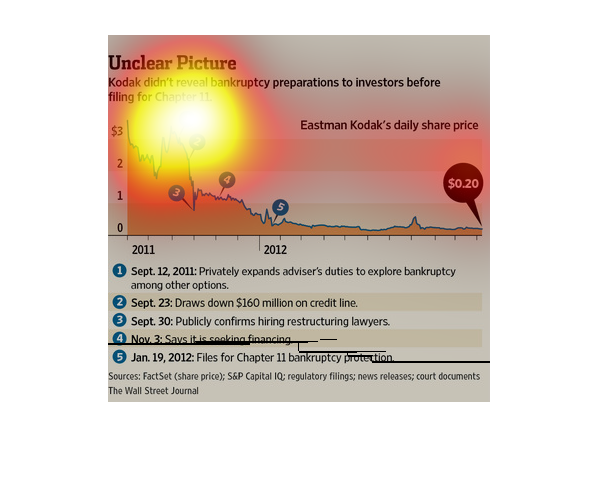
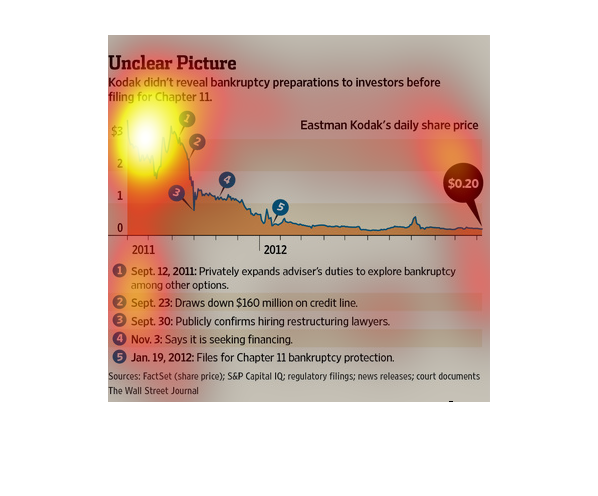
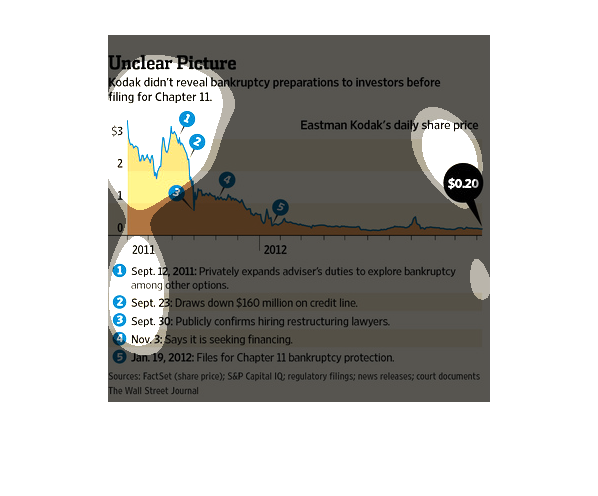
This graph shows that kodak didnt reveal their situation before filing for bankruptcy. A timeline
below lists the events and dates they happened, and the graph above lists their daily shares,
from 2011 and 2013.
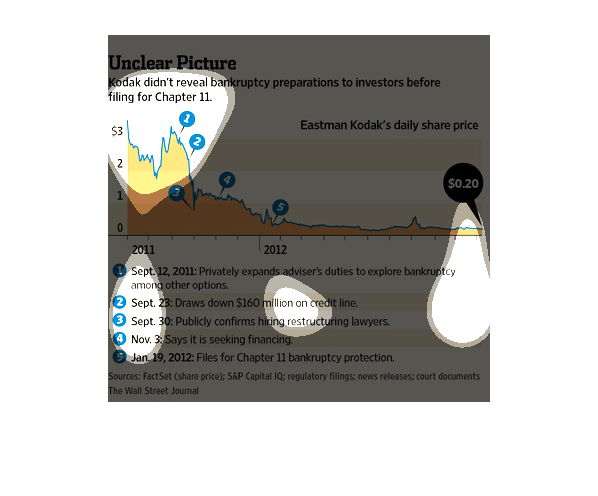
In this study from the Wall Street Journal- source of data directly linked from FactSet- from
the time period of 2011 t0 2012, we see how Kodak dealt with its bankruptcy in a very unethical
manner.
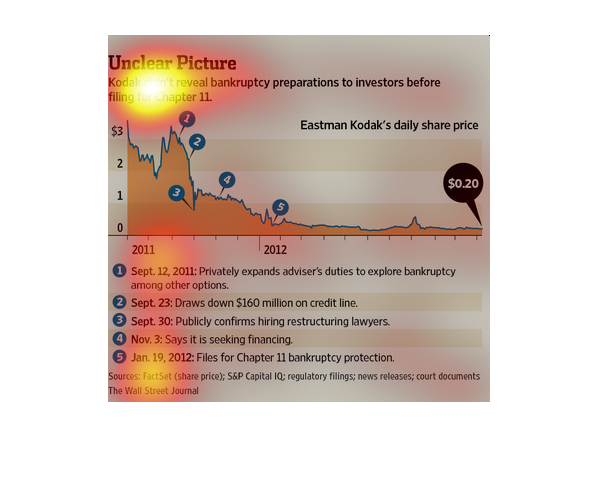
This chart from the Wall Street Journal shows how Eastman kodak went bankrupt and did not
inform investors before its chapter 11 bankruptcy filing.
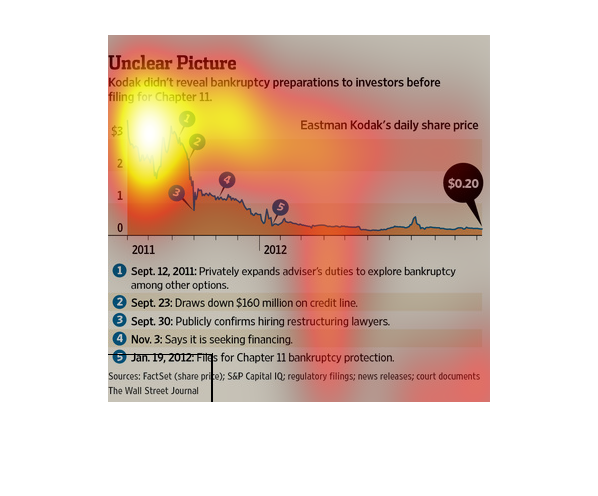
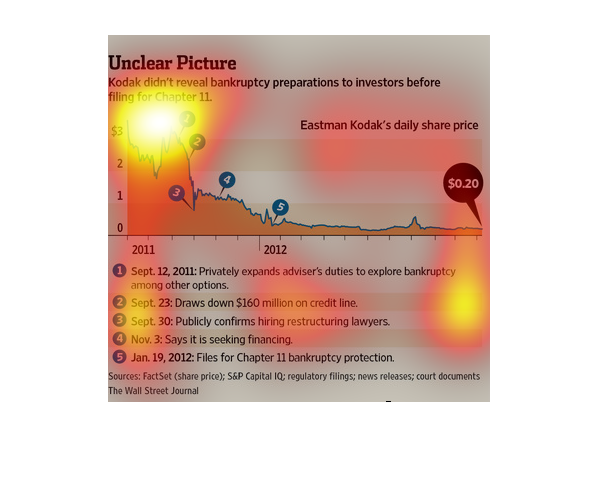
The image describes the unclear world of bankruptcy, specifically chapter 11 and the trouble
navigating the legal requirements and results of filing for chapter 11.
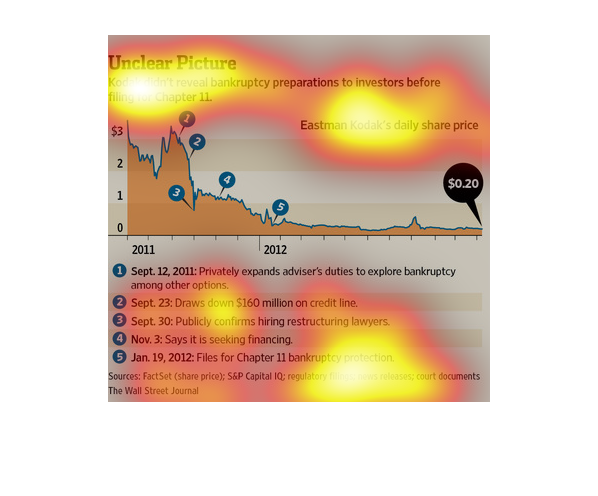
This is a graph that shows that Kodak did not reveal bankruptcy preparations to its investors
before they went ahead and filled for Chapter 11. This is in the 2011 to 2012 period.
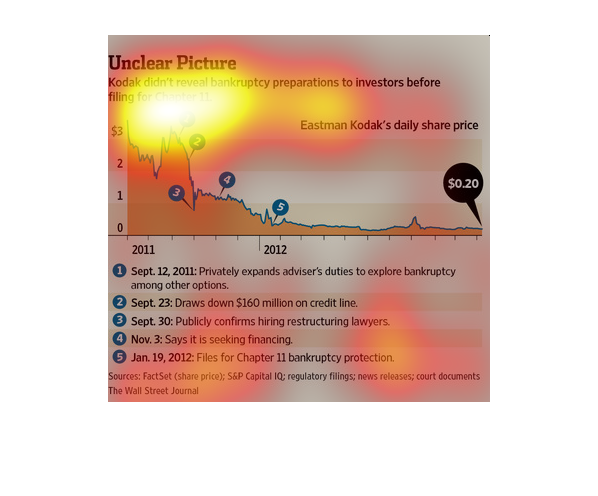
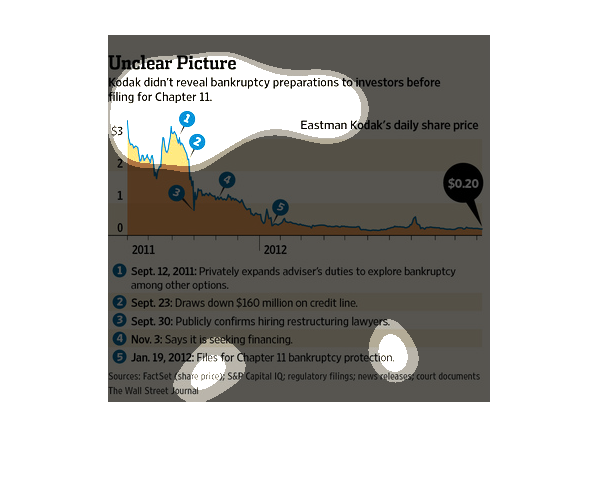
The chart is entitled "Unclear Picture" which describes that Kodak didn't reveal they were
filing for bankruptcy to their board until they had already filed for chapter 11. The graph
details Kodak's falling share prices from 2011 to the day in 2012 when they filed for bankruptcy.
THeir stock price fell from $3 to $0.20.
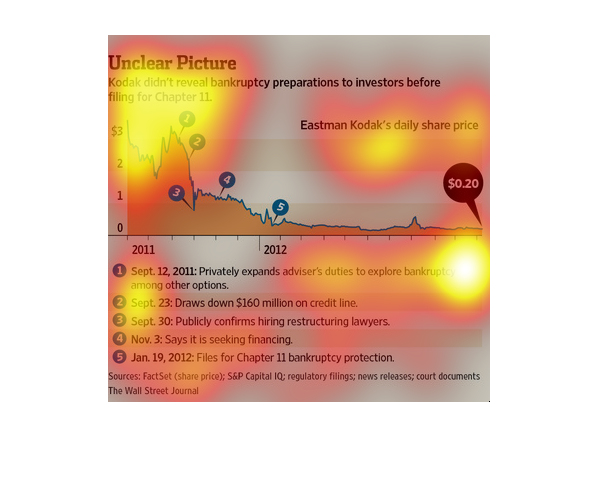
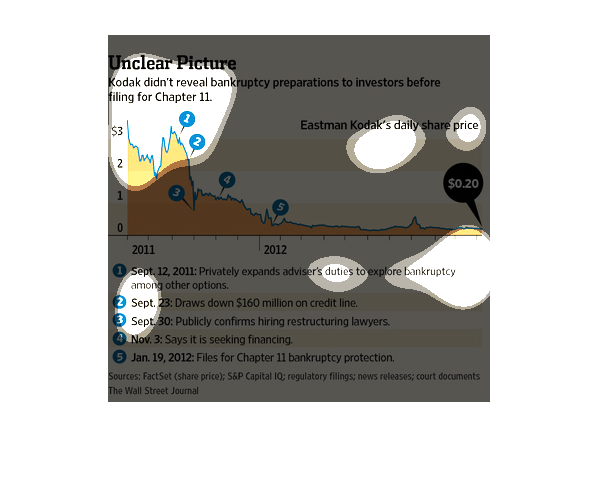
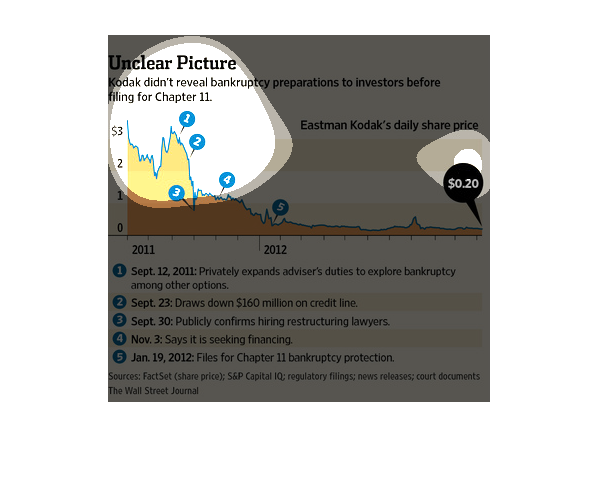
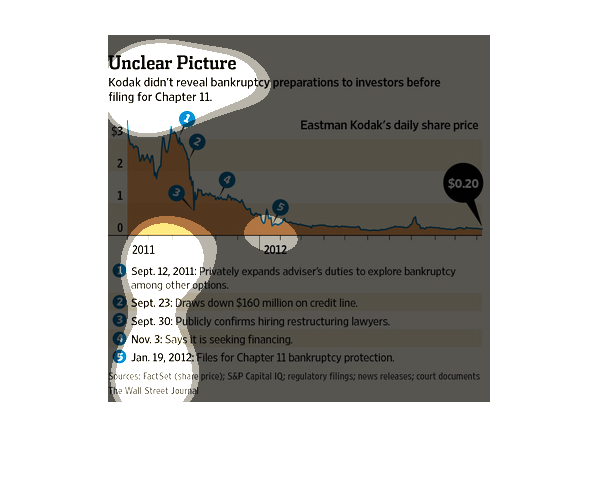
A chart called Unclear Picture. It is orange and goes up and down represents Eastman Kodak's
daily share price. Below it is a list of things Kodak did once it filed for bankruptcy.
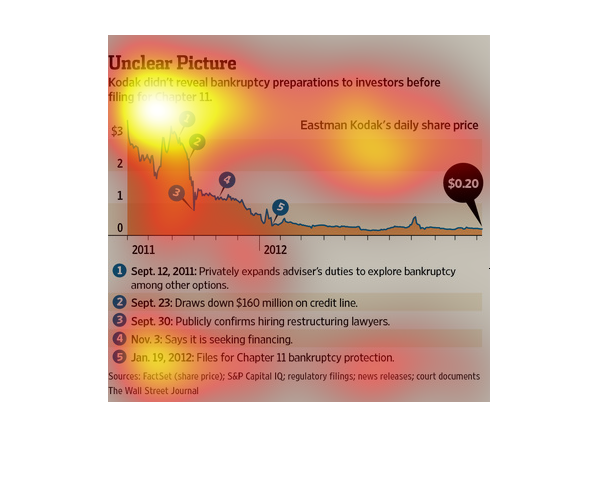
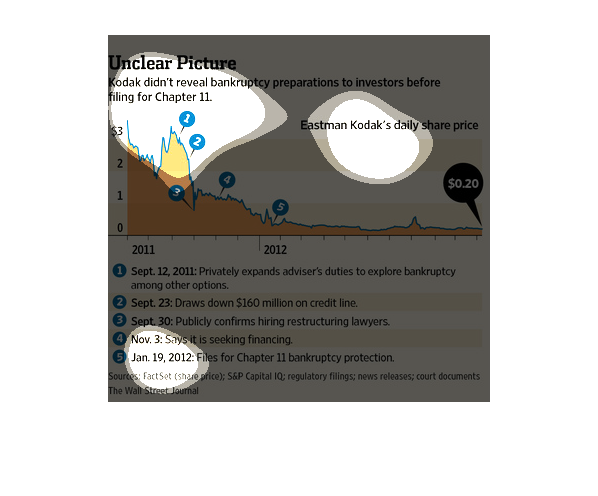
The image depicts how Kodak did not reveal bankruptcy preparations to investors filing before
chapter 11. Kodak's stock has fallen to tremendous lows and cratered around $0.20.
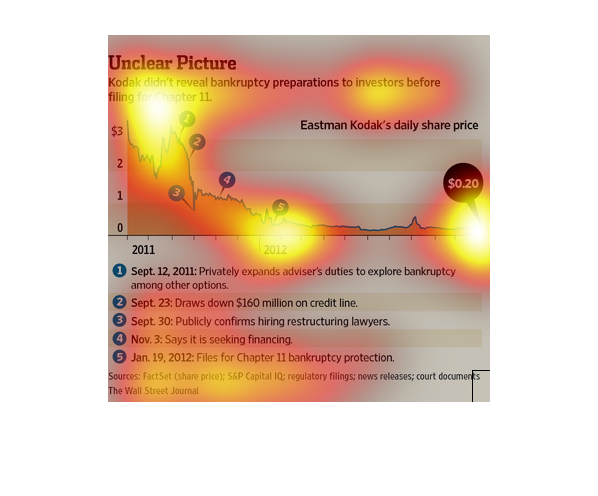
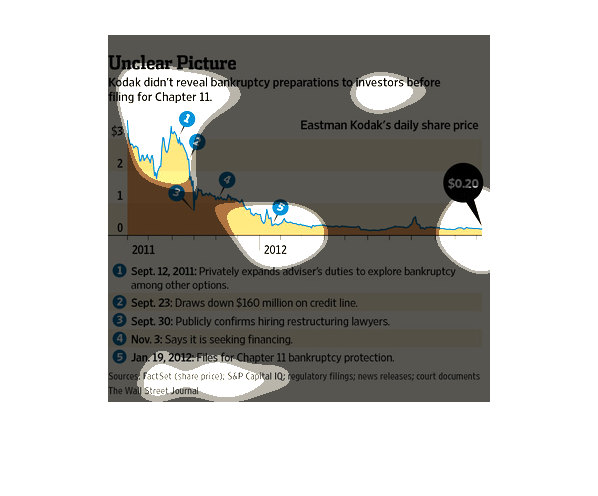
This chart represents Eastman Kodak's daily share price leading up to their filing for bankruptcy
in 2012.  It shows the high value then downward trend in price because they did not share
Chapter 11 preparations with investors.
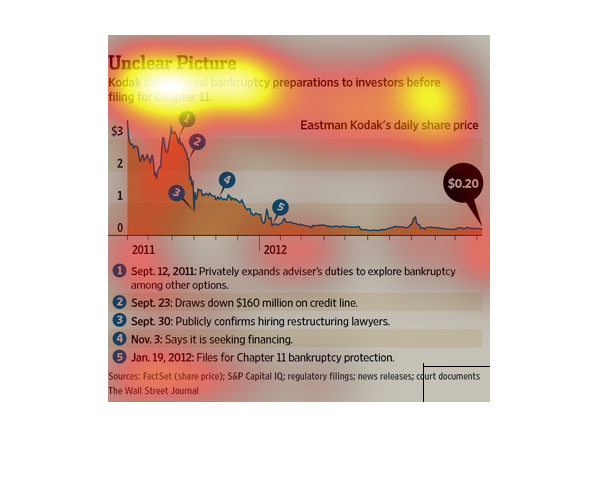
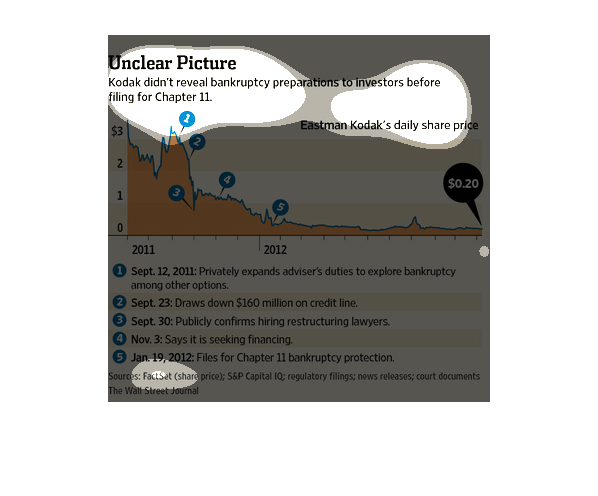
This chart says Kodak investors were not informed of their impending Chapter 11. The chart
says their share prices fell from over $3 in 2011 to $0.20 by the end of 2012.
This chart describes your typical graph chart that sets up one or a number of categories,
illustrated by either a map, a graph, an illustration, or photographs, etc.
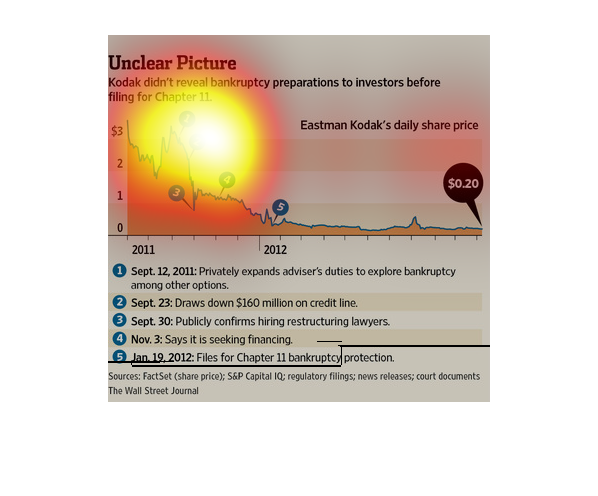
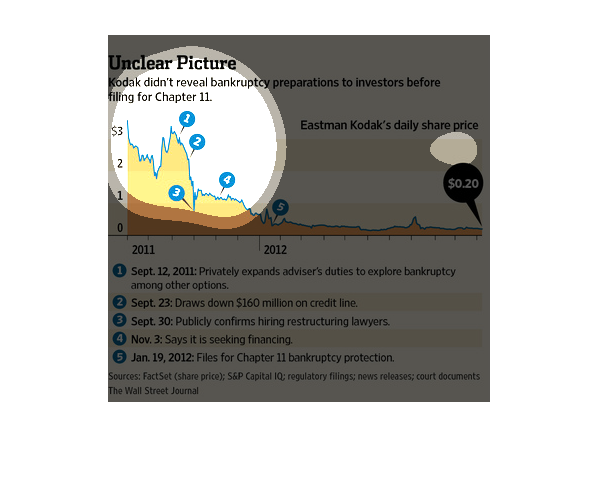
This chart titled "Unclear Picture"  shows that Kodak didnt reveal bankruptcy preparations
to investors before filing for Chapter eleven.  It shows the daily price from 2011-2012.
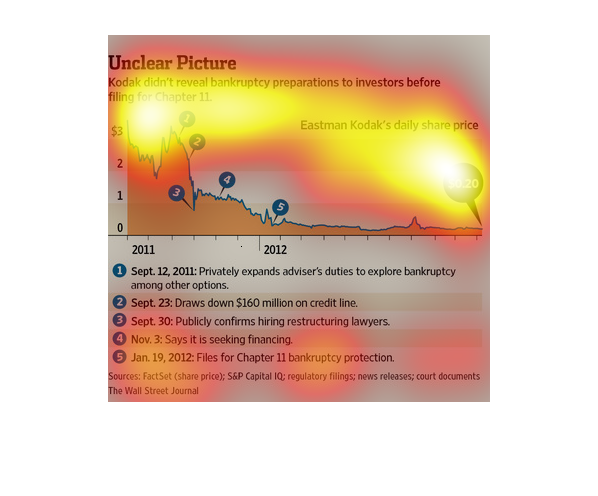
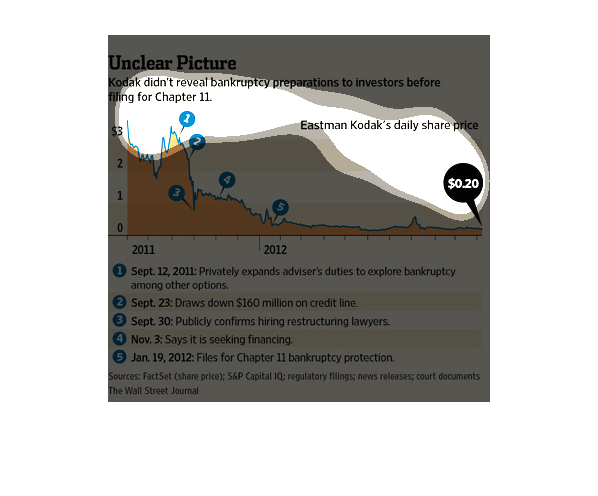
This chart shows the stock price of Kodak's holdings before and after filing for bankruptcy.
A dramatic decrease over a short time can be seen. Also noted are various important events.
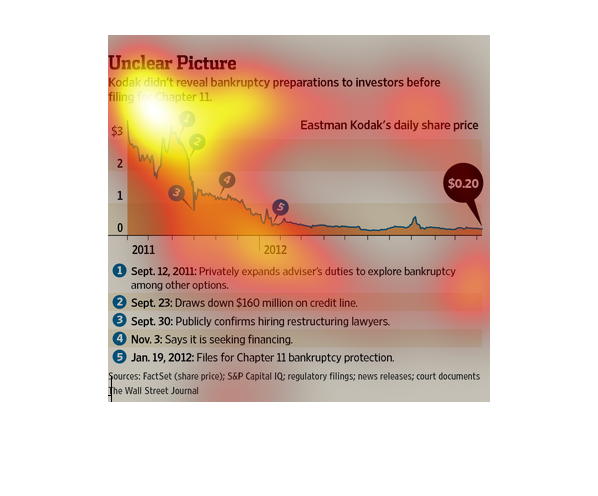
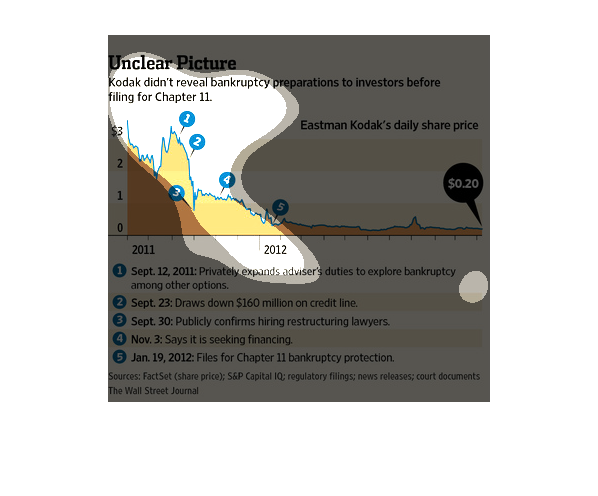
This chart from the Wall Street Journal shows how Eastman Kodak was on the brink of bankruptcy
but did not reveal to shareholders of its plans until it filed for Chapter 11