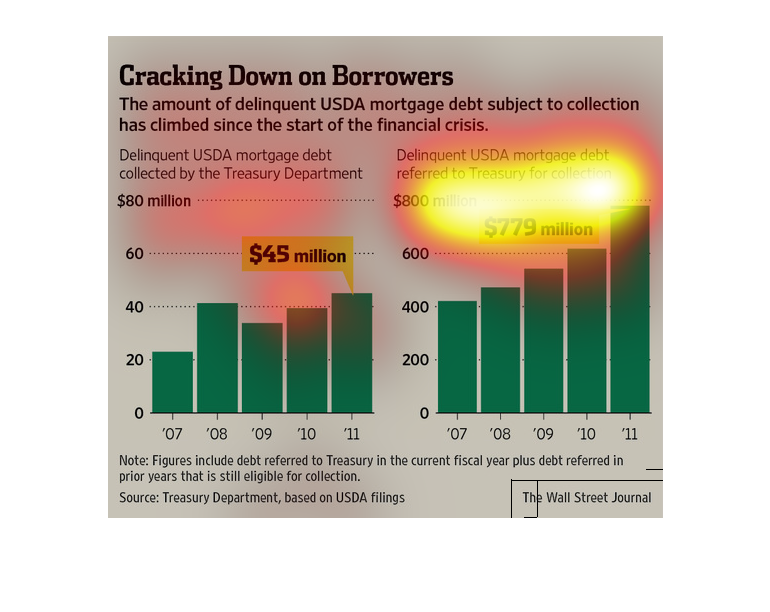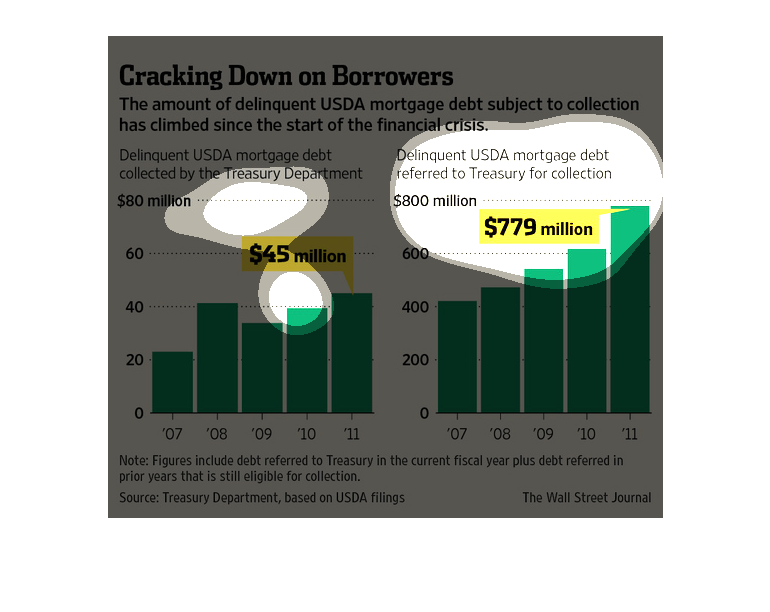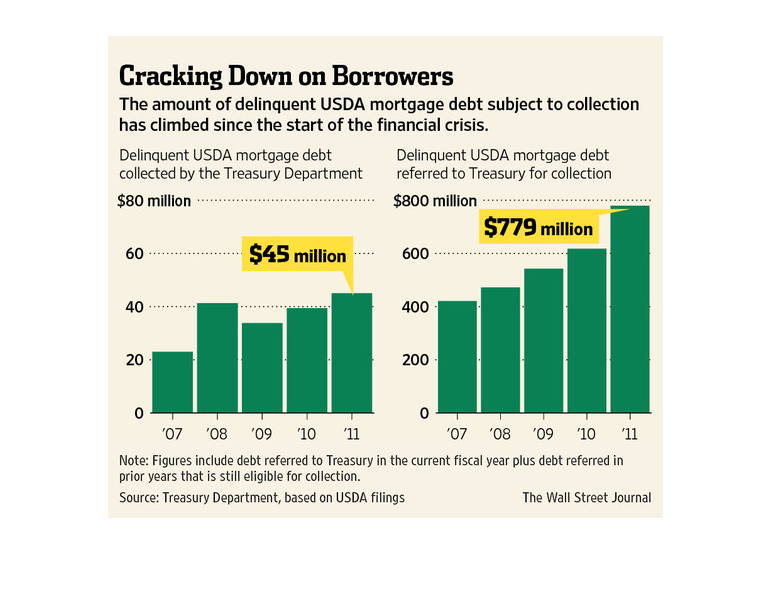
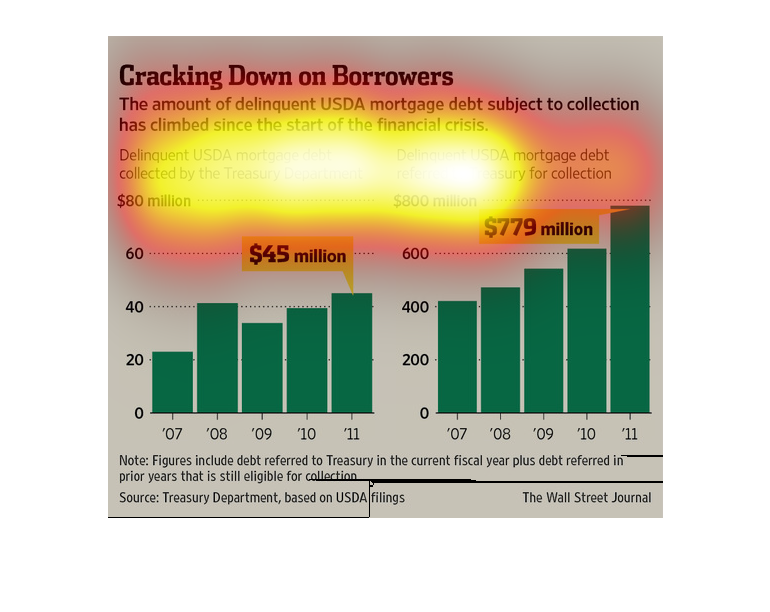
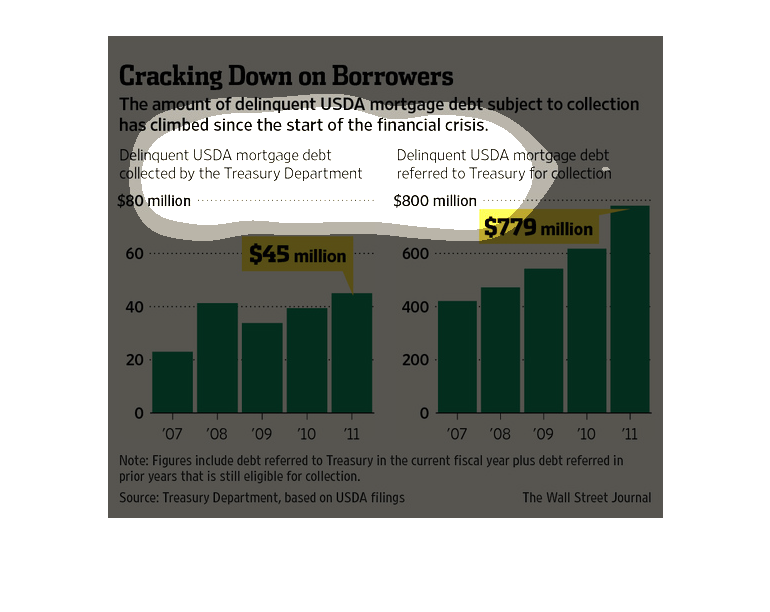
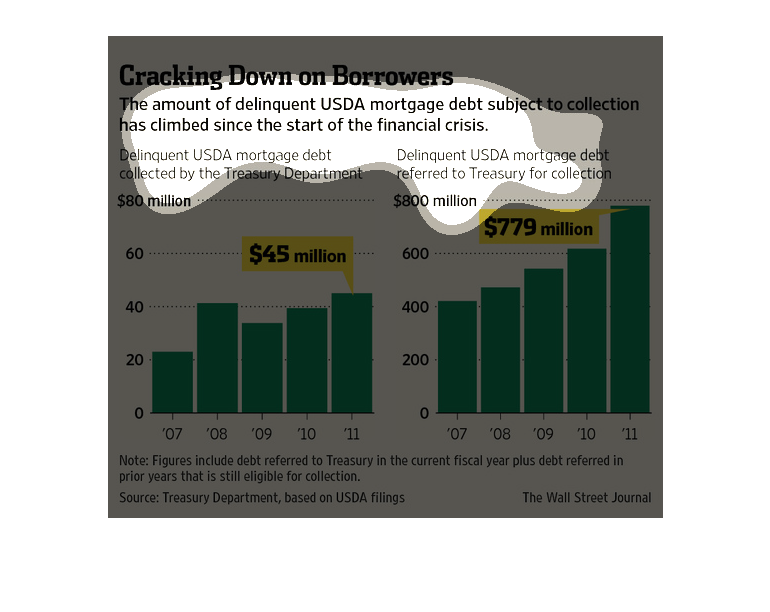
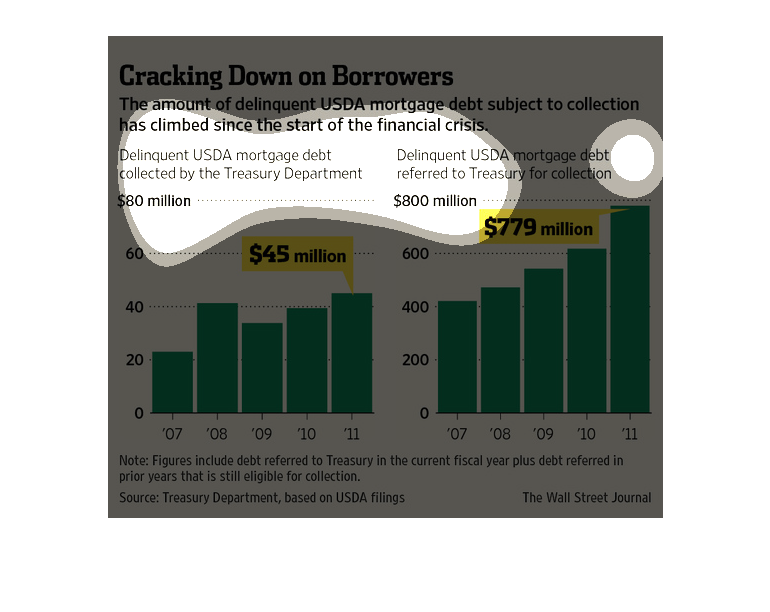
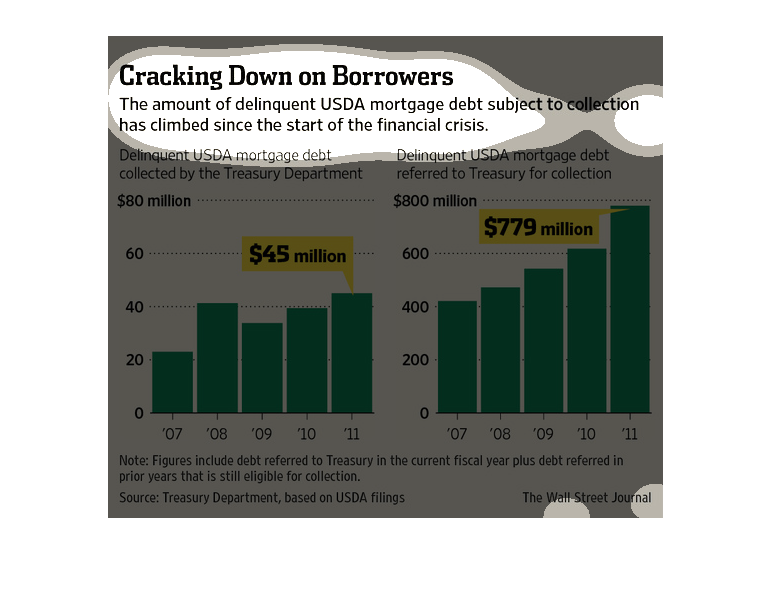
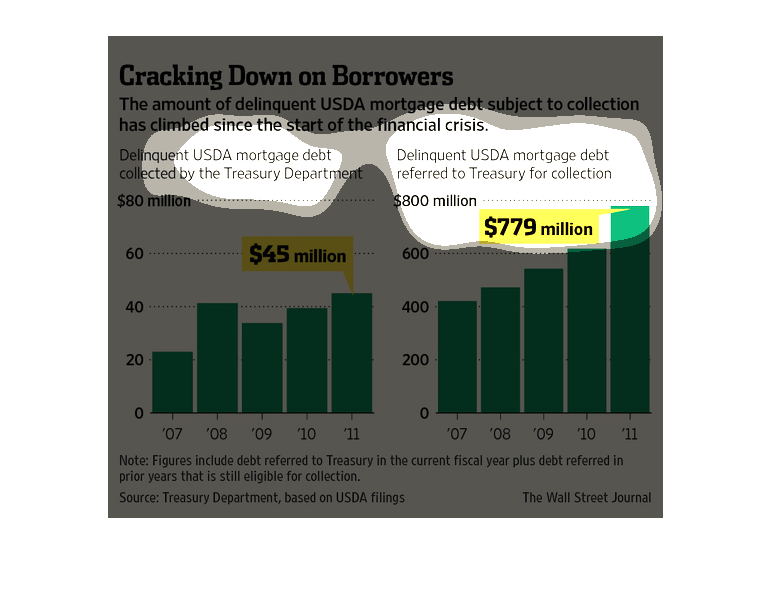
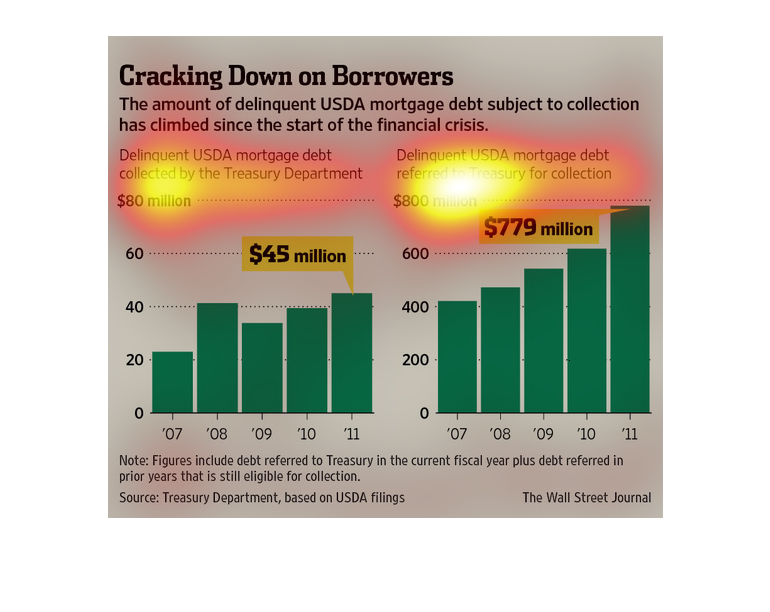
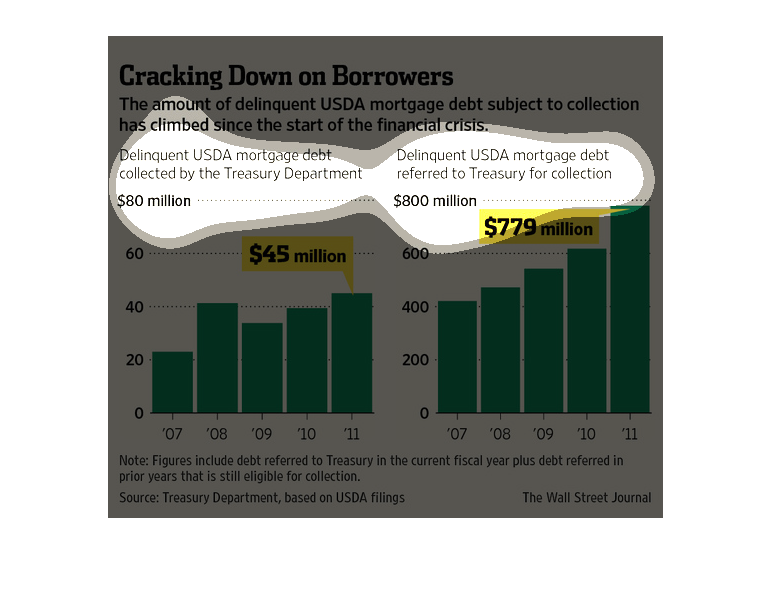
This chart is titled Cracking Down on Borrowers. It says that the amount of delinquent USDA
mortgage debt subject to collection has climbed since the start of the financial crisis.
The image depicts the amount of delinquent USDA mortgage debt subjected to collection having
increased since the start of the financial crisis in the US. Mortgage debt is at 45 million,
while delinquent debt is at 779 million.
This article is about the amount of delinquent USDA mortgage debt subject to collection. The
amount has risen since the start of the financial crisis. On the bottom there is 2 graphs
with 2 numbers highlighted.
This is a bar graph showing the amount of delinquent USDA Mortgage debt that has been subject
to collection since the mortgage crash a few years back between 2007 and 2011.
This is a chart giving information about mortgage debts that need collecting are rising since
a financial crisis occurred. There are two charts showing referred mortgages and collected
ones, both are increasing over time.
In this study conducted by the Wall Street Journal, we see the cracking down on borrowers
on all whole score of funds recouped by the goverment and its collection agencies.
This chart from the Wall Street Journal shows how federal regulators are cracking down on
delinquent USDA agriculture mortgages and how defaults are rising
This image shows two charts depicting money owed to the USDA for loans on mortgages. The text
states that the USDA is cracking down on borrowers since the financial crisis.
This chart from the Wall Street Journal shows how the delinquent borrowers of USDA loans has
increased dramatically since the end of the financial crisis
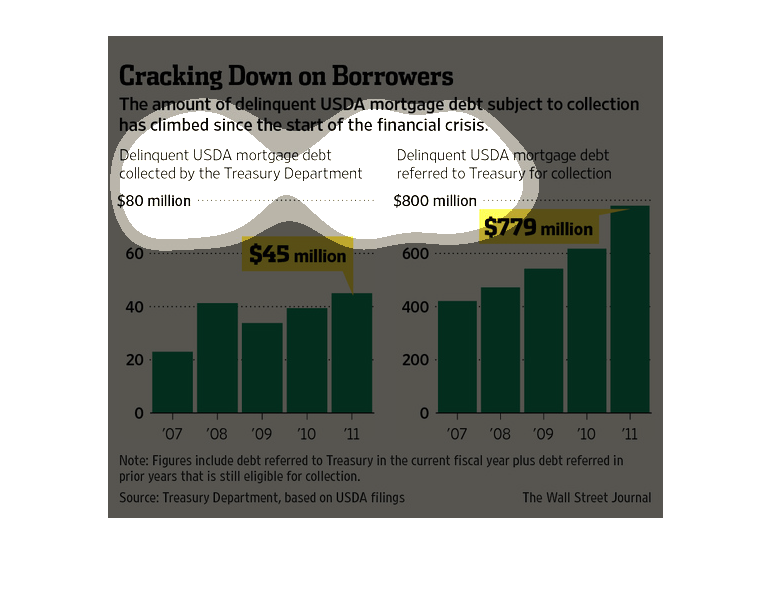
There are two graphs in this image. The left one displays mortgage debt collected by the treasury
department. In 2007, the debt was about 20 million dollars. In 2011, the last date in the
graph, it has climbed to 45 million.  The right graph displays mortgage debt referred to the
treasury for collection. In 2007 it was about 400 million dollars. In 2011 it climbed to 779
million dollars. These two graphs show that since the financial crisis in 2007 delinquent
mortgage debt subject to collection has risen.
This image about about the debt crisis and how the amount of USDA mortgage deliquencies subject
to collection has increased.  The two separate bar charts confirm this fact in absolute terms
(eg, $779 million has been deliquent in recent times - 2011)
This shows how many billion of dollars that are currently delinquent with the USDA for mortgages,
it has one graph for the delinquent that they are able to collect and one for the new delinquent
debt that they  are trying to collect.
The image depicts the amount of delinquent USDA mortgage debt subject to collection has increased
since the start of the financial crisis. Collected debt has risen to 45 million, while referred
debt has increased to 779 million.