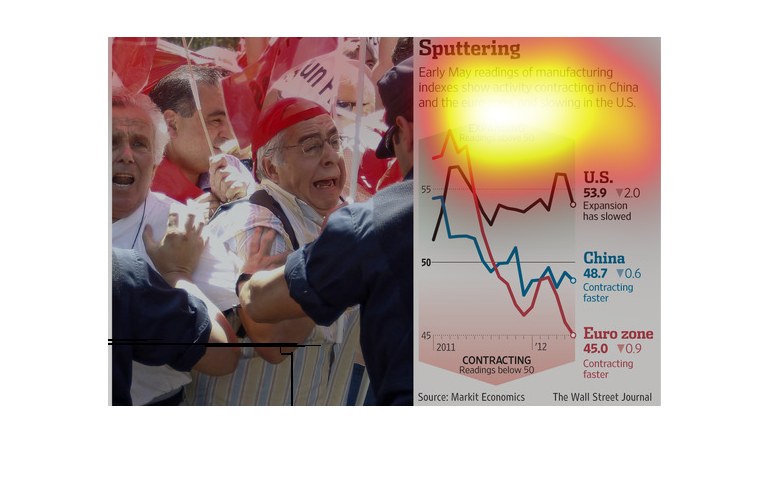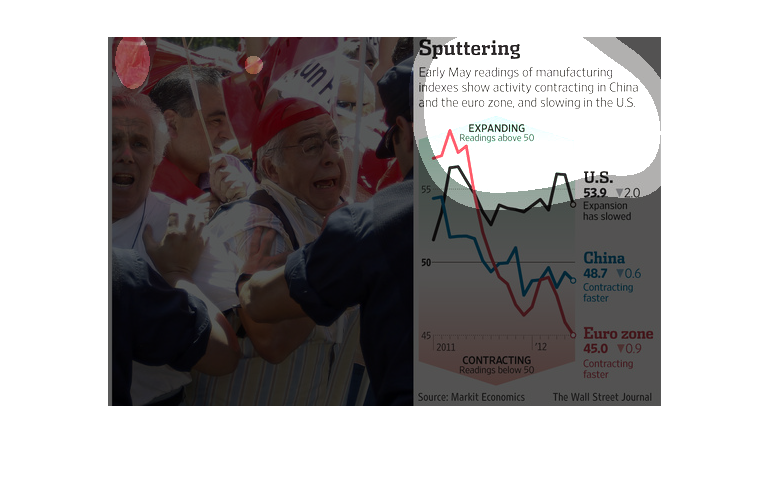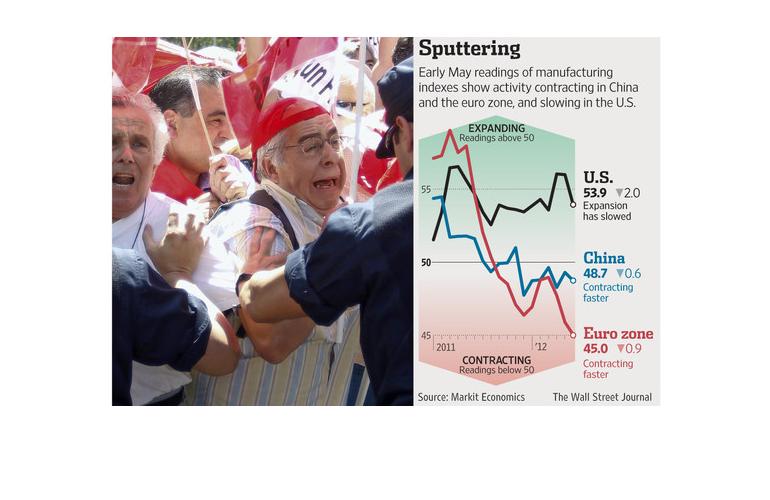
The figure presented to the left is titled Sputtering.  The figure is a representation of
the statistical research data for activity contracting in China.
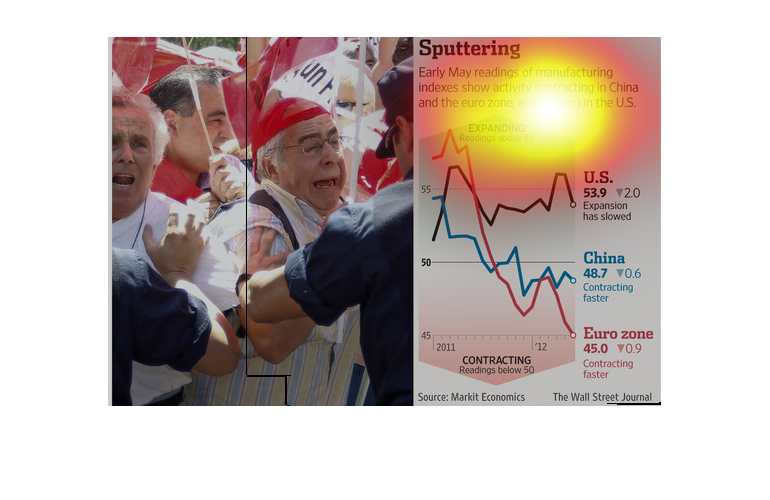
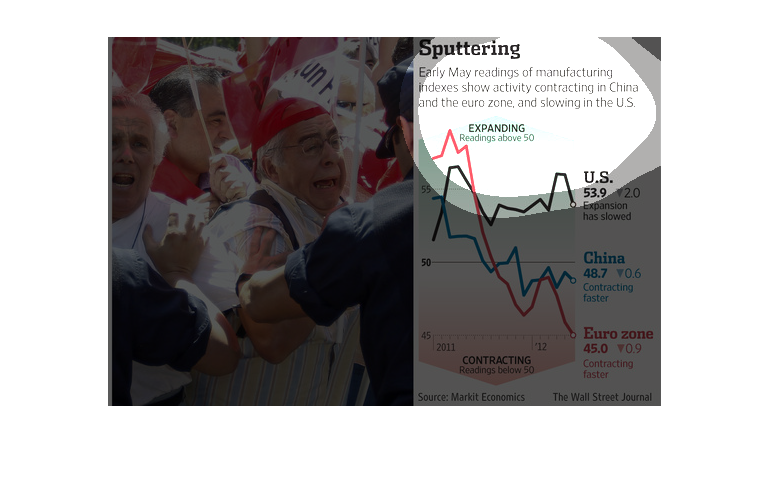
Early May readings of manufucturing indexes show activity contracting in the Eurozone and
China (of which, the Eurozone is contracting faster), and for expansion to slow in the United
States.
The image depicts statistics in early may manufacturing indexes show activity contracting
in both China and the eurozone, while also slowing in the US. The numbers appear to be declining
overall.
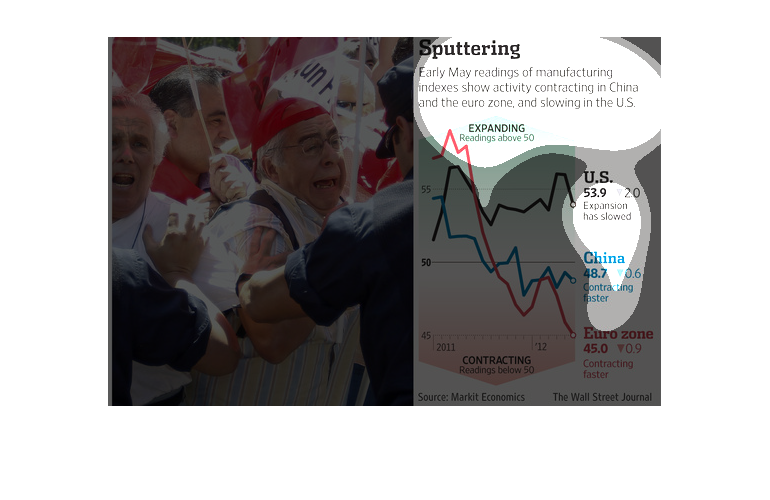
This chart describes sputter. Specifically,early May readings of manufacturing indexes. The
chart contains photographs to enhance the information presented.
This chart describes and depicts the month of may's reading of manufacturing indexes contracting
in the country of china and the euro zone, and the slowing us.
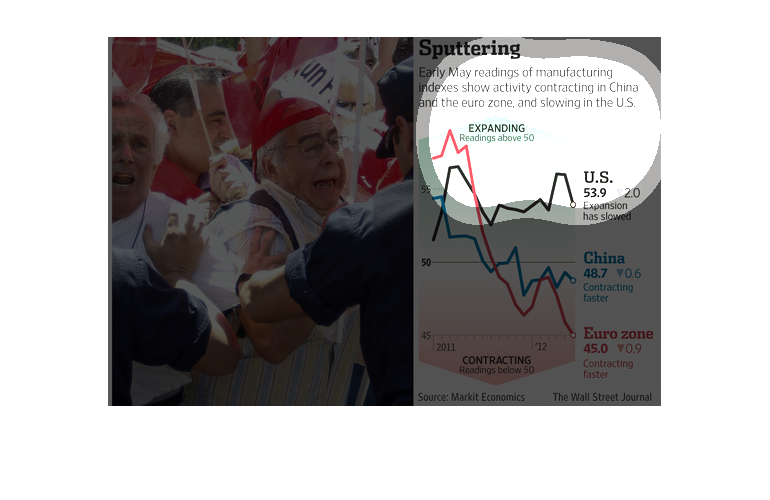
This chart from the Wall Street Journal shows how the manufacturing sector in China is experiencing
a significant slowdown which has repurcussions around the world
This is an image with a split-screen. To the left is a photo of industry leaders. To the right
are figures that speak of May's manufacturing indexes contracting in China and the Eurozone,
and slowing in the US.  A graph accompanies and backs up this claim.

The image depicts the early may statistics of manufacturing indexes showing activity contracting
in China and the euro zone, and also slowing in the US.
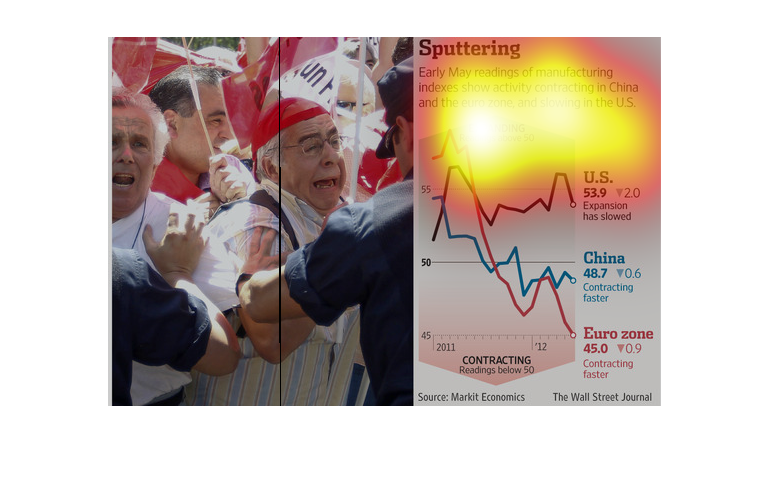
This chart illustrates the contraction of manufacturing industries in China, the Euro Zone,
and the United States.  It compares the contracting between regions from 2011 to 2012.
Sputtering | early may reading of manufacturing indexes show activity contracting in china
and the euro zone and slowing in the United States, although euro zone shows no sign of even
near stability.
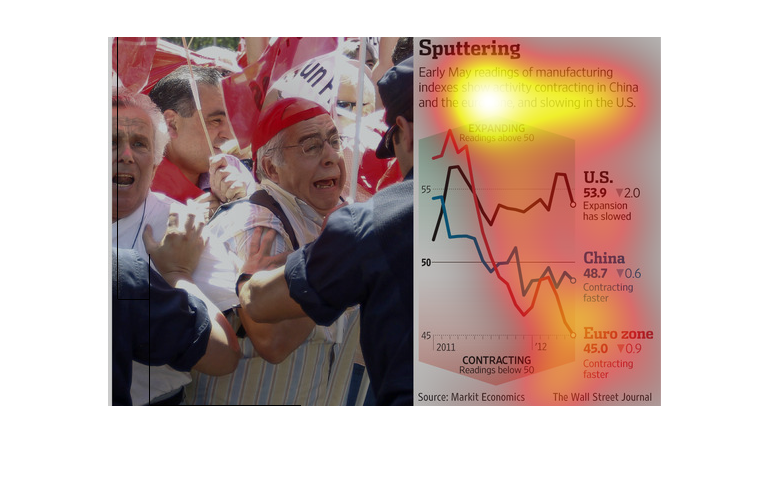
This graph represents the readings of manufacturing indexes showing activity in China and
the euro zones compared to the United States.  It highlights the increase in contracting in
China and euro zones while expansion has slowed in the US.
This chart is titled Sputtering. I says that early May readings of manufacturing indexes show
activity contracting in china and the euro zone, slowing in the US.
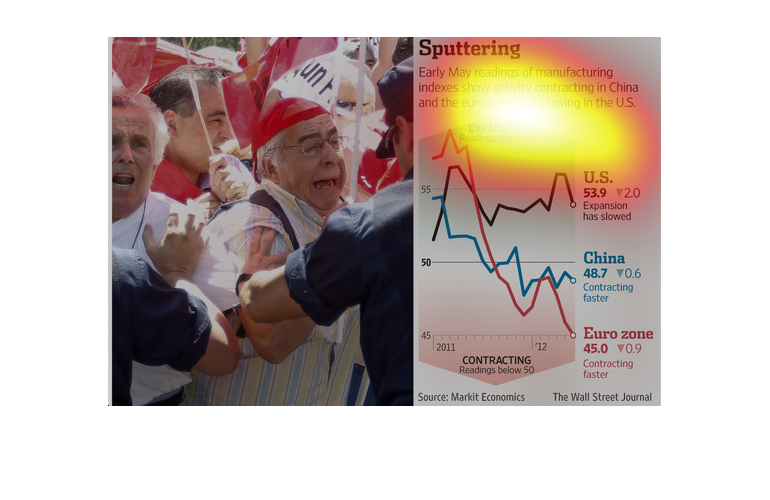
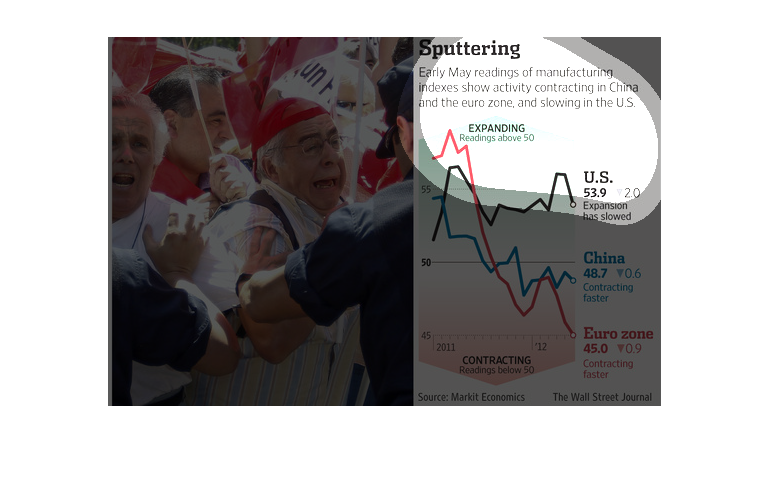
The figure presented is titled Sputtering.  The figure is a representation of the statistical
data for activity of manufacturing indexes with regard to US and China.