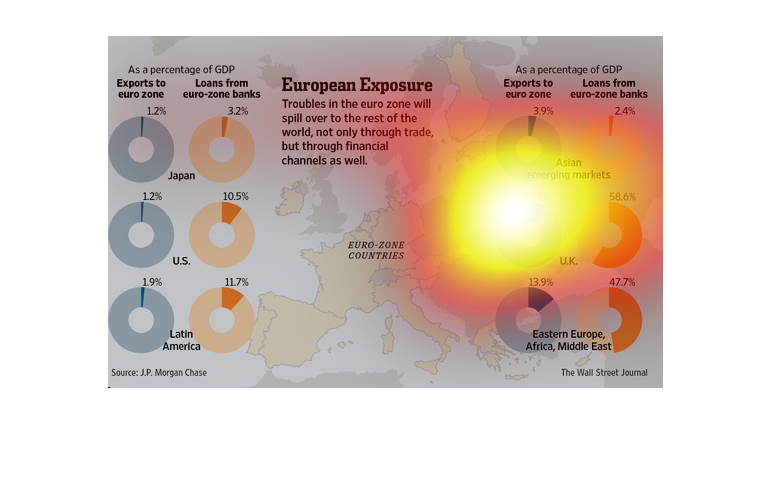
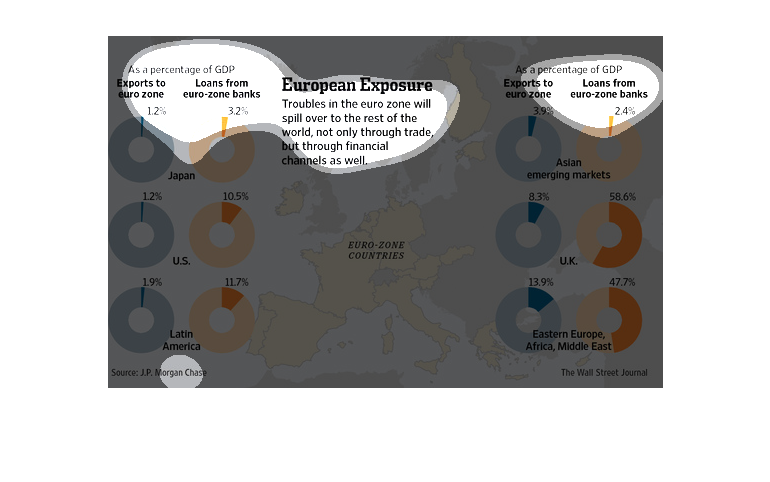
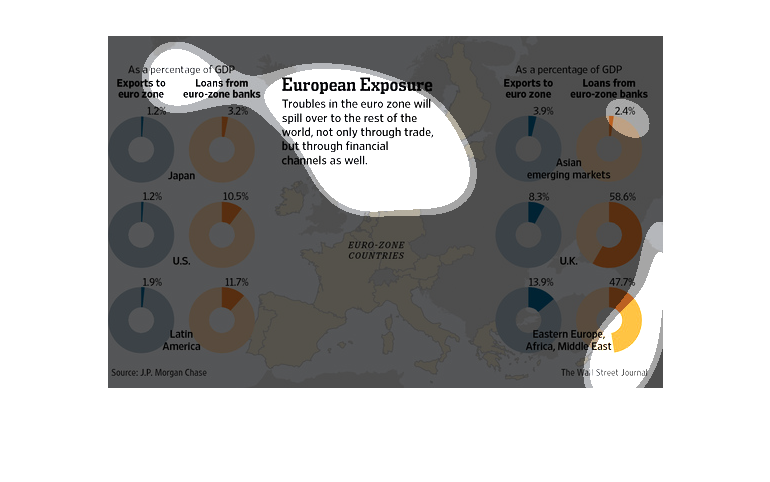
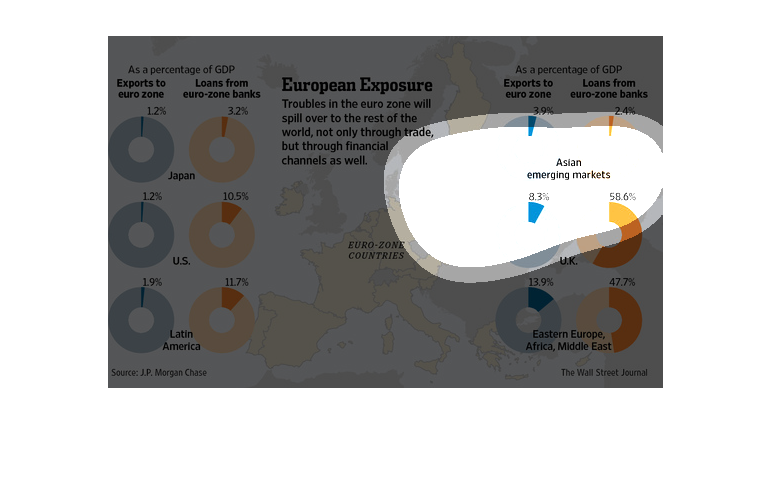
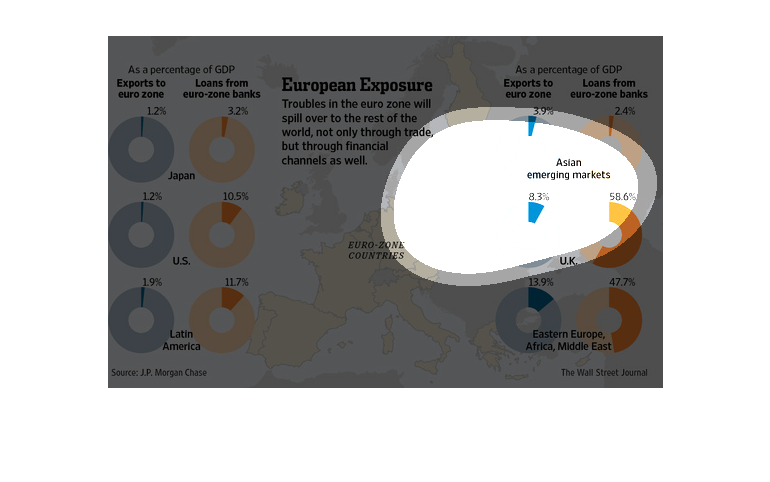
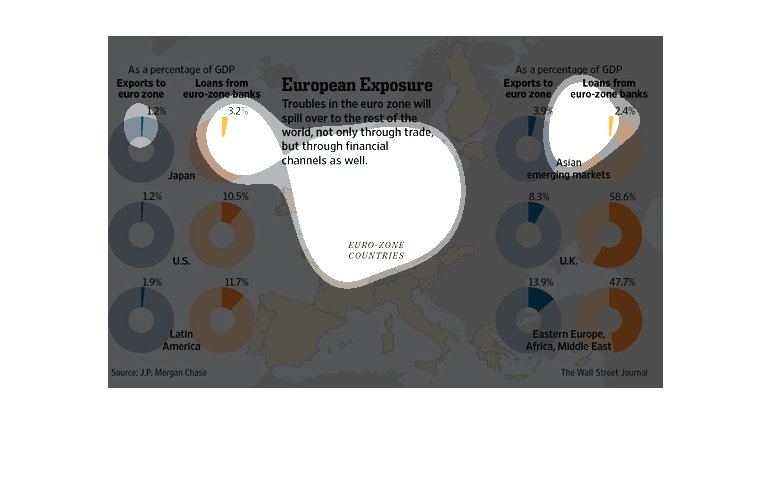
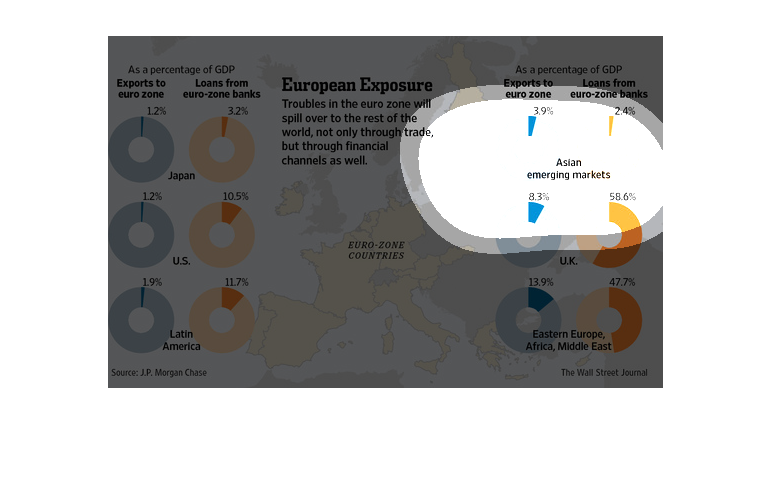
This image is entitled "European Exposure." It shows that troubles in the euro zone will
spill over to the rest of the world, not only through trade, but through financial channels
as well. A map labeled "Euro-Zone Countries" is in the center of the image. Exports to euro
zone and loans from euro-zone banks (Japan, U.S. and Latin America) are on the left. The
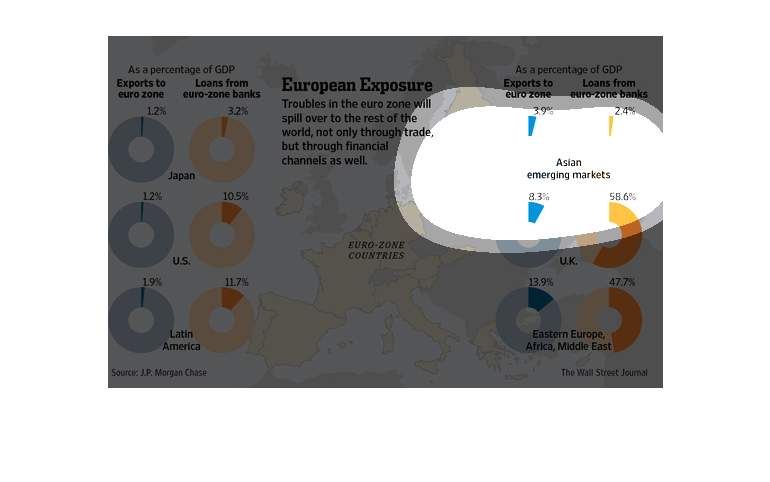
same data is shown on the right for Asian emerging markets, U.K., and Eastern Europe/Africa/Middle
East. The source for this data was J.P. Morgan Chase. This image appeared in The Wall
Street Journal.
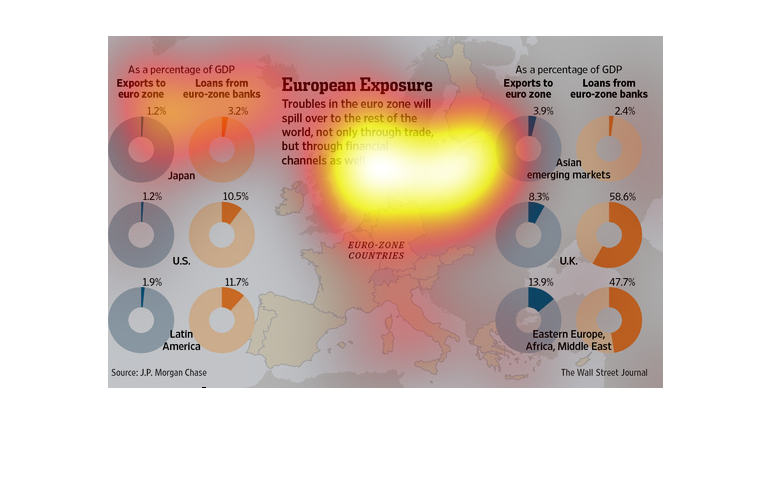
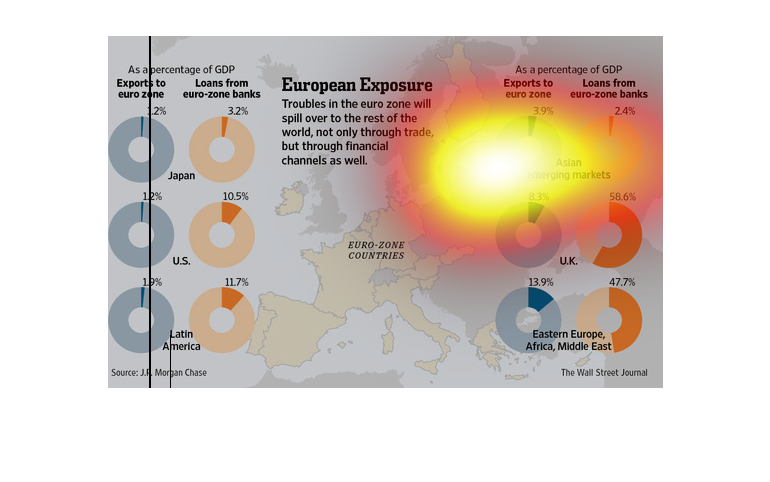
The image depicts the troubles in the Eurozone spilling over into the rest of the world. Trade
as well as financial channels will be effected by the Eurozone crisis.
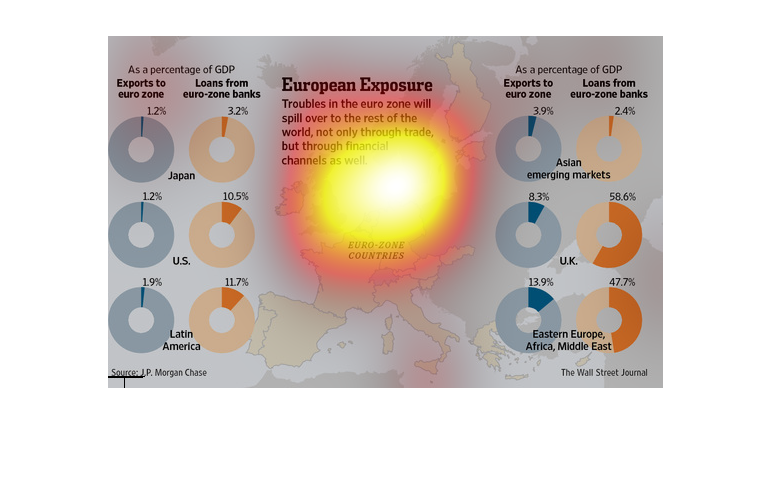
This chart from the Wall Street Journal shows how many european countries have banks exposed
to the sovereign debt crisis and something needs to be done
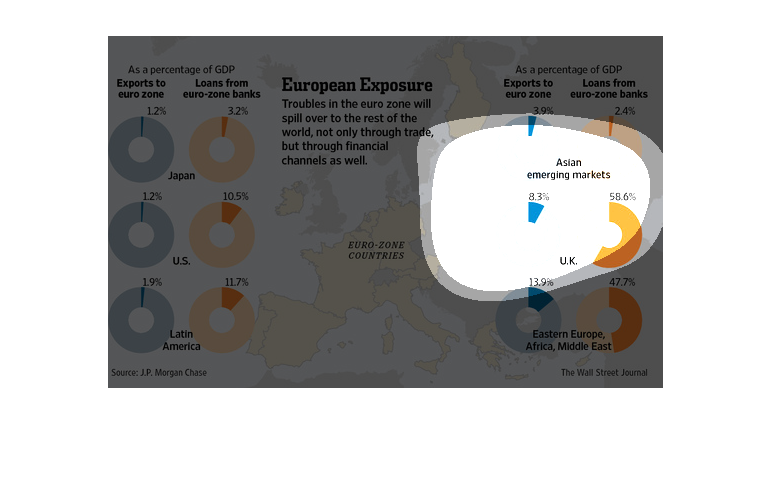
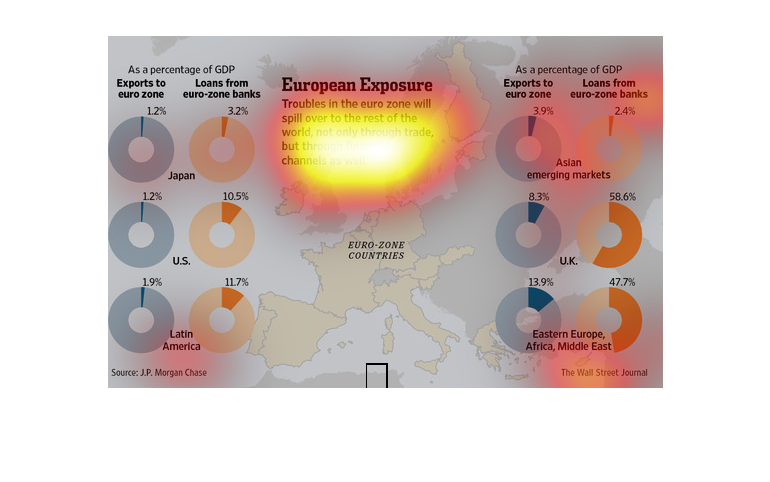
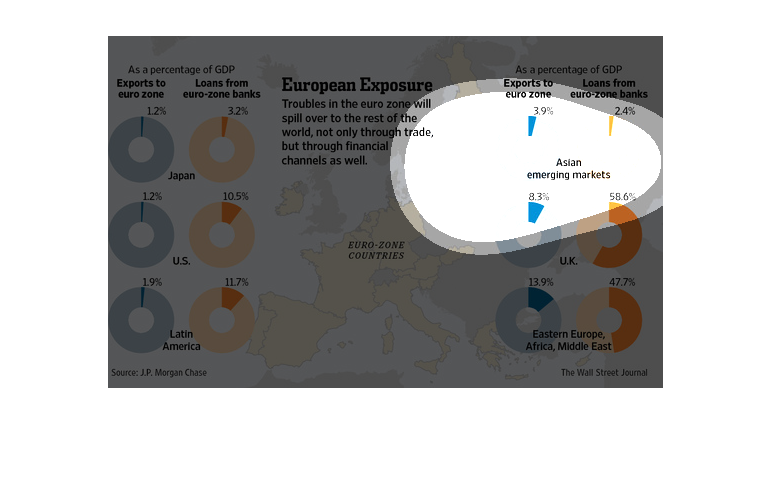
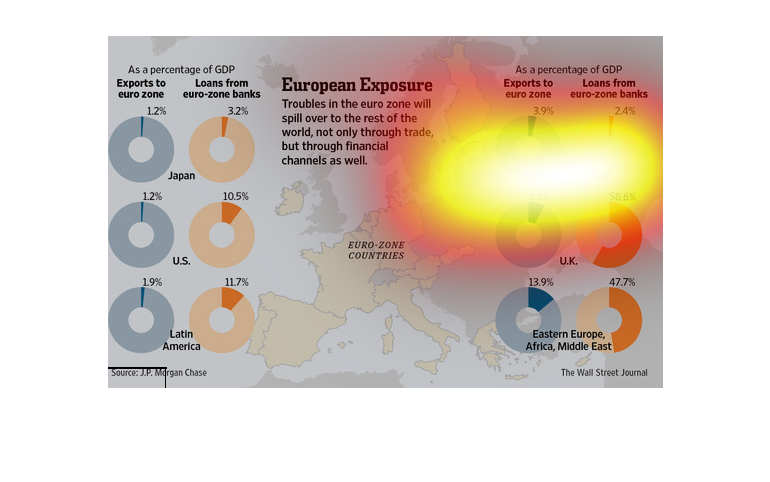
These graphs depict the troubles in the euro zone  that will spill over to the rest of the
world, not only through trade, but through financial channels as well, particularly Eastern
Europe, Africa, and the Middle East in exports and loans from euro-zone banks.
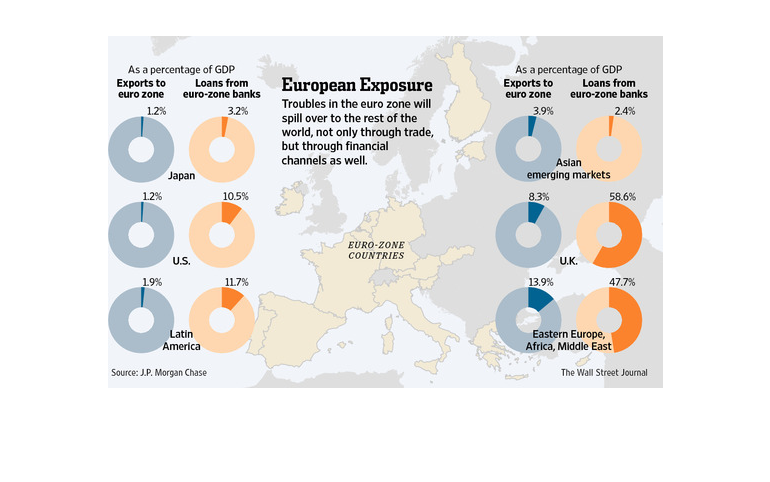
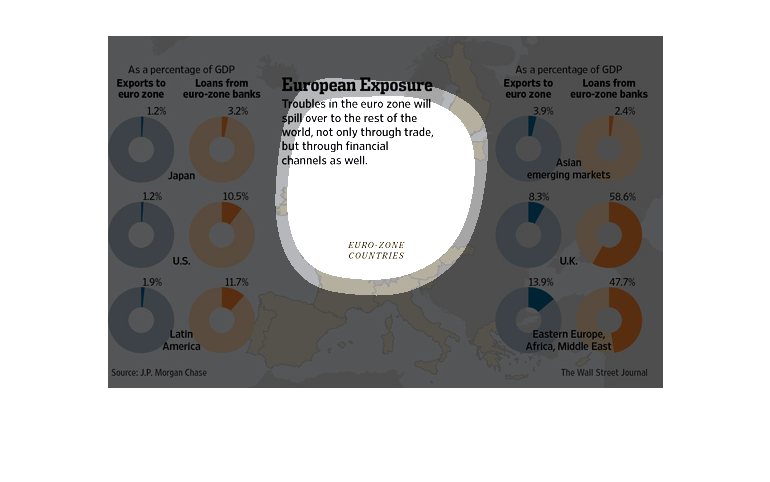
This chart is titled: European Exposure. Troubles in the Euro zone will spill over to the
rest of the world, not only through trade, but through financial channels as well.
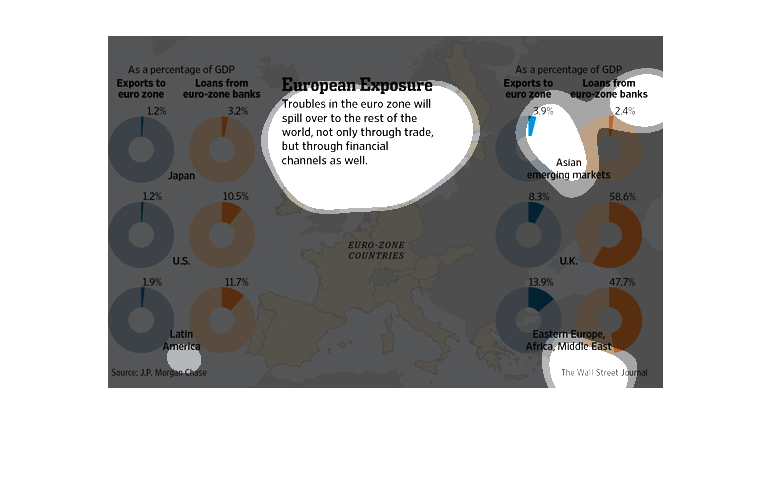
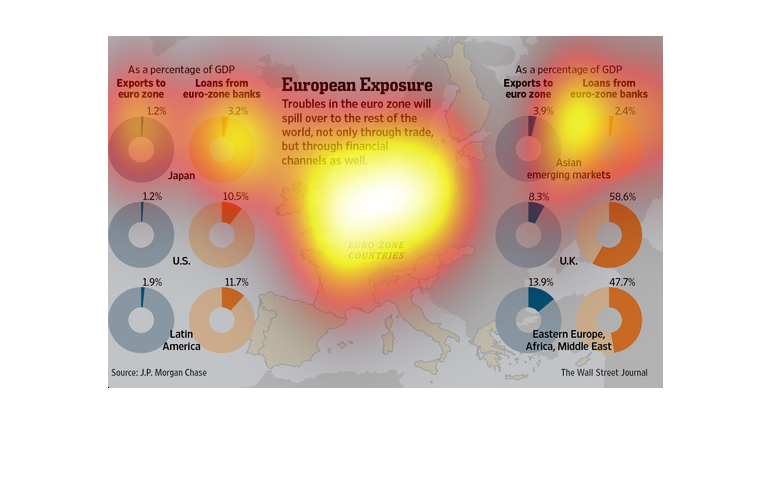
This image shows several graphs explaining how changes in the European economy will have world
wide effects on trade. A map of the euro zone is also shown for reference.
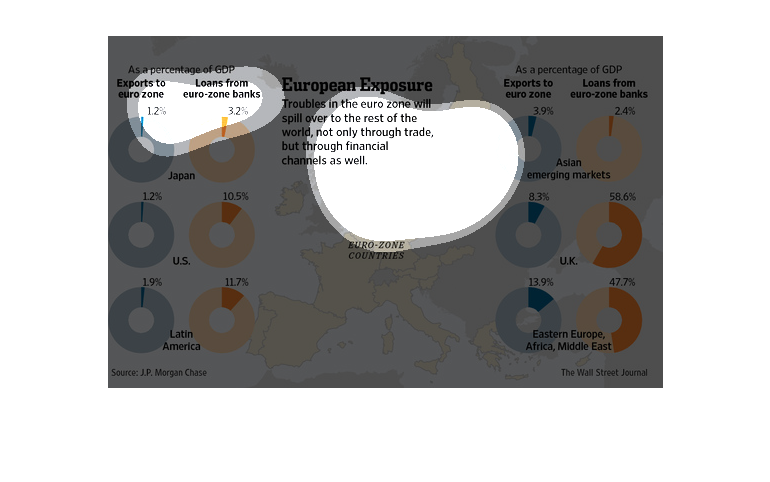
This is a graphic that is being used to illustrate that the troubles in the Eurozone are very
likely to spill over to the rest of the world through trade and bank channels.
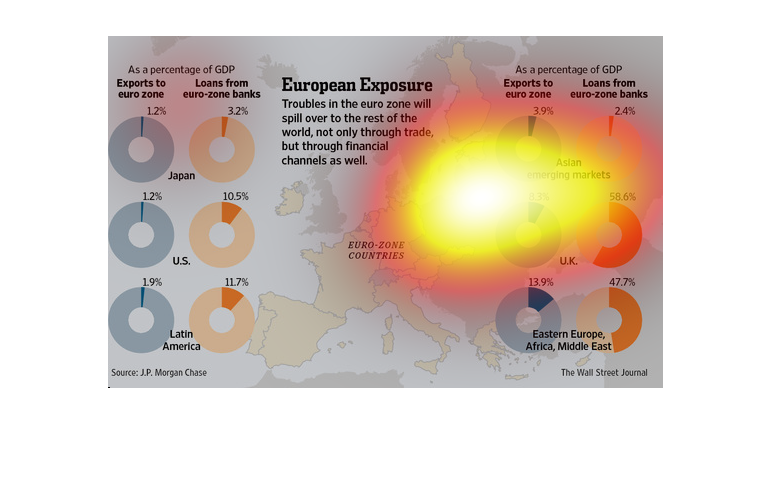
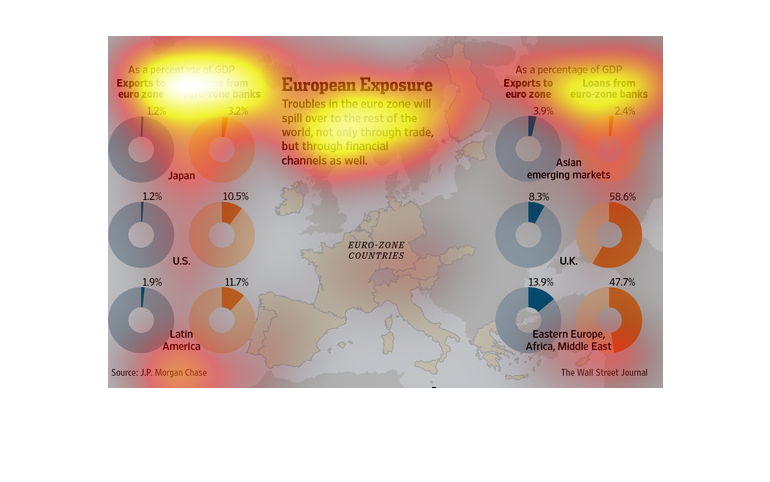
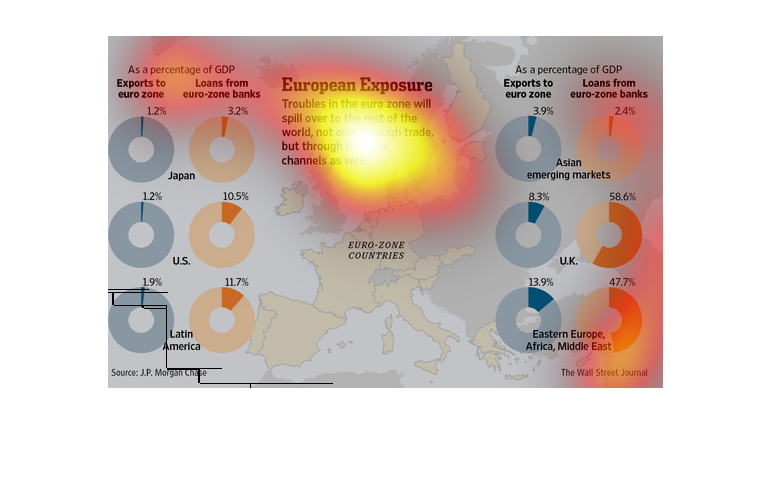
The figure presented to the left is titled European Exposure.  The figure is a representation
of the statistical data for troubles in the Euro Zone and how they affect the world.
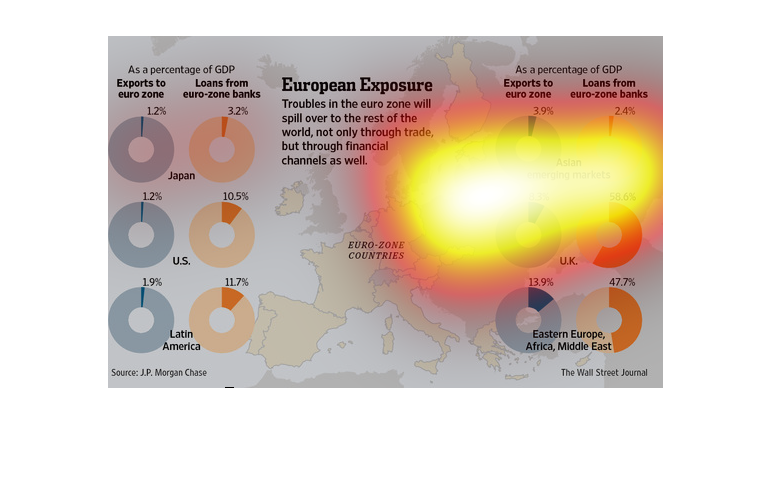
The Euro Zone troubles will spill over to the rest of the world through trade.  The small
graphs set against a map of Europe, back up this claim, showing the exposure of the rest of
the world to Europe through loans/debt to/fro Europe and by giving export data.
The figure presented is titled European Exposure. The figure is a representation of the statistical
data for the troubles of lives in the euro zone which will affect the world.
This chart describes European exposure. Specifically, troubles in the euro zone will spill
over to the rest of the work. Different categories are represented by different colors.
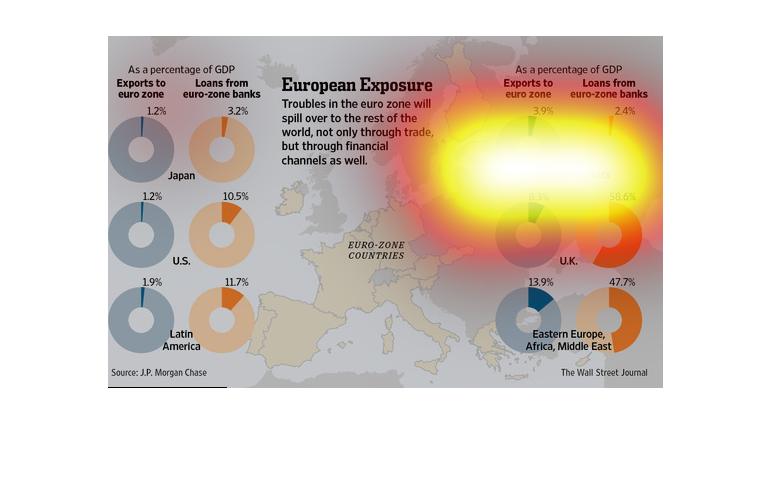
This chart from the Wall Street Journal shows how the european debt crisis may have impacts
on banks that are in other countries because banks own the bad debt