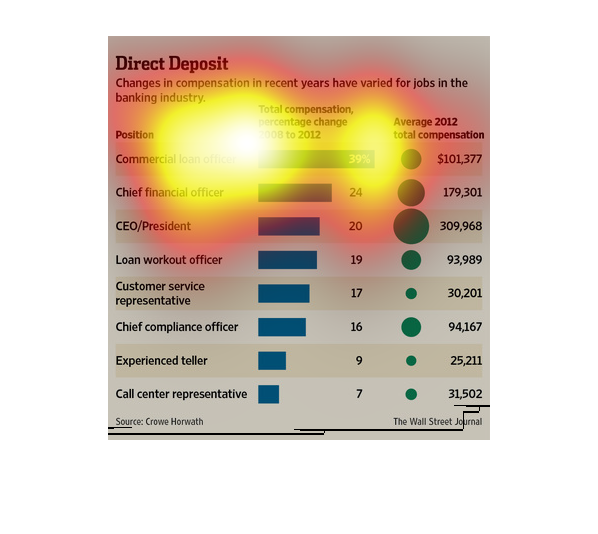
This graph shows how much compensation is given to the bankers and how much they make in each
of the areas (commercial loans and also) compares the compensation in recent years vs in 2012.
In this study done by the Wall Street Journal- from sources within Crowe Howard- We see that
direct deposit is on the rise, and it is a great benefit to workers.
This chart from the Wall Street Journal shows how the major senior officers at companies in
the United States are seeing larger increases in overall pay
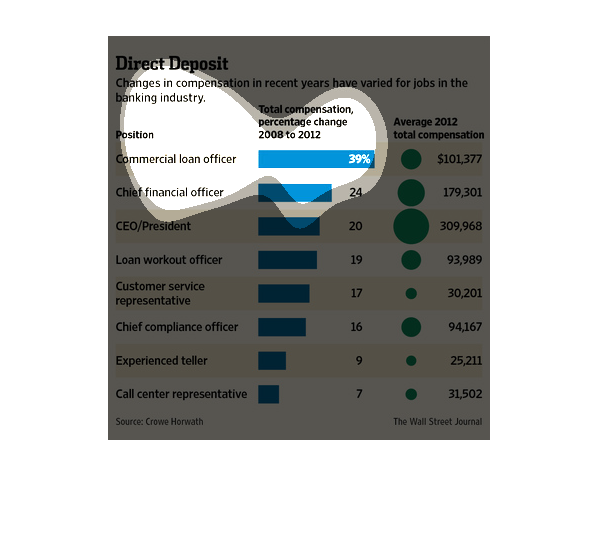
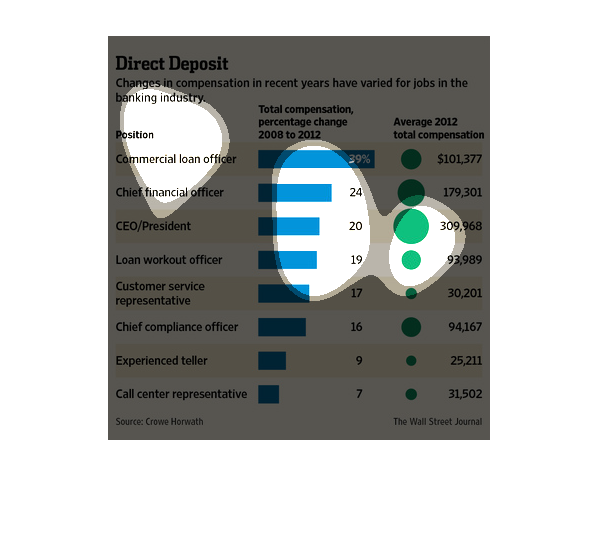
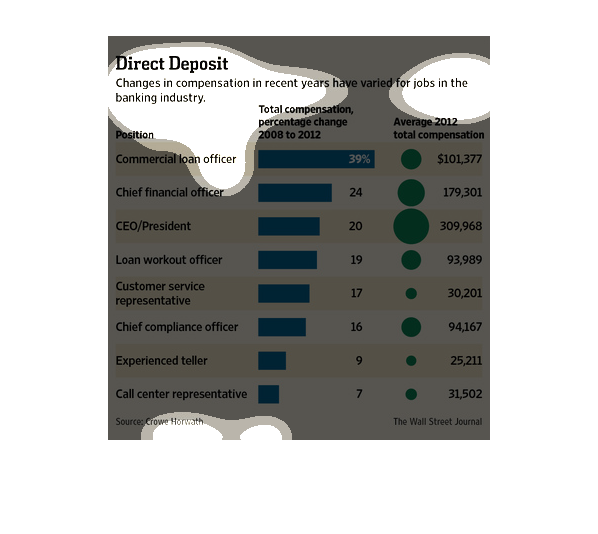
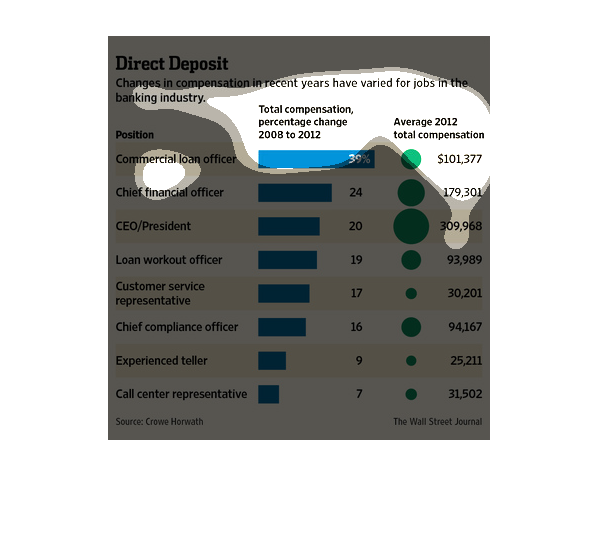
This graph shows how changes in compensation in recent years have varied for jobs in the banking
industry.  It lists various positions on the far left of the image. with a horizontal columnar
graph out of blue describing "total compensation percentage change 2008 to 2012" in the middle
of the graph, and green dots showing "average 2012 total compensation" on the far right. It
is labeled clearly.  Green dots are varied in size according to compensation value.
The image depicts changes in compensation in recent years for jobs within the banking sector.
Among the jobs listed, commercial loan officers are making the most, while call center representatives
are making the least.
This graph represents the changes in positions within the banking field as a result of the
growing amount of direct deposits customers are using for payment at there jobs.
The chart shows change in compensation for different jobs in the banking industry from 2008
to 2012. The CEO has the highest average compensation in 2012, while commercial loan officer
has the highest change in compensation from 2008 to 2012.
This chart from the Wall Street Journal shows how average compensation for a variety of roles
int he banking community increased from 2010 to 2012.
An image titled "Direct Deposit" with blue bars and green circles. The blue bars are for different
jobs and how much compensation they get. The green circles are their average 2012 compensation,
getting bigger or smaller depending.
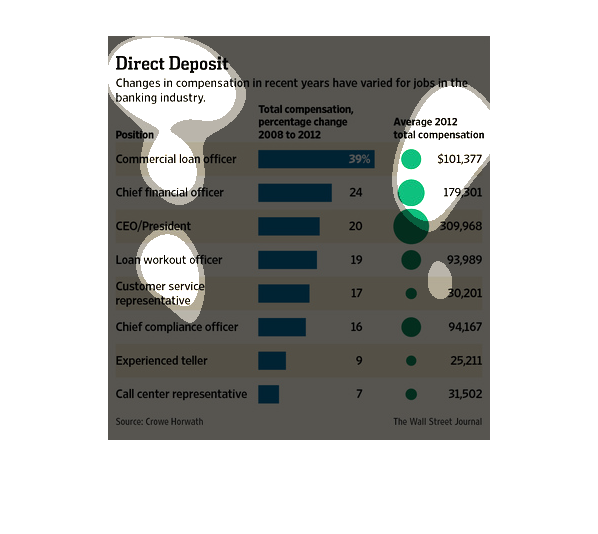
The chart depicts the rate at which compensation for different jobs in the banking industry
has changed from from 2008 to 2012.  The chart also provides the average rate of compensation
for each position in 2012.  Commercial loan officers have seen the biggest increase in compensation
over the 4 year time period, which is an increase of 39%.  The pay rate for call center representatives
has only increased 7% in the same amount of time.
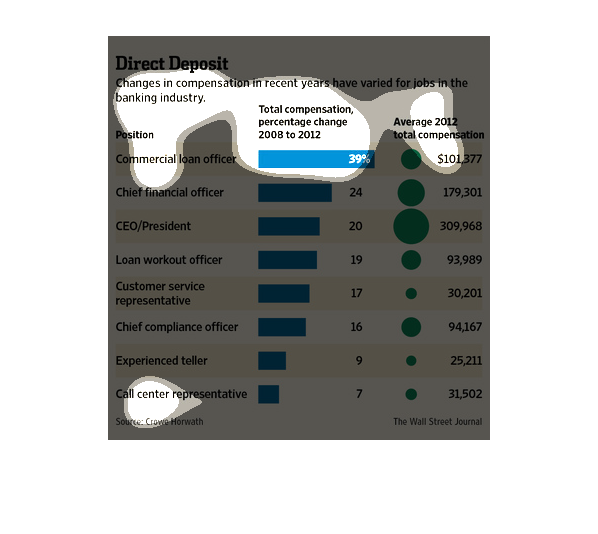
This is a long chart showing the total amount of compensation change based on many different
jobs listed on this chart. There is also a list of average compensation amounts per job.
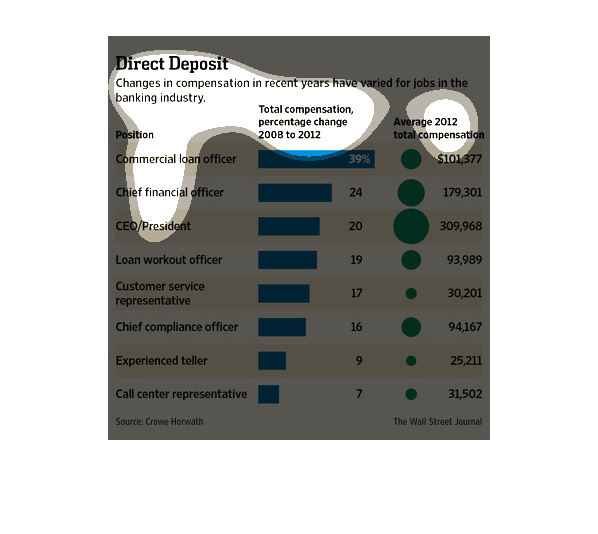
This studied conducted by the Wall Street Journal- from research obtained from the Crowe Horwath-
states that direct deposit is on the rise, and it is way more convenient than checks.
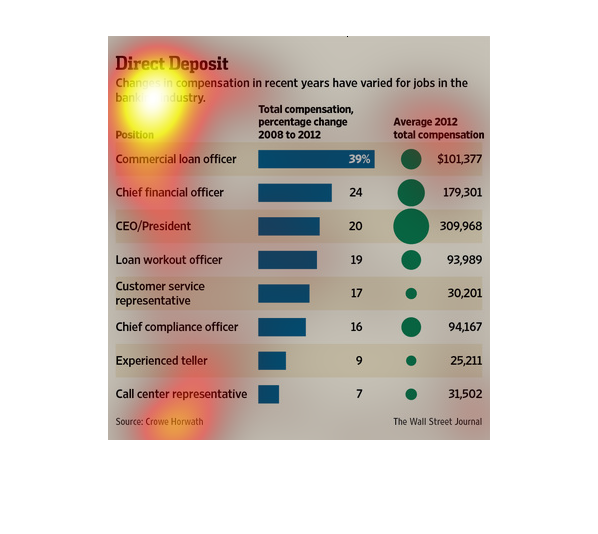
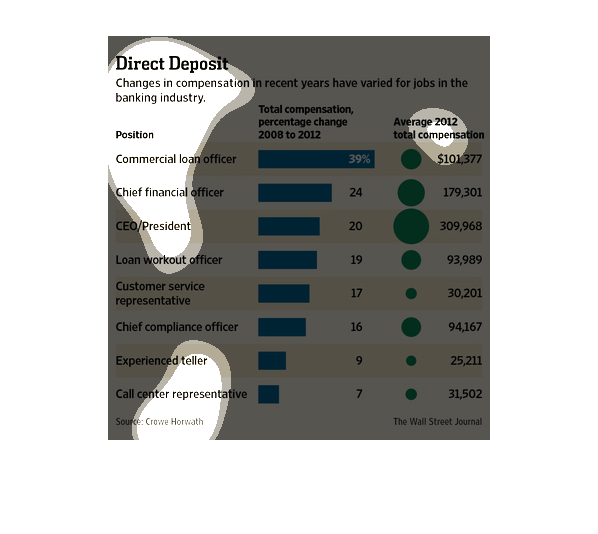
The figure presented is titled Direct Deposit.  The figure is a representation of the statistical
data for changes in compensation for recent years have varied for jobs.