This chart describes what is the fiscal cliff. Specifically, unless the law is changed fiscal
changes will take place. Different categories are represented by different colors.
This is a graphic that is mean to illustrate the areas that will need cuts unless the laws
are changed, or congress and the president find another way to trim the deficit on January
1st.
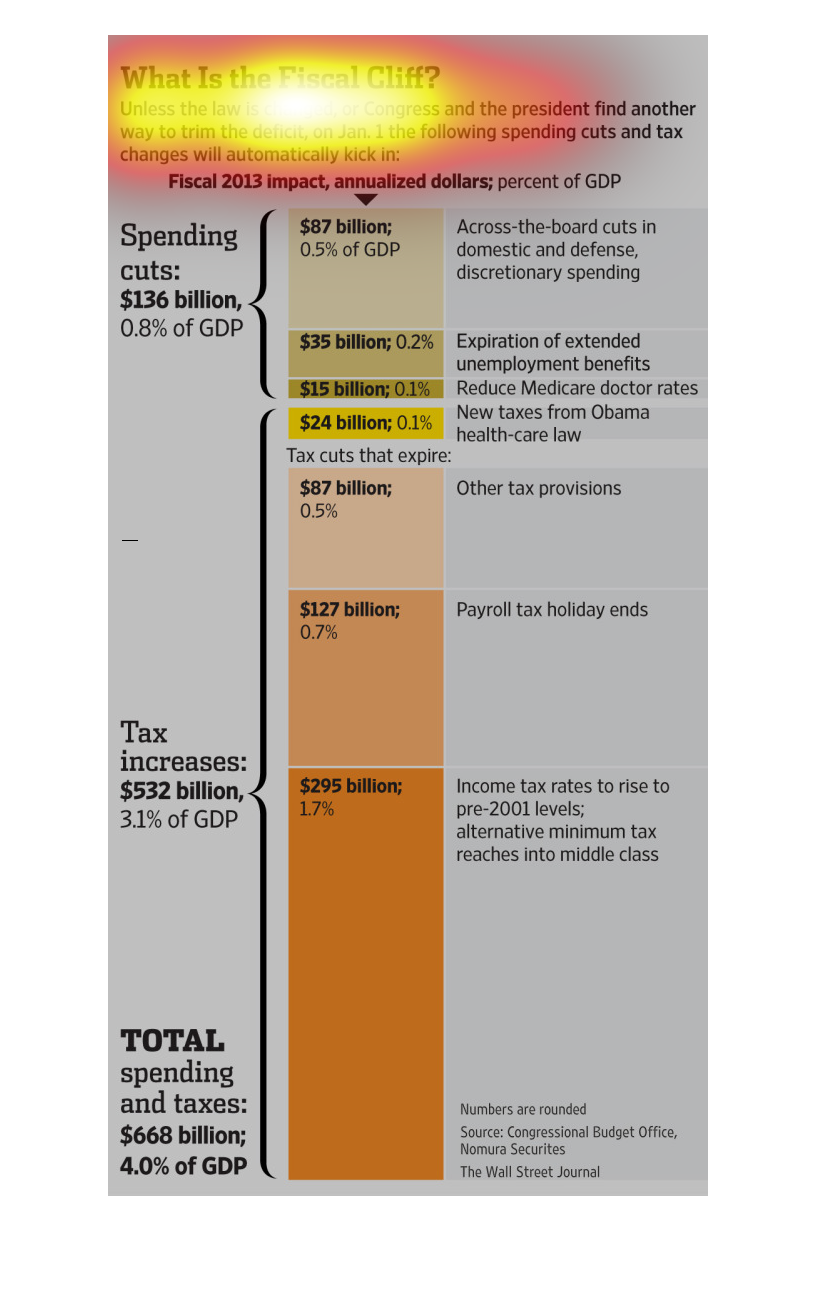
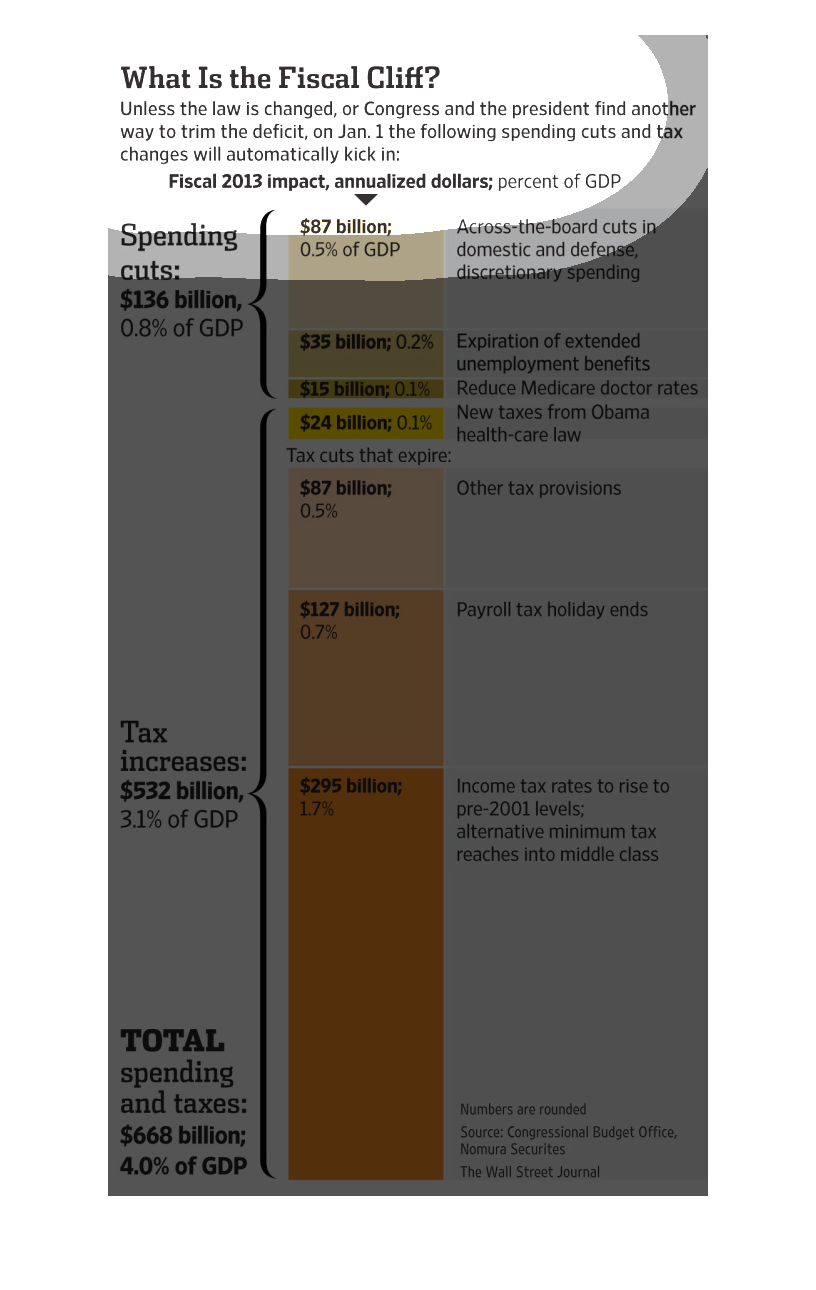
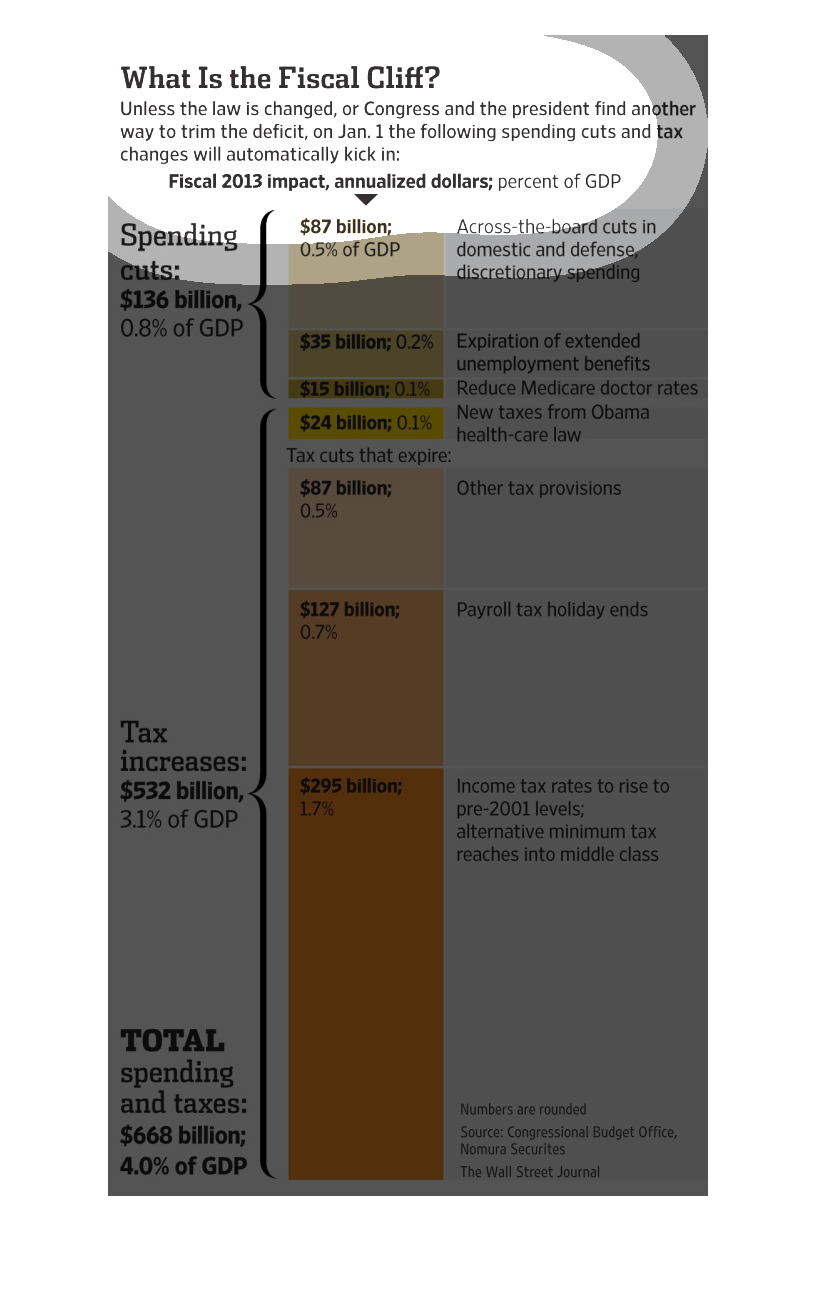
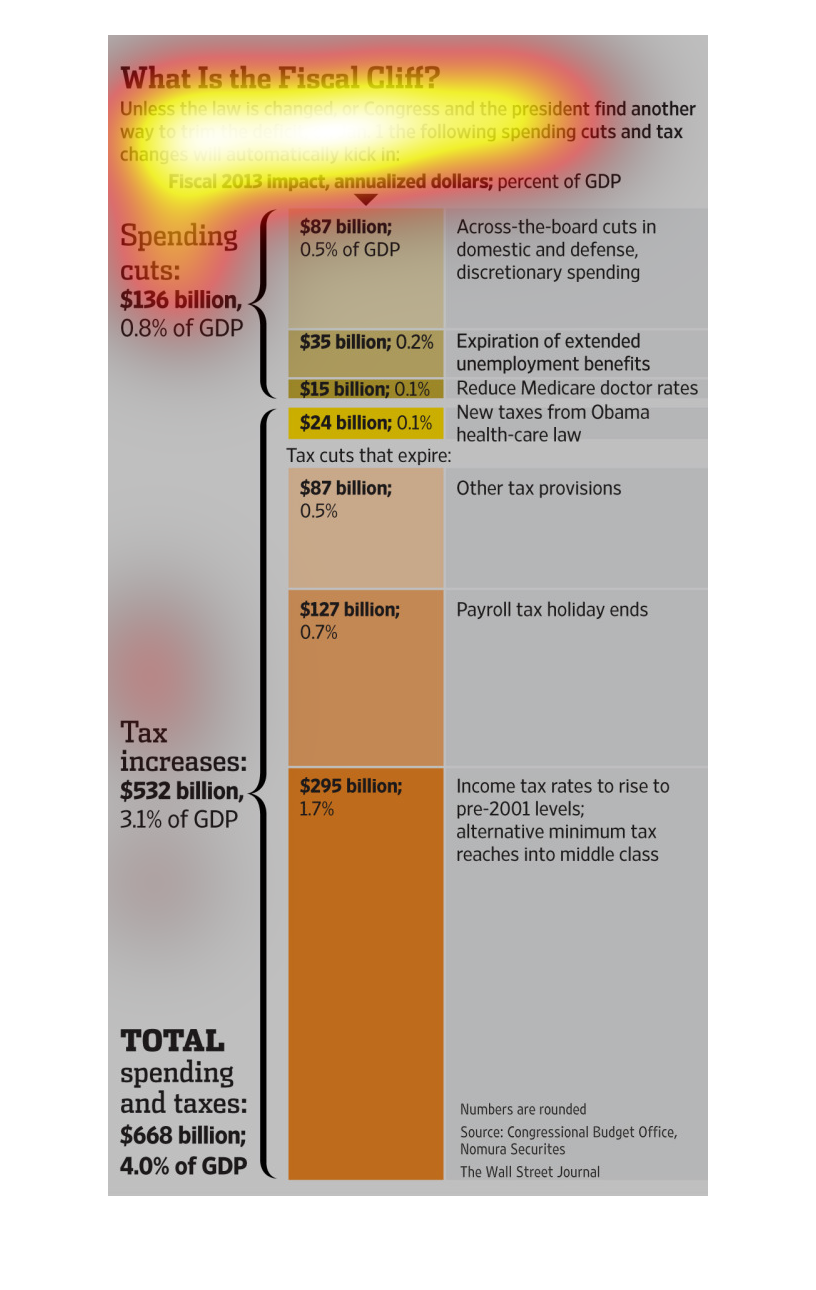
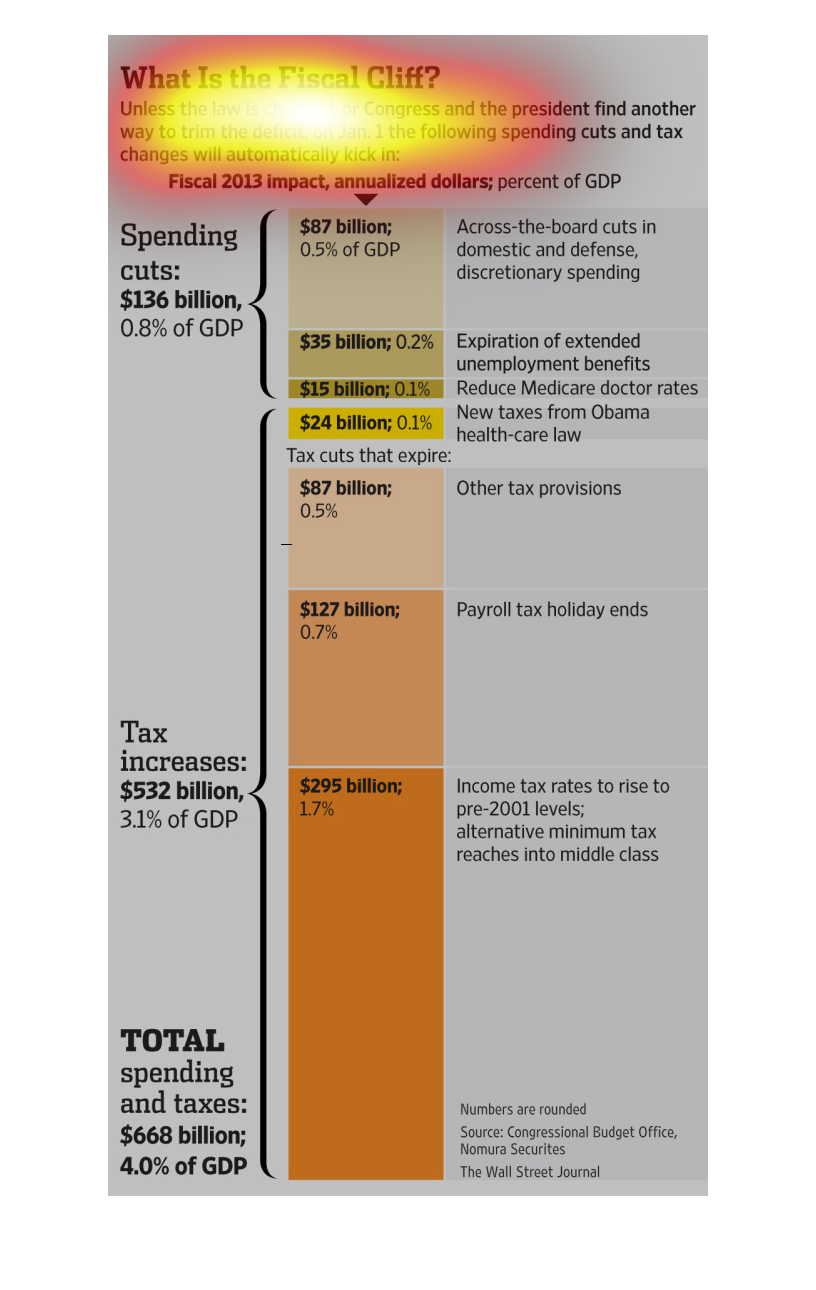
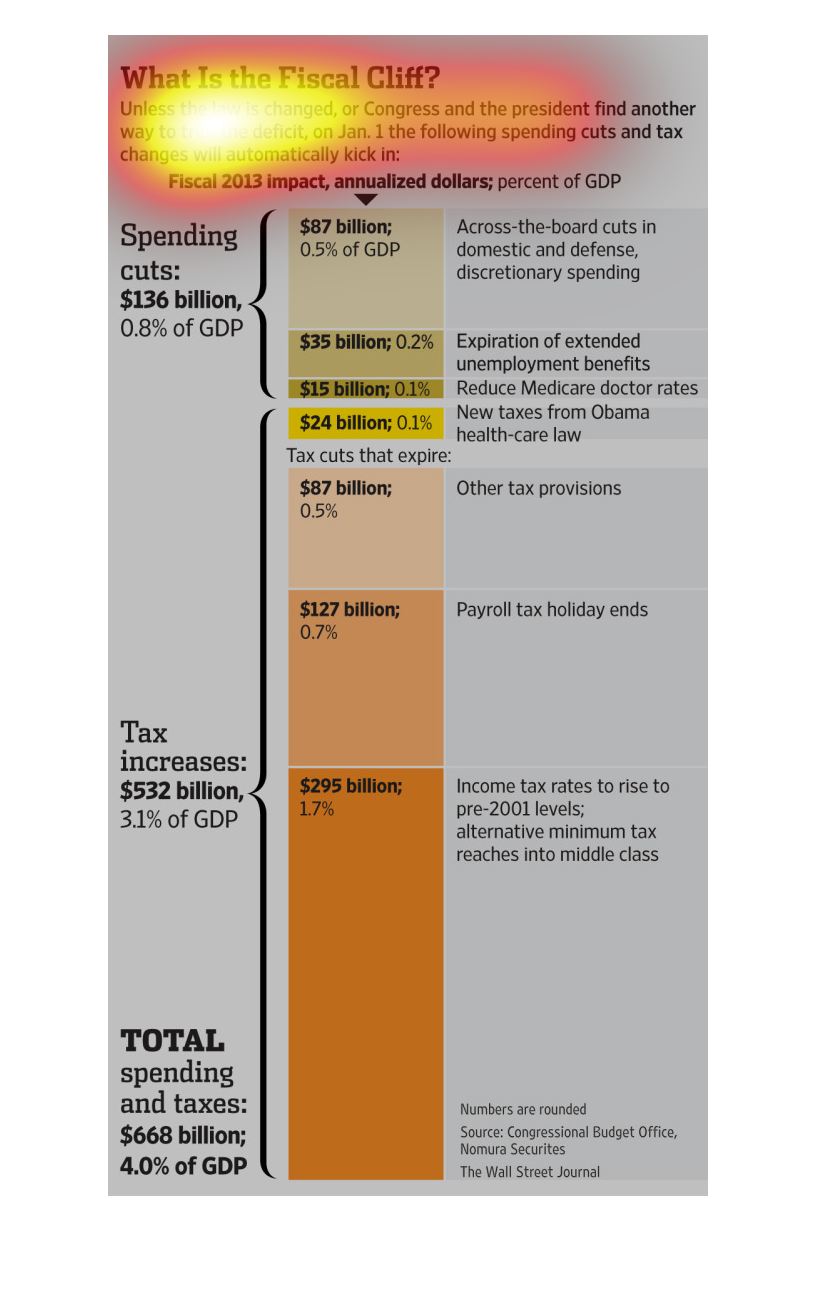
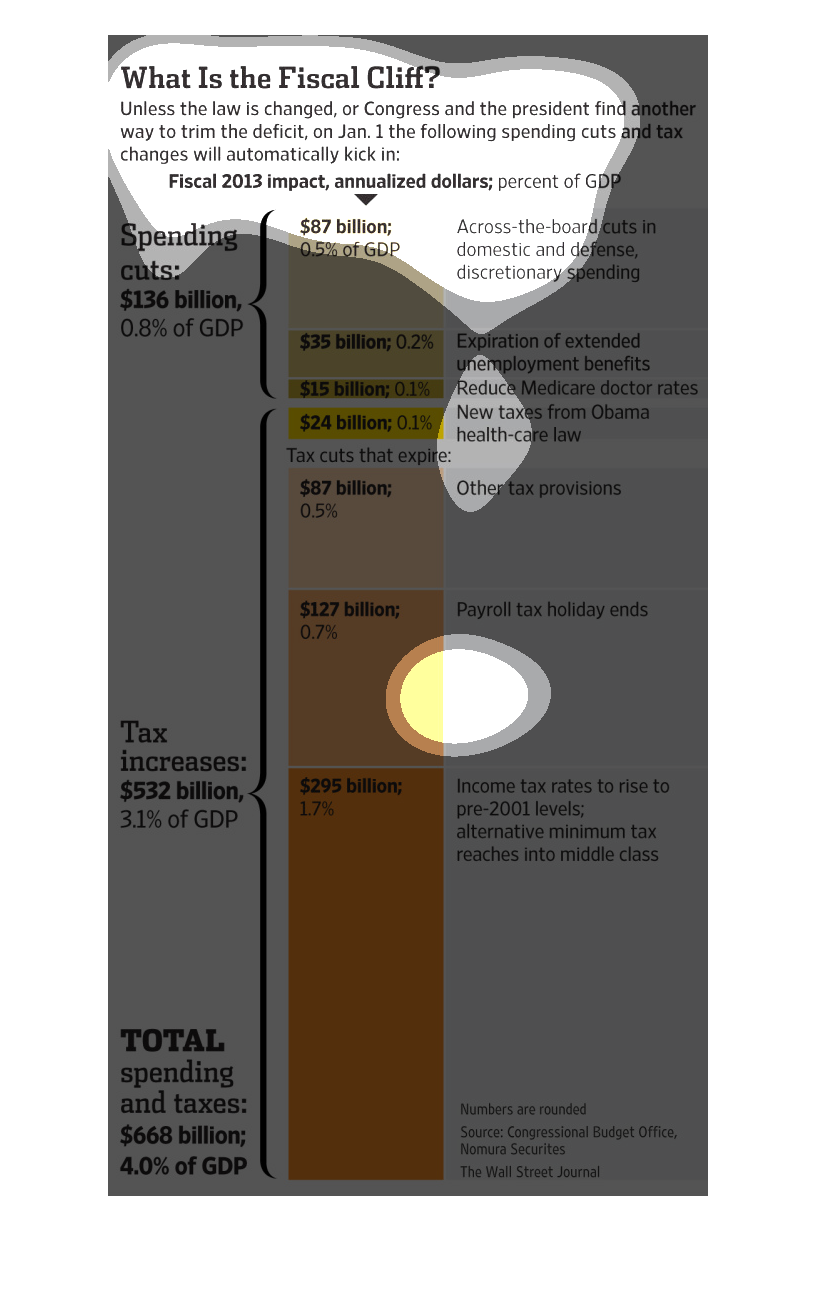
This graph shows all of the automatic spending cuts and tax changes that will kick in on January
1, 2013. With an estimated $136 billion and $532 billion in tax increases respectively.
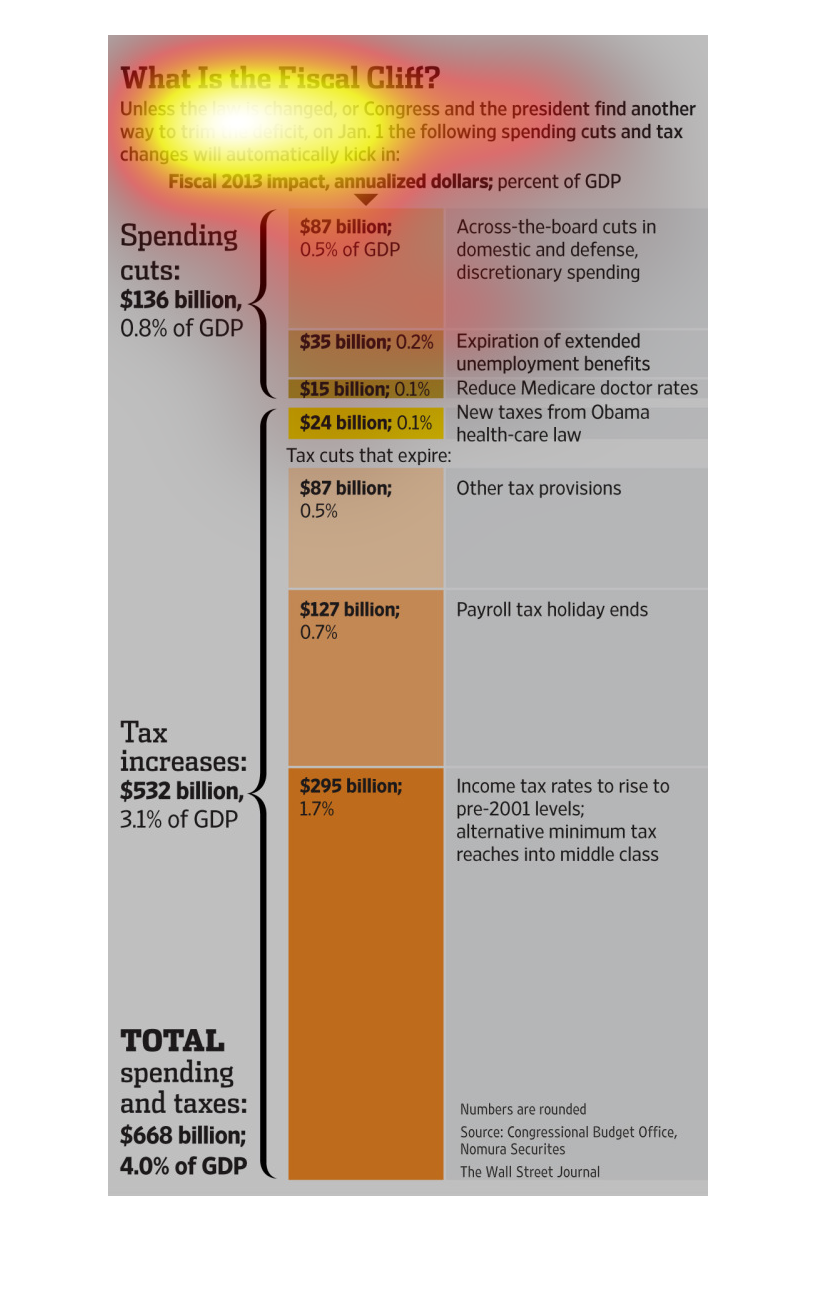
This chart details what the fiscal cliff is and what lawmakers are doing in the United States
do try and avoid it. The graph shows some of the money that could be made or lost by these
changes.
This chart describes the fiscal cliff and the fiscal chart from 2013. Describes spending cuts
($136 billion), tax increases ($432 billion), and total spending and taxes ($668 billion).
This chart describes what is the fiscal cliff. Specifically, unless the laws change big spending
cuts will occur. Different categories are represented by different colors.
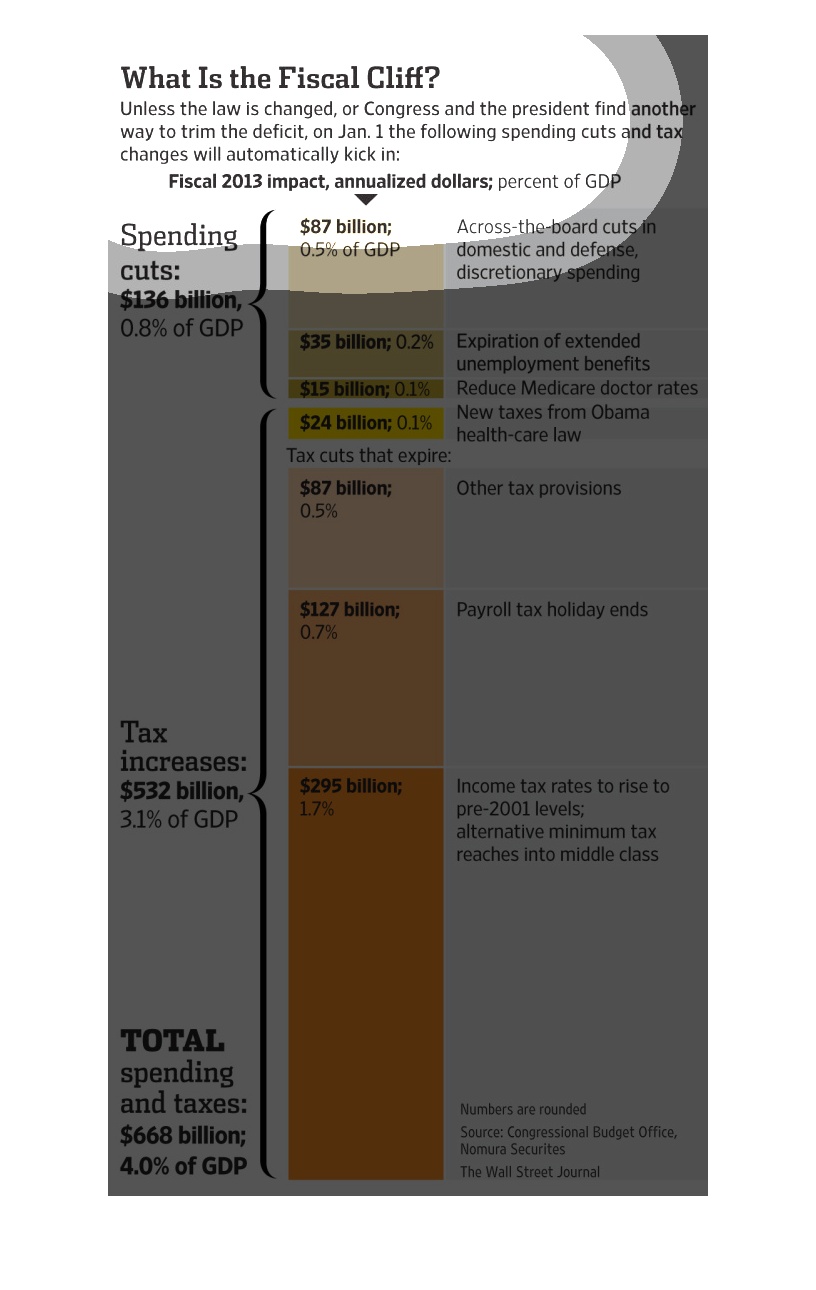
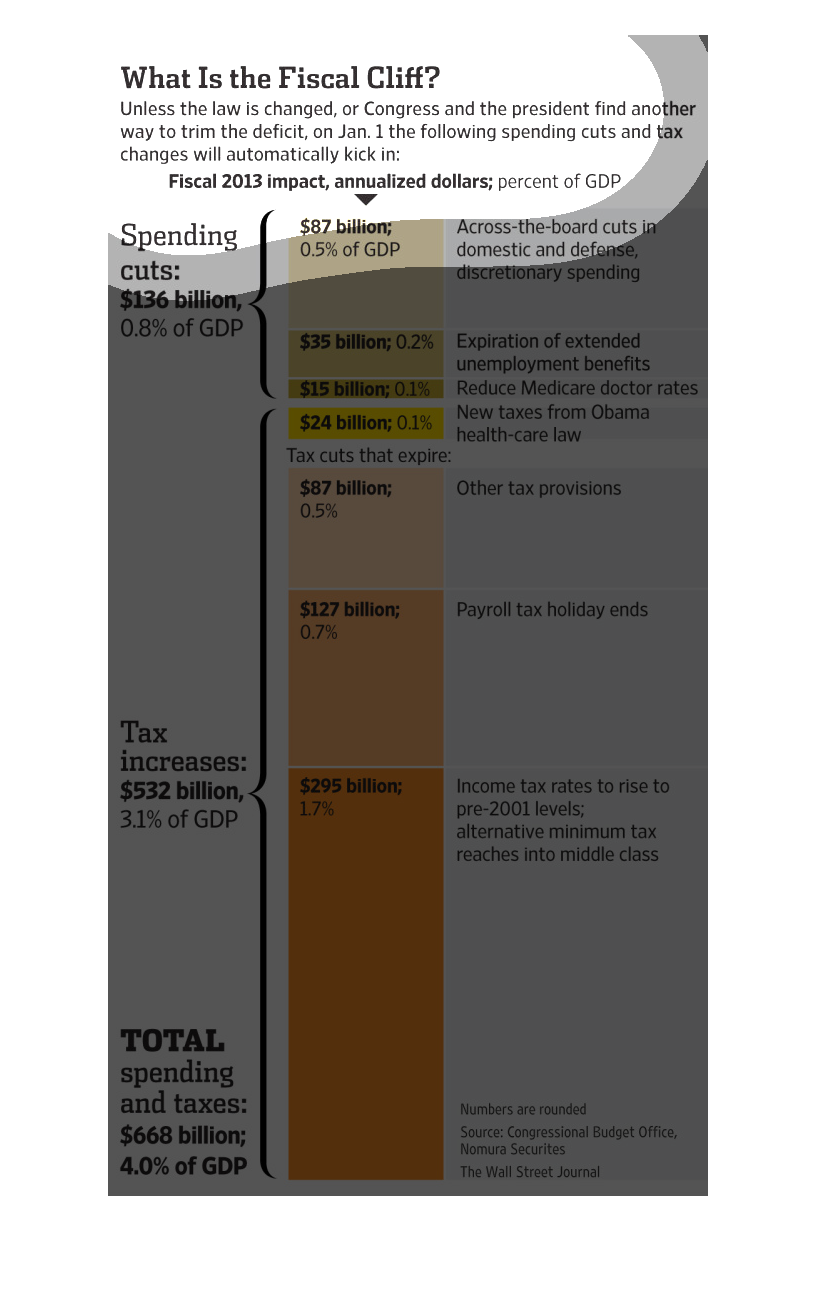
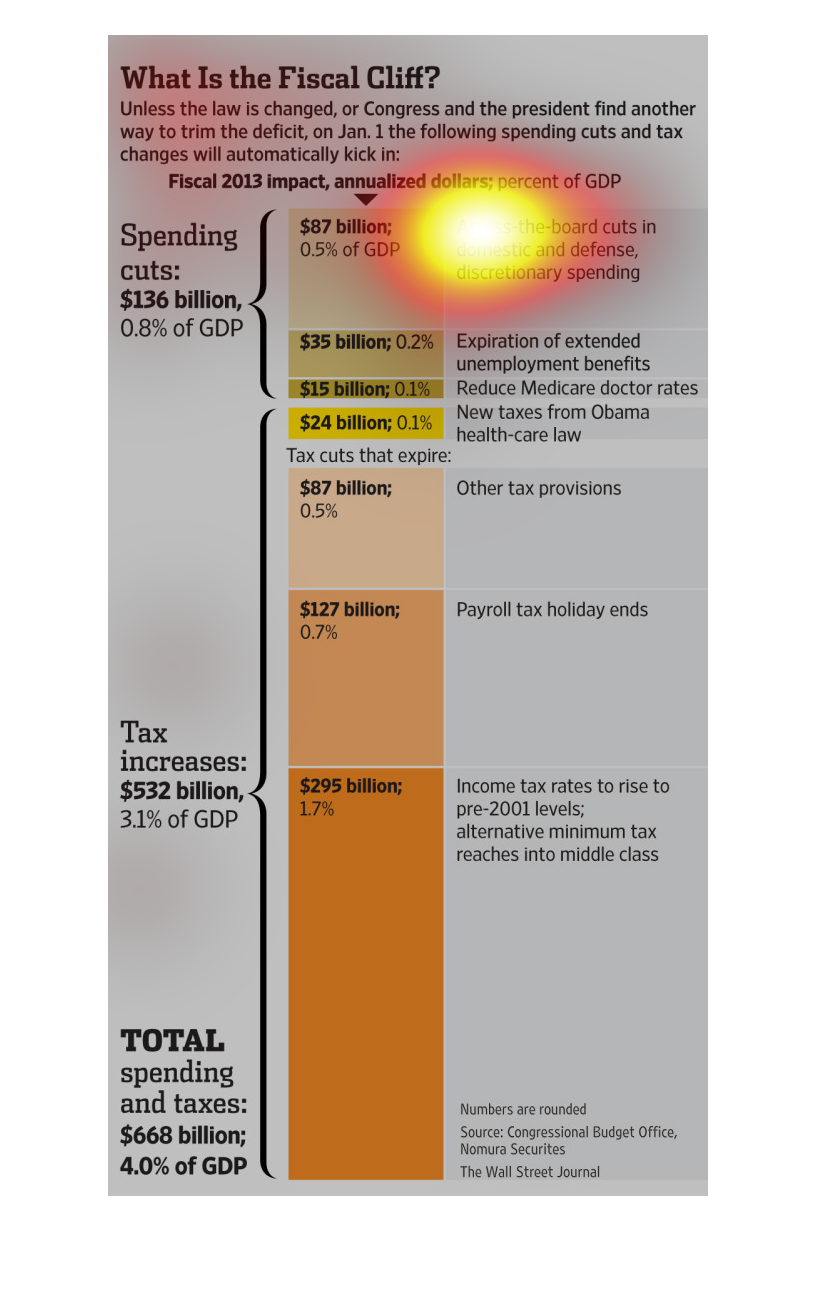
This graph describes the Fiscal Cliff. Unless the law changes there are several places where
there will be spending cuts. They estimate $87 billion across the board. Also $35 billion
in unemployment benefits.
The image depicts an explanation of the fiscal cliff. Basic tax changes and spending cuts
come into affect unless the president and congress can agree on an number of fiscal changes
to reduce the deficit.
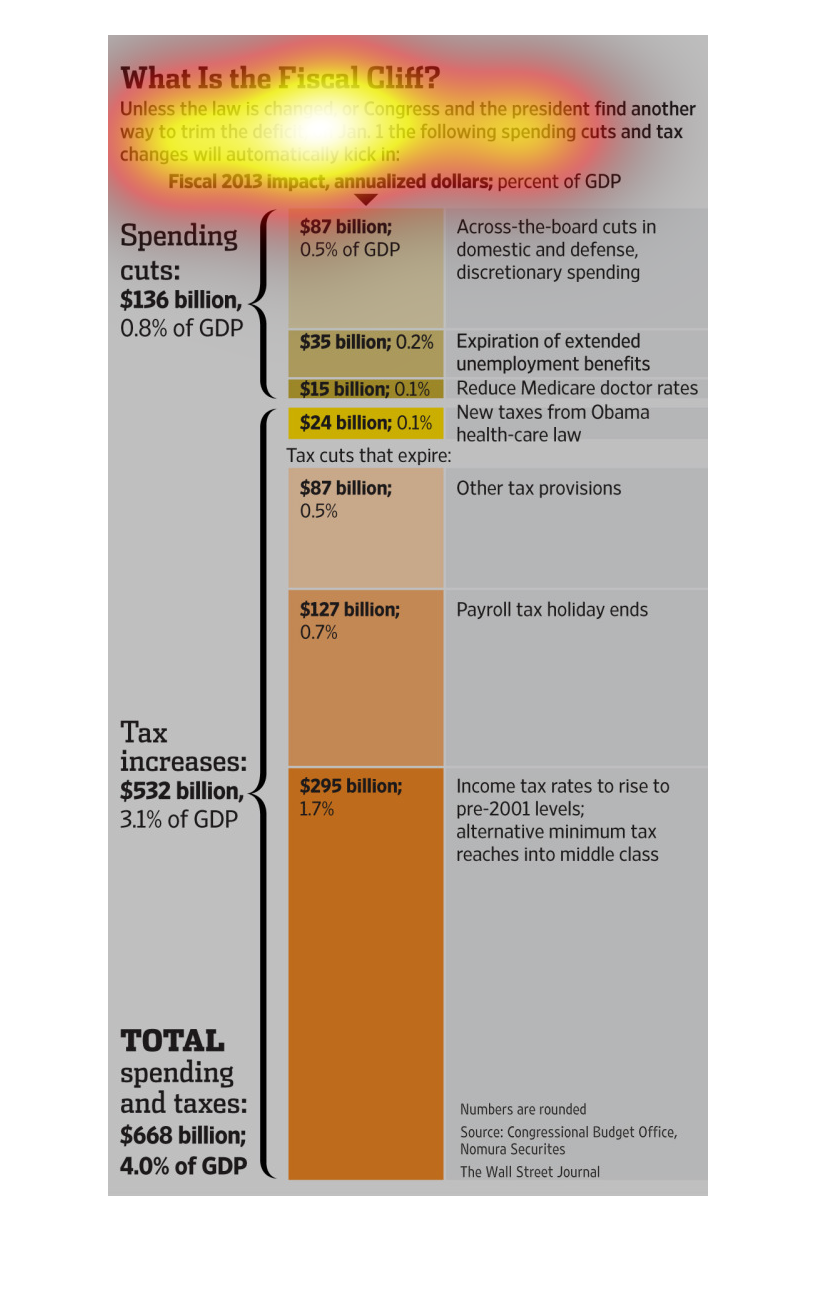
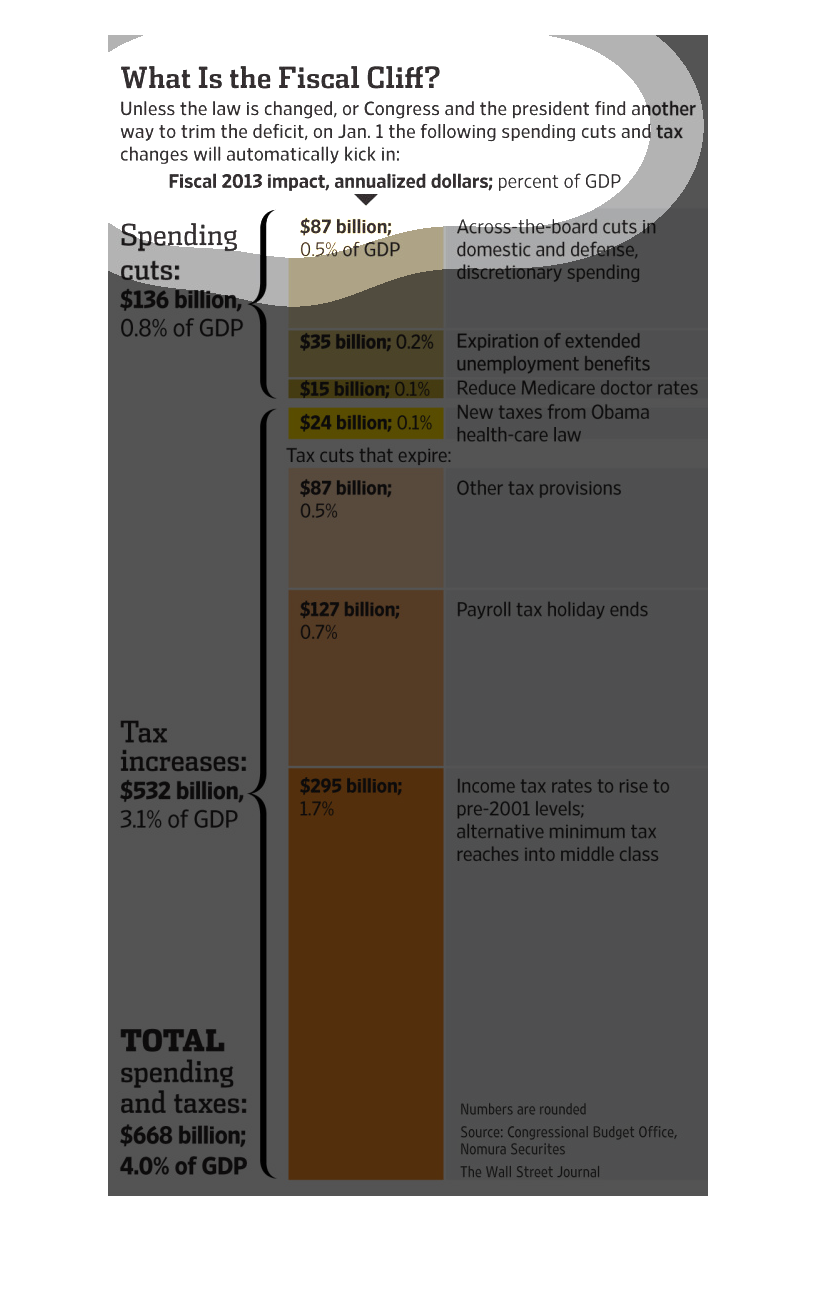
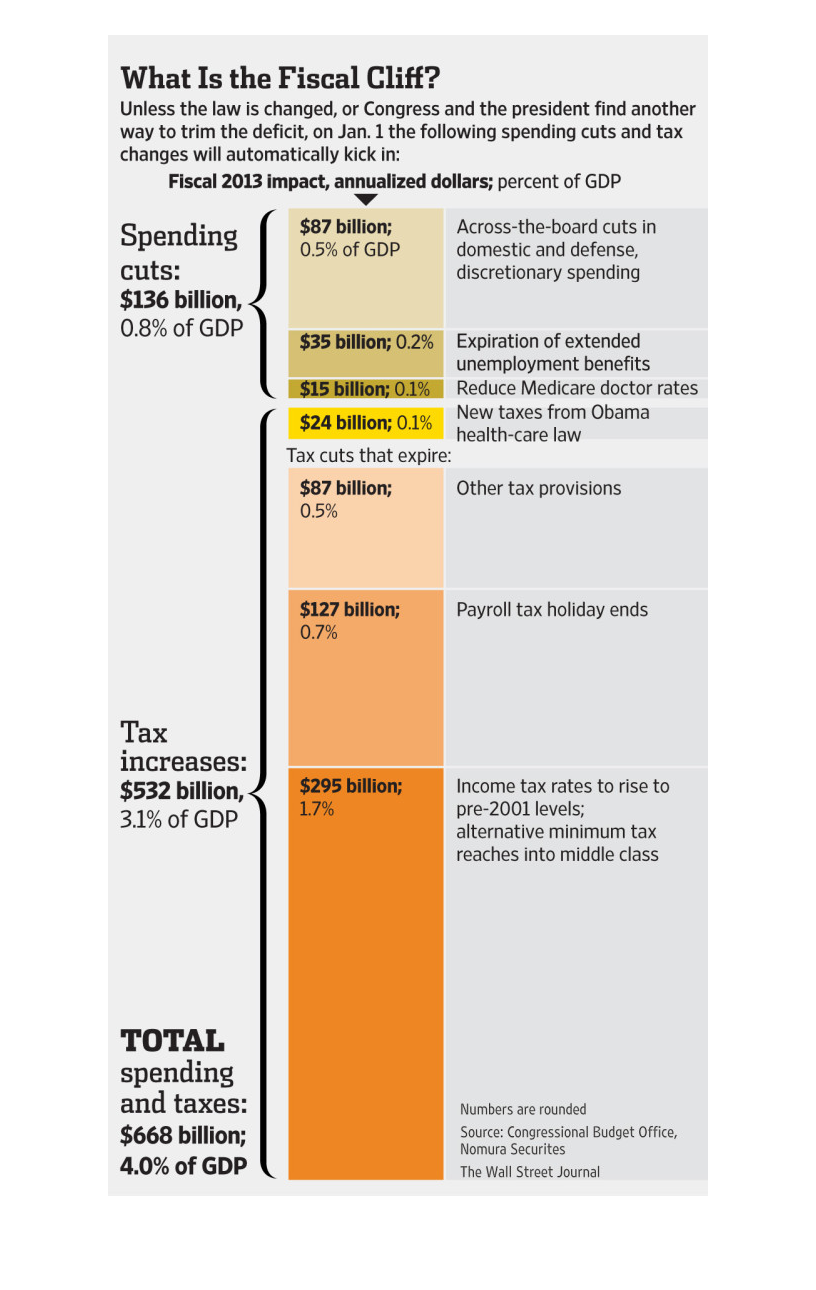
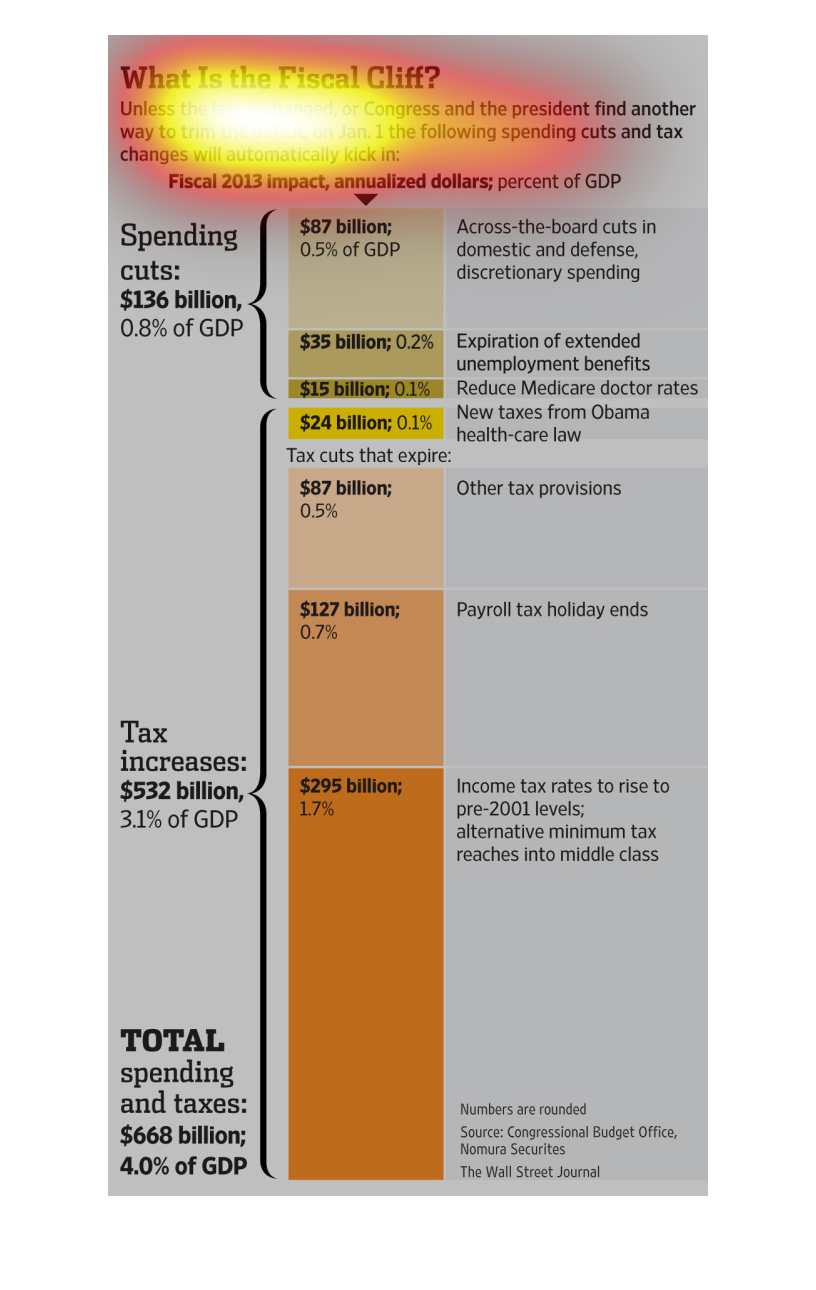
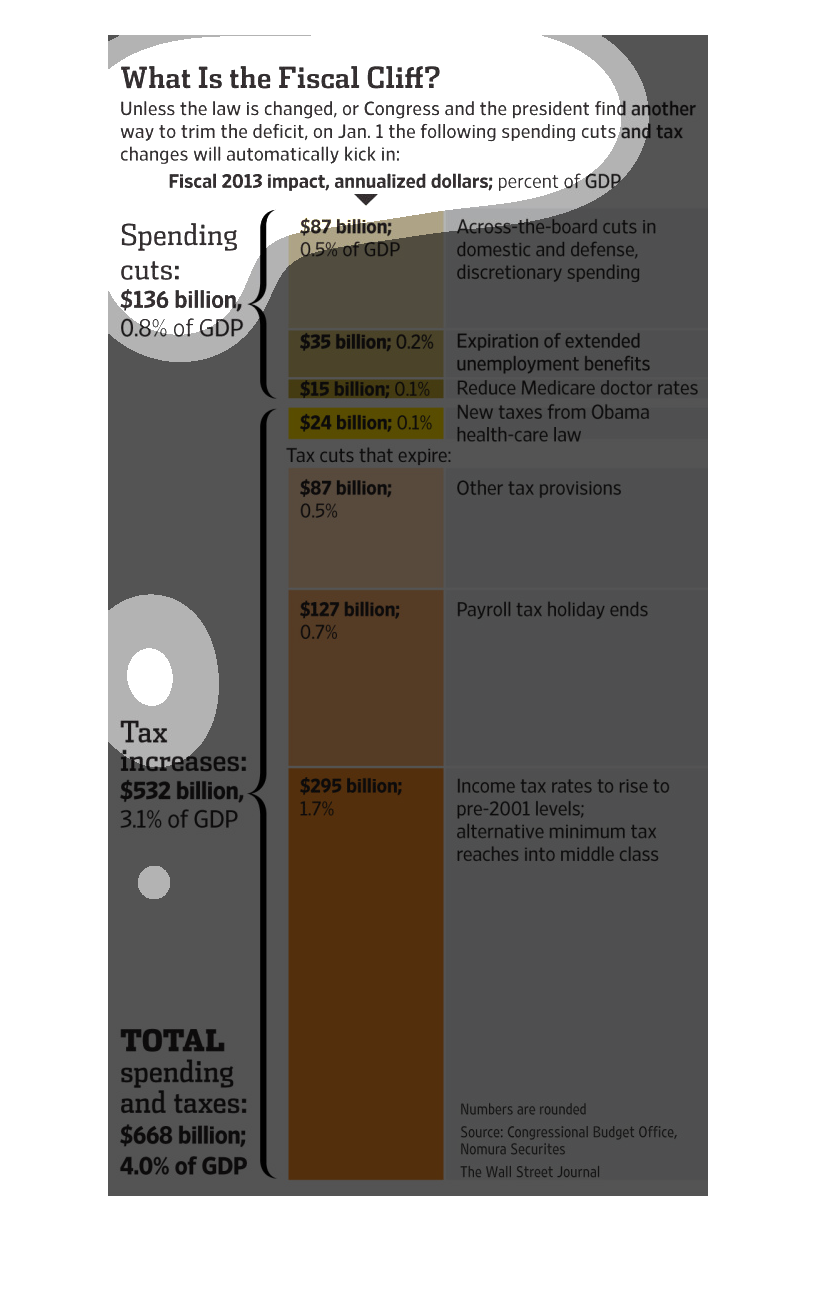
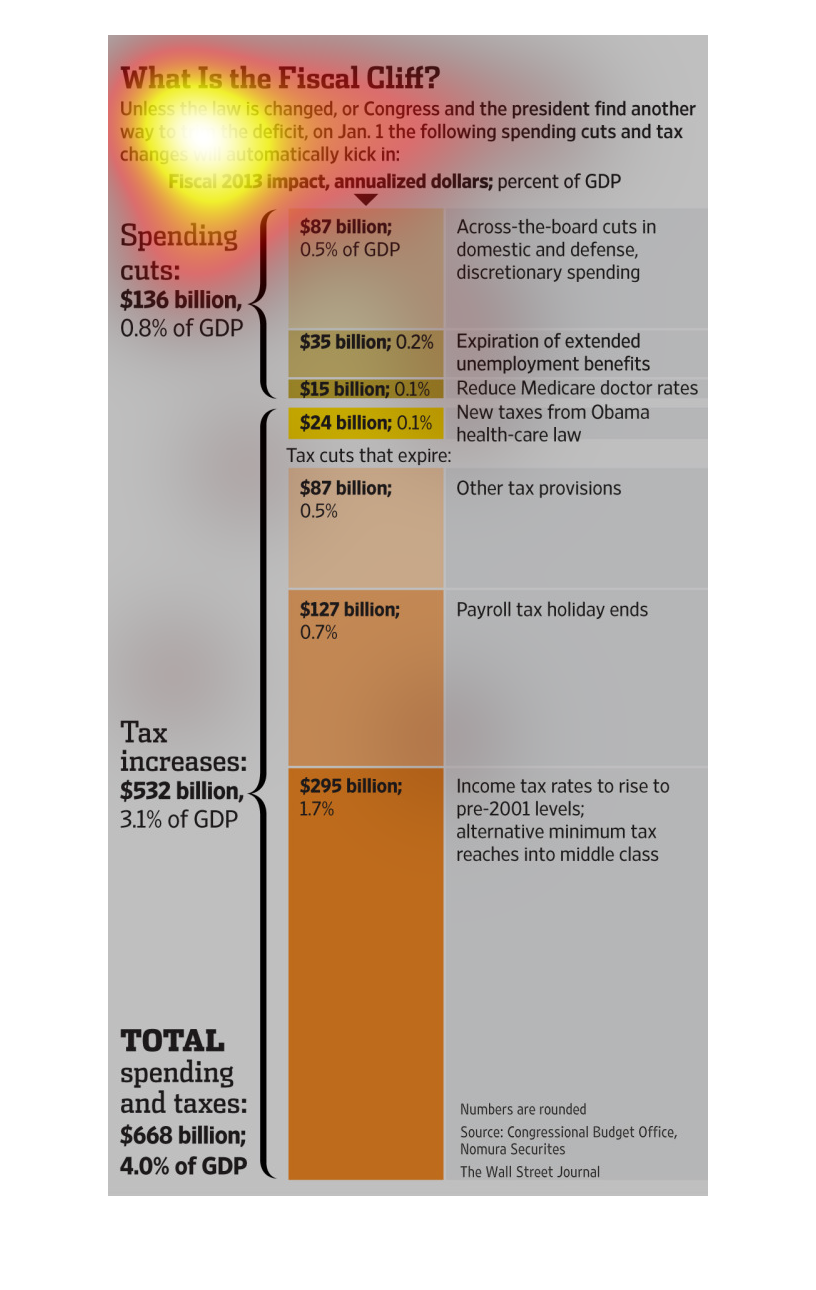
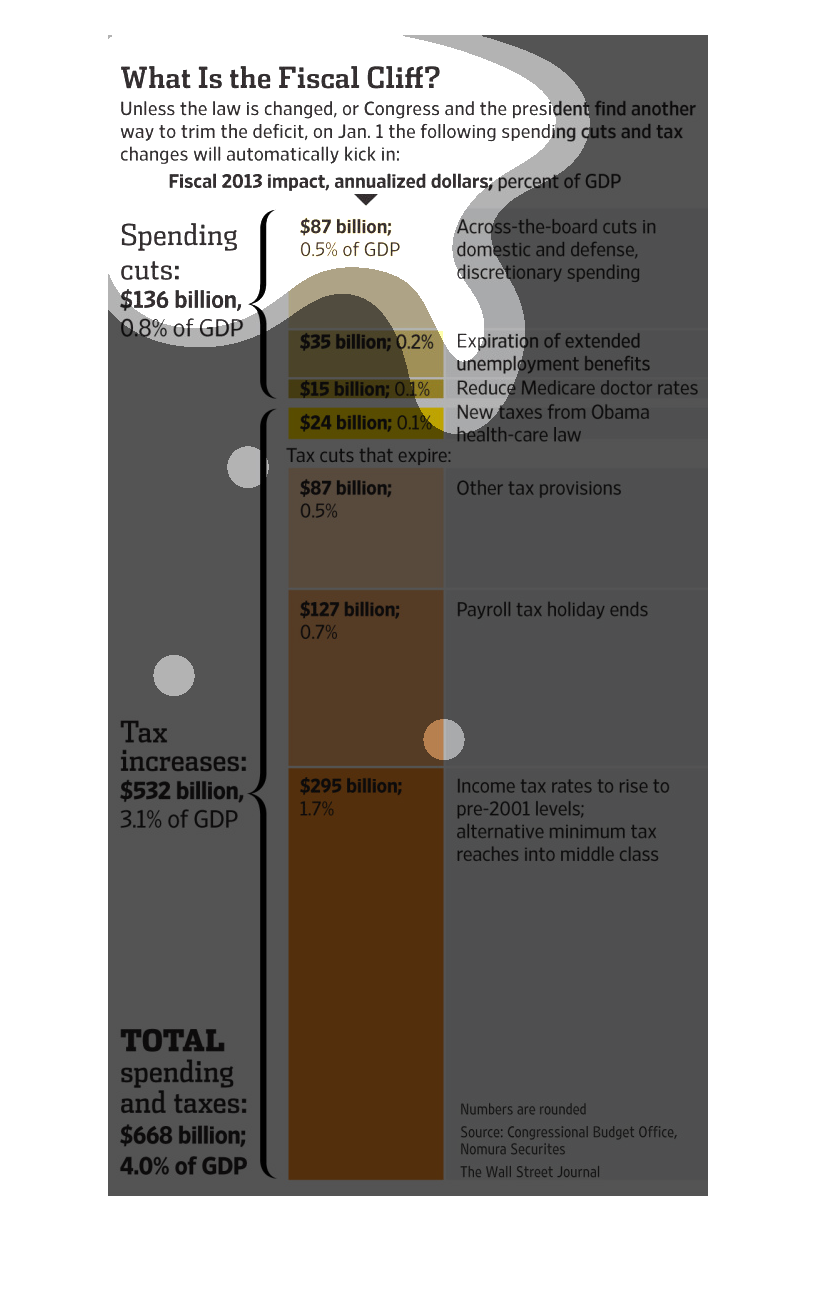
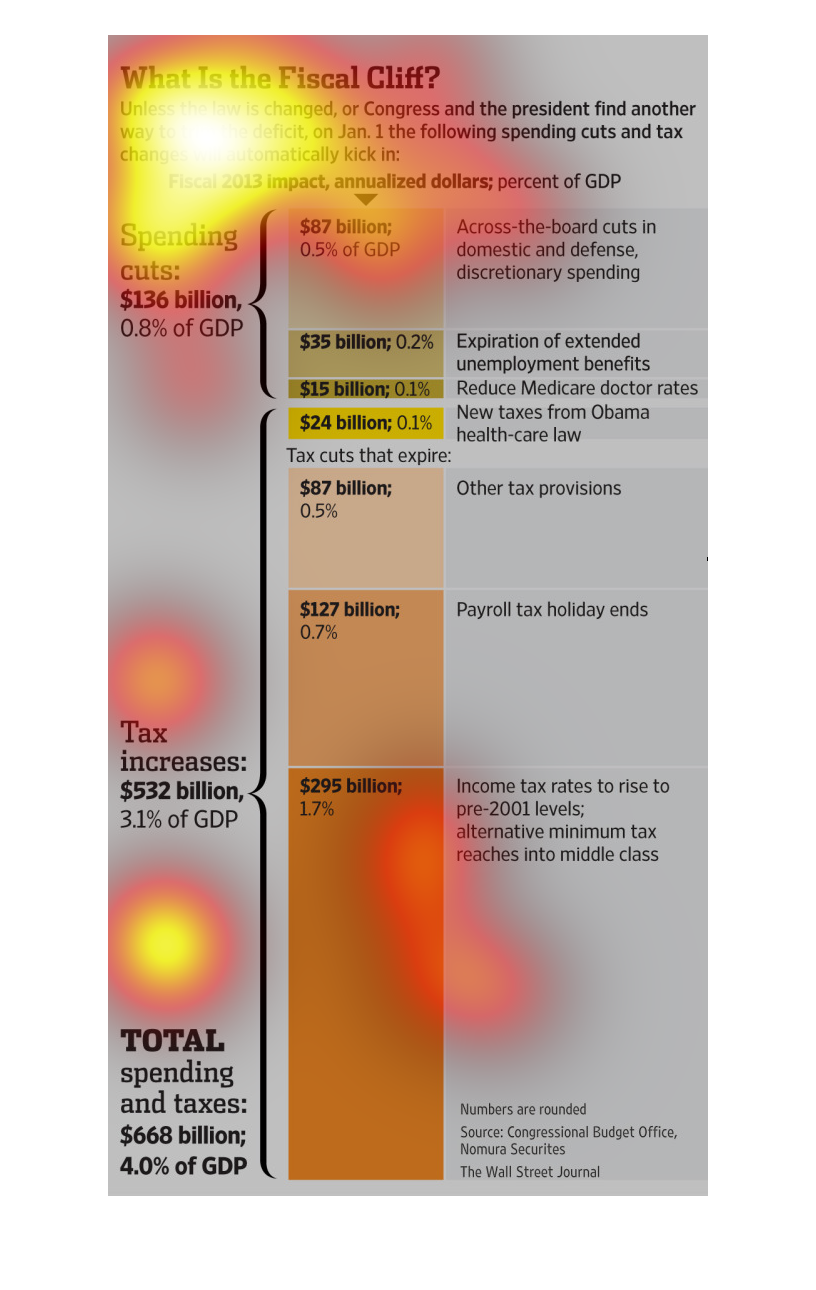
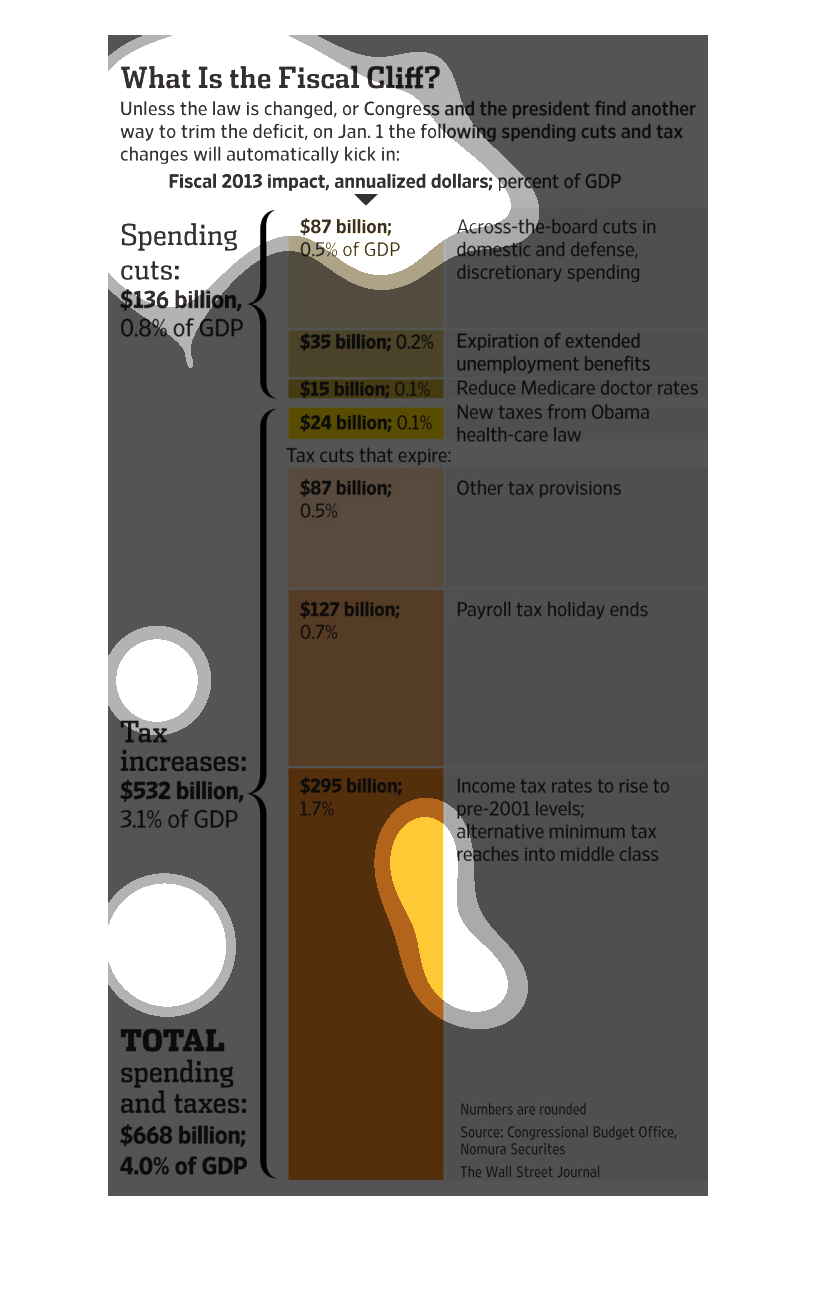
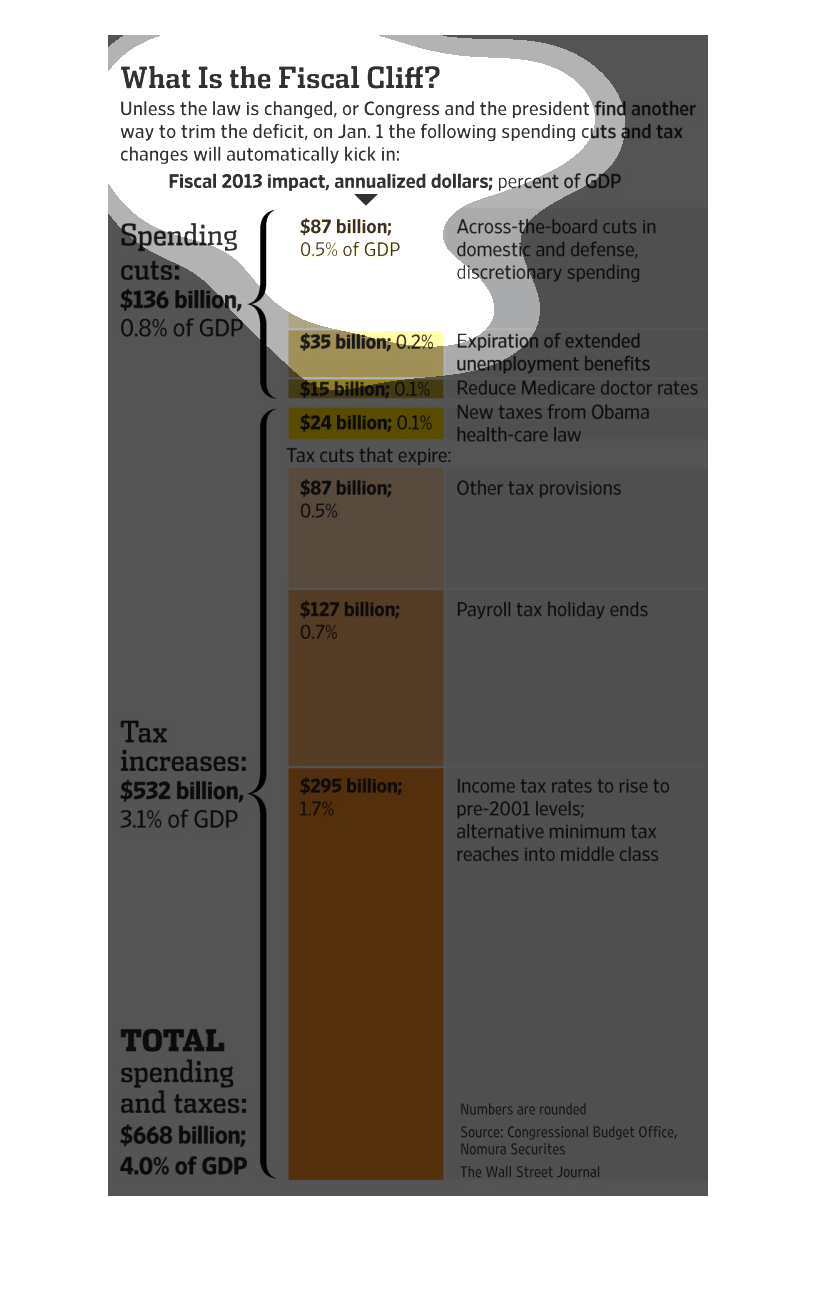
This graphic asks, What is the fiscal cliff?  More details: Unless the law is changed, or
Congress and the President find another way to trim the deficit, on January 1 the following
spending cuts and tax changes will automatically kick in:  These include domestic and defense
spending cuts, and income tax rates set to rise to pre-2001 levels.  This information is organized
in a single bar chart, which looks like a thermometer.
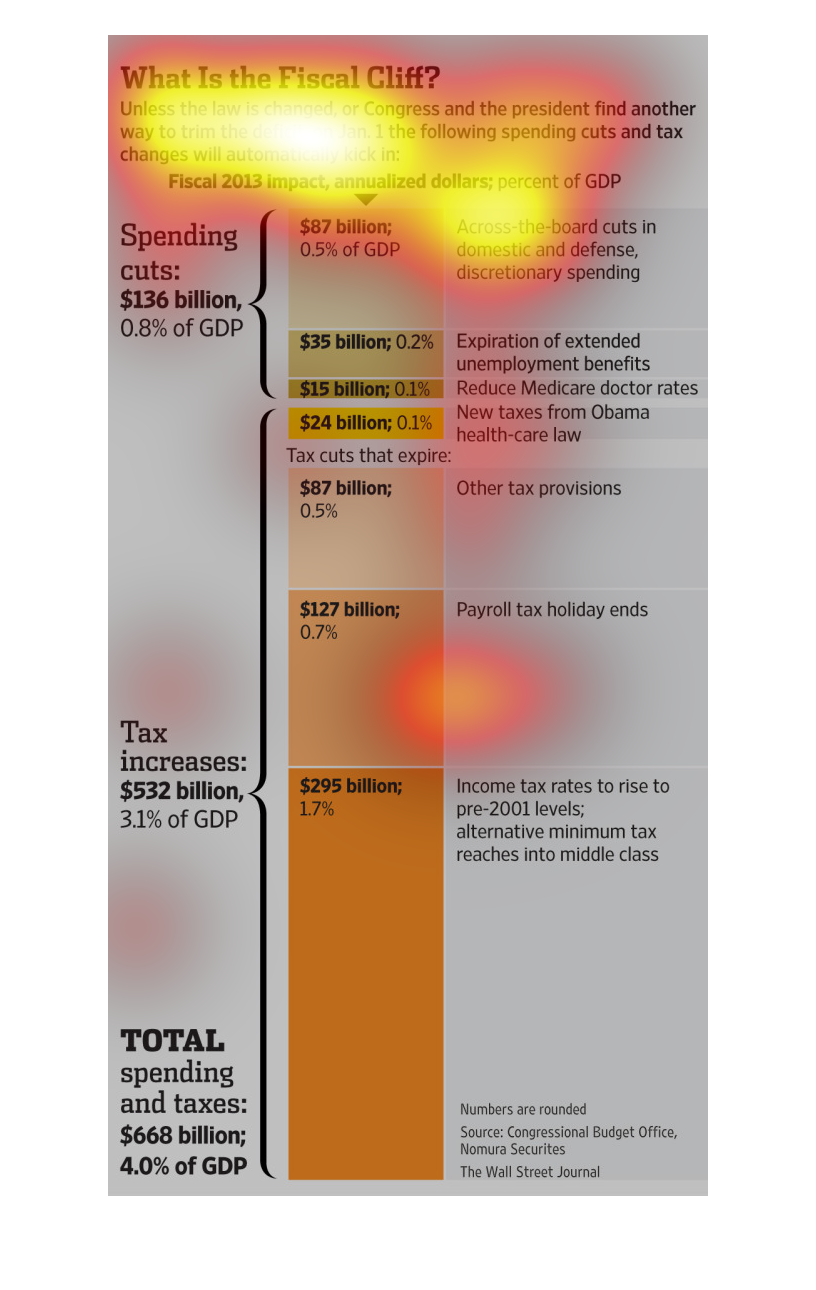
This image is on Fiscal Cliff and what it is . The chart gives you different topics such as
spending it tells you that across the board cuts in domestic and defense cut spending.
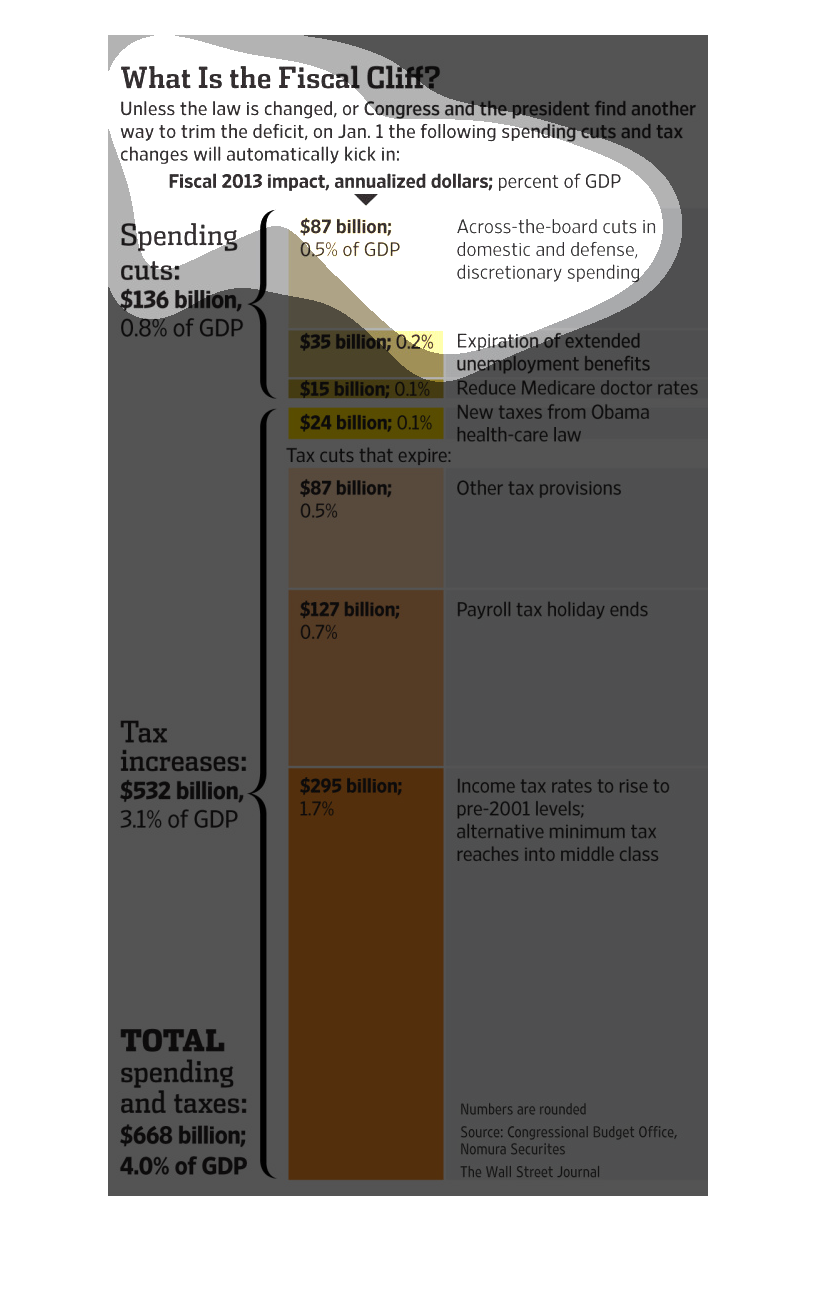
This chart describes and depicts the inevitable spending cuts and tax changes that will happen
if the Obama administration does not find a way to trim the deficit.