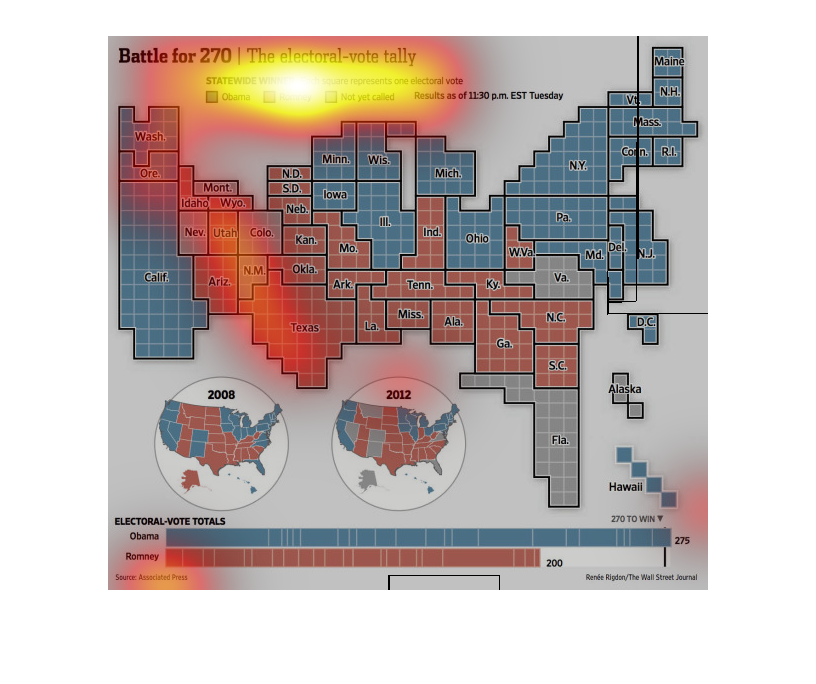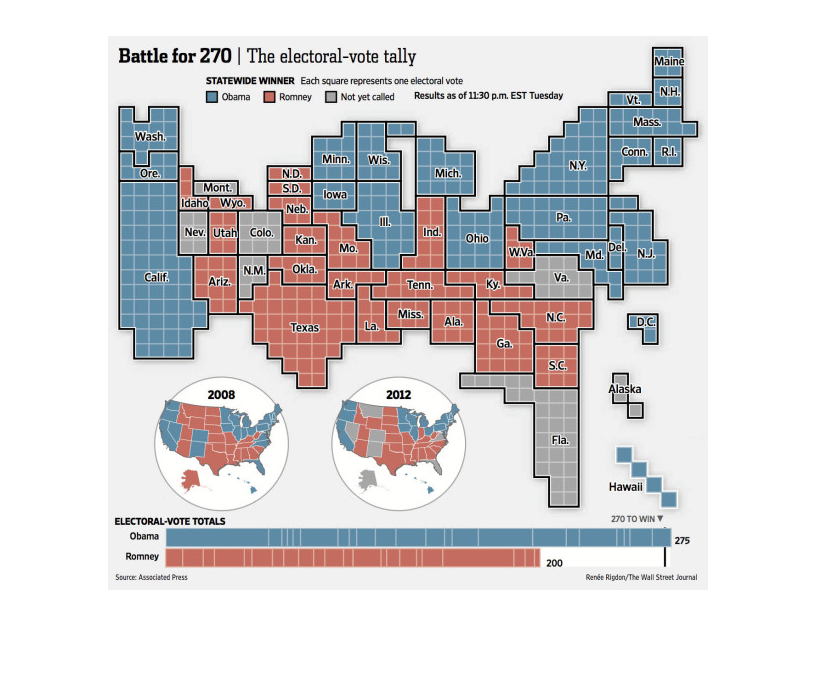
The figure presented to the left is titled Battle for the 270.  The figure is a representation
of the statistical data for the electoral vote tally numbers.
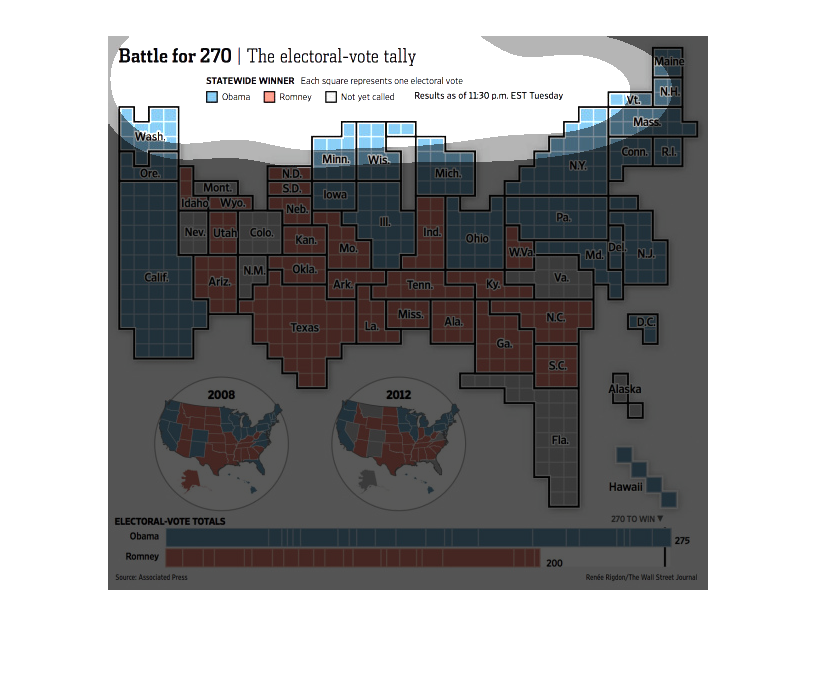
This chart from the Wall Street Journal shows how the electoral college map looks like for
the 2012 presidential election and it is mostly democratic
This image shows or depicts in U.S. geographical statistical format data concerning the battle
for 270 electoral votes in the 2012 election between Obama and Romney.
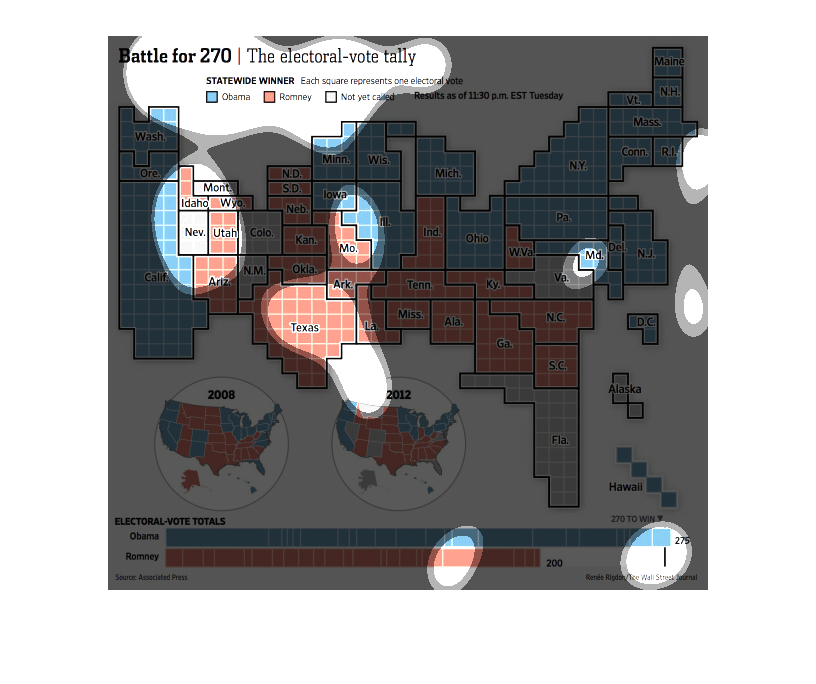
This shows the electoral votes by state for the presidential election between Obama and Romney.
The red states represent Romney and the blue represent Obama. It appears that Obama won most
of the northern/east/west coast states while Romney took most of the central/southern states.
This chart describes the battle for 270. Specifically, the election vote tally, between Barack
Obama and Mitt Romney. Different categories are represented by different colors.
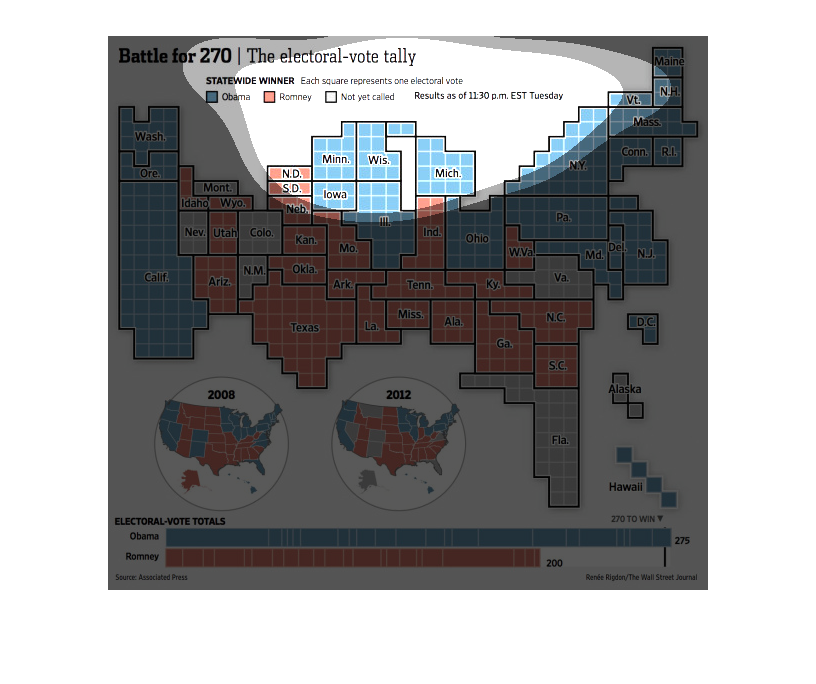
The image appears to be a map of the United States depicting the presidential battle for the
270 needed electoral votes between Obama, Romney, and Not Called States indicated by blue
for Obama, Red for Romney and Grey for not yet called states.  The bottom indicates the amount
of Electoral votes that each won.  Romney 200 Obama 275
This image describes the electoral votes spatially throughout the United States comparing
Obama (Democrat) and Romney (Republican). Much of the eastern and western coasts, mid-west,
and north voted for Obama. Much of the South and the remaining states in the mid-west voted
for Romney.
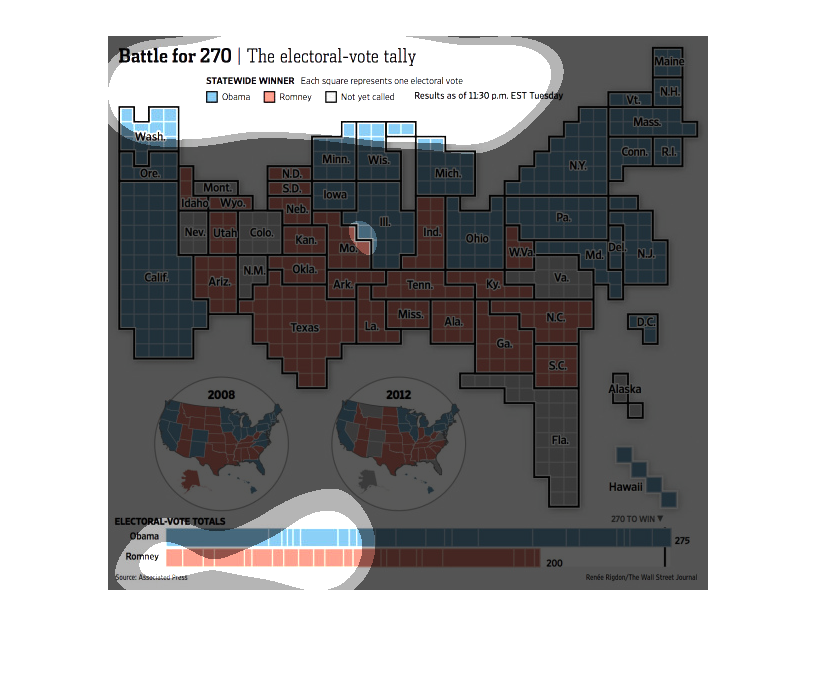
This image is entitled "Battle for 270: The Electoral-vote Tally."  It shows a grid image
of the United States.  States are depicted according to blue states (Obama) and red states
(Romney).  Results were as of 11:30 pm EST Tuesday.  Electoral-vote totals are across the
bottom of the image.  The source is The Associated Press.  This image was shown in The Wall
Street Journal.

The image depicts the electoral vote tally needed to win the presidential election in the
US as the results come in. As of 11:30pm, Barack Obama has won re-election.
This graph depicts the battle between Barack Obama and Mitt Romney to gain the required 270
electoral college votes to become U.S. president in the 2012 election.
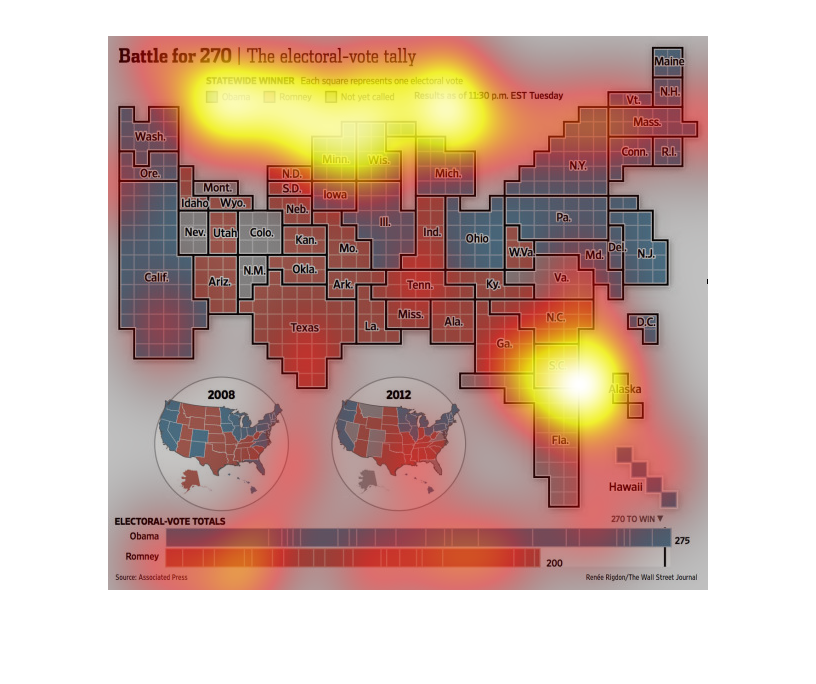
This is a country-wide map showing the electoral votes won by each candidate for the 2012
Presidential Election. The states are color-coded for each candidate, and totals are at the
bottom of the map.
This image shows the political battle for electorial vote for the last presidential election
between Obama and Romney. There is a map of the United States colored in red (for republican)
and blue (for democrat).