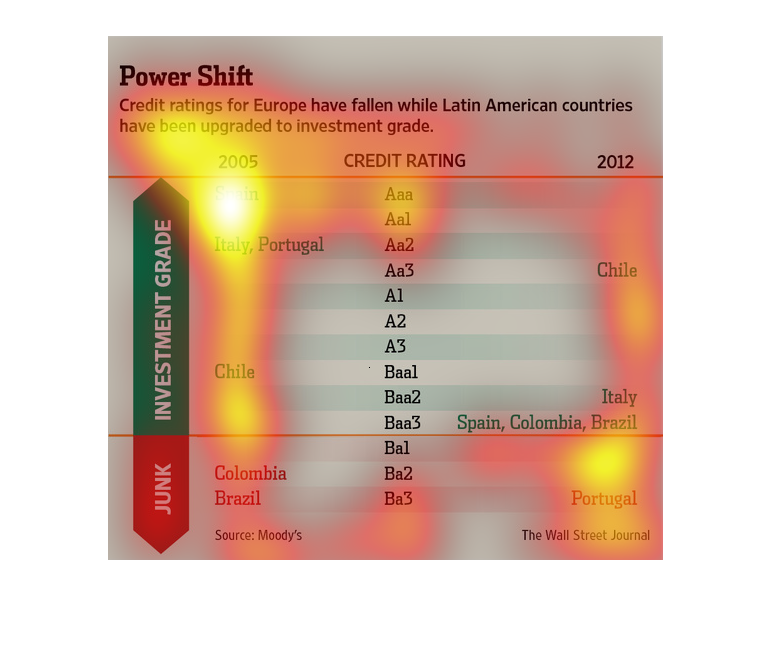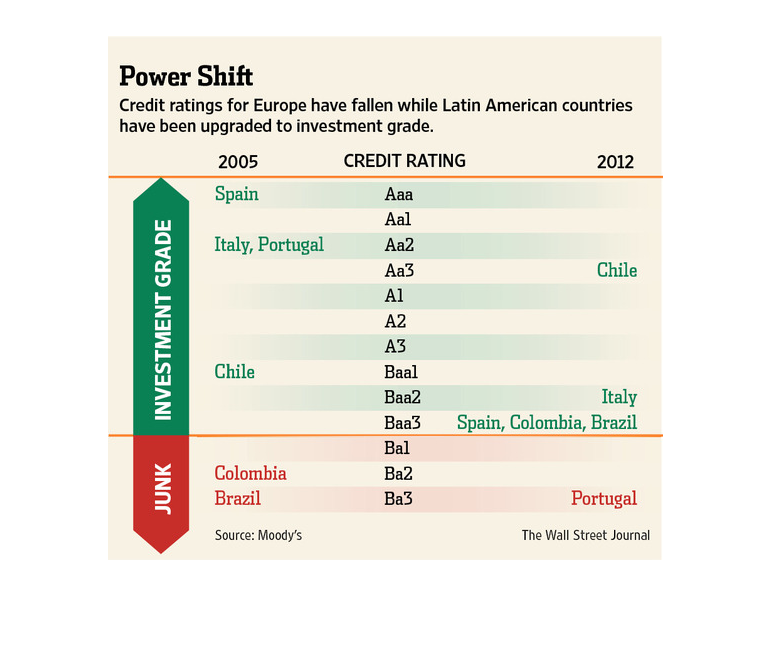
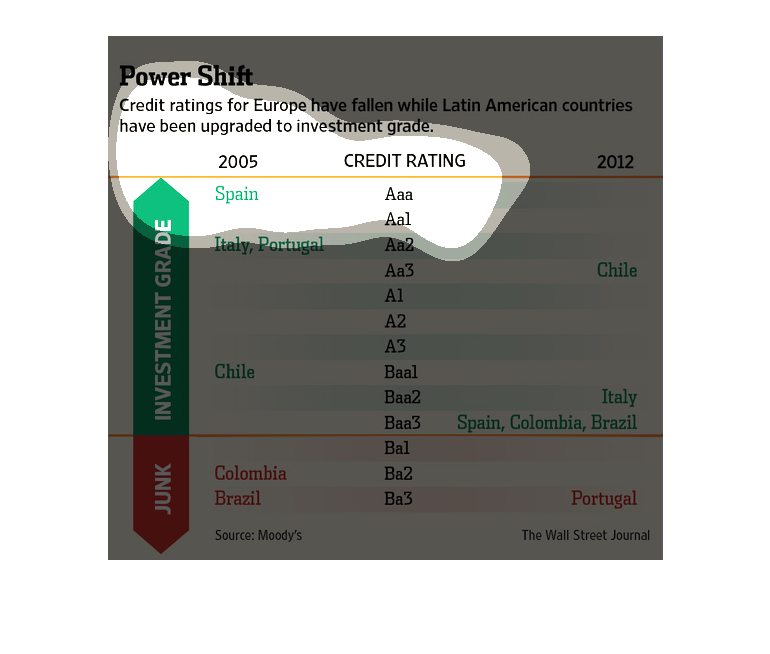
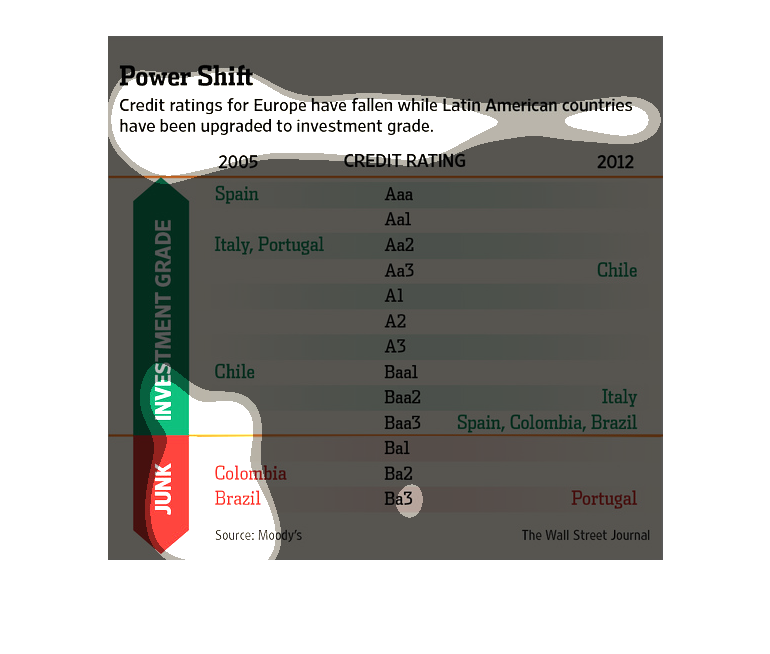
This image describes how credit rates for Europe have fallen, while those for Latin American
countries have risen to investment grade.  The graphic is table-like, and has countries like
Brazil and Columbia, which has a junk status, and Spain and Italy, on it.
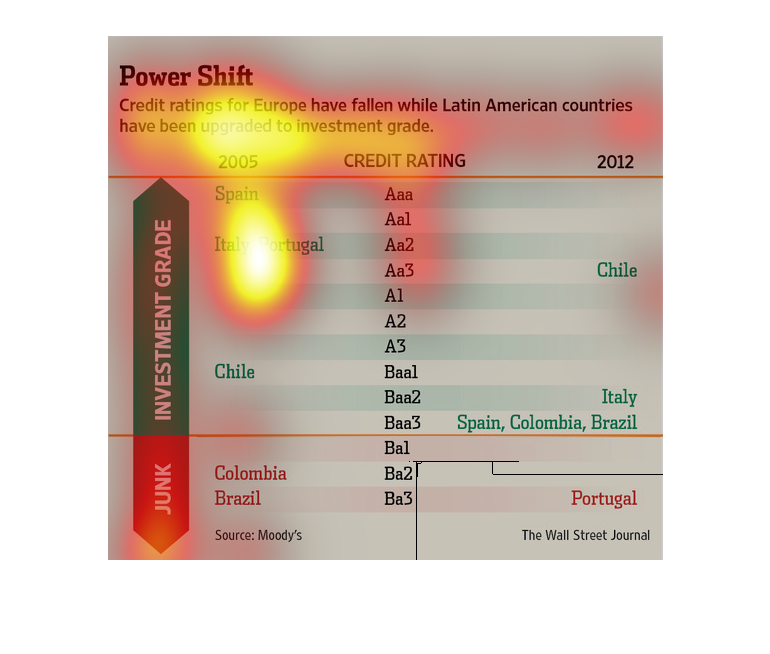
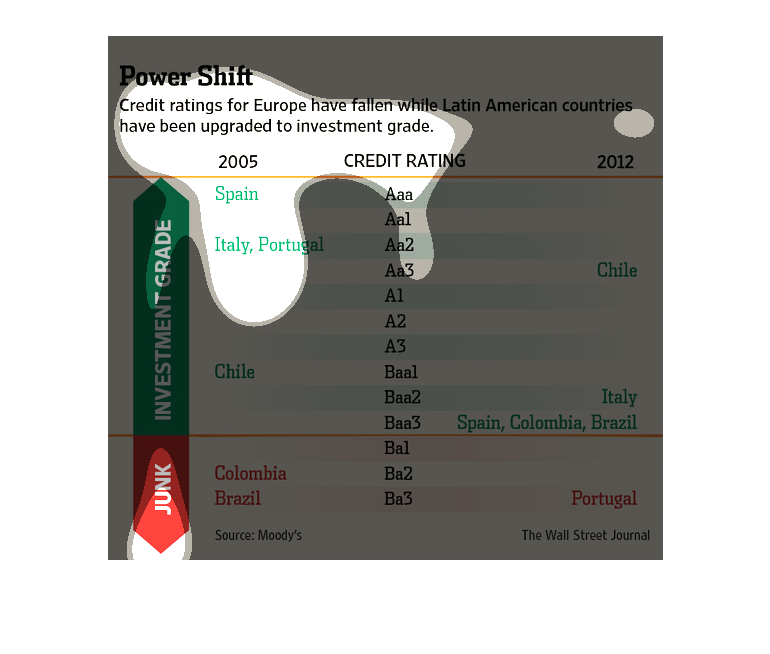
Credit ratings for Europe have fallen while Latin American countries have been upgraded to
investment grade. This figure shows the changing credit rating of the countries from 2005
to 2012.
In this graphic reported by the Wall Street Journal- from various listed sources- the various
different financial industries that have seen their credit rating suffer.
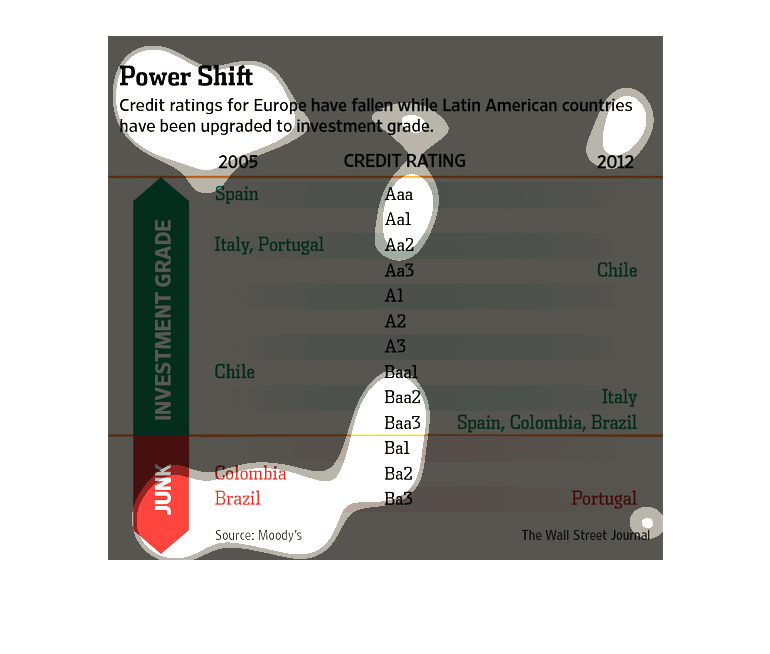
This graph shows the credit rating of various countries and their change in rating from 2005
to 2012. Chile, for example, moved from a Baal rating in 2005 to a Aa3 rating in 2012.
This chart describes your typical graph chart that sets up one or a number of categories,
which is illustrated by either a map, a graph, an illustration, or photograph.
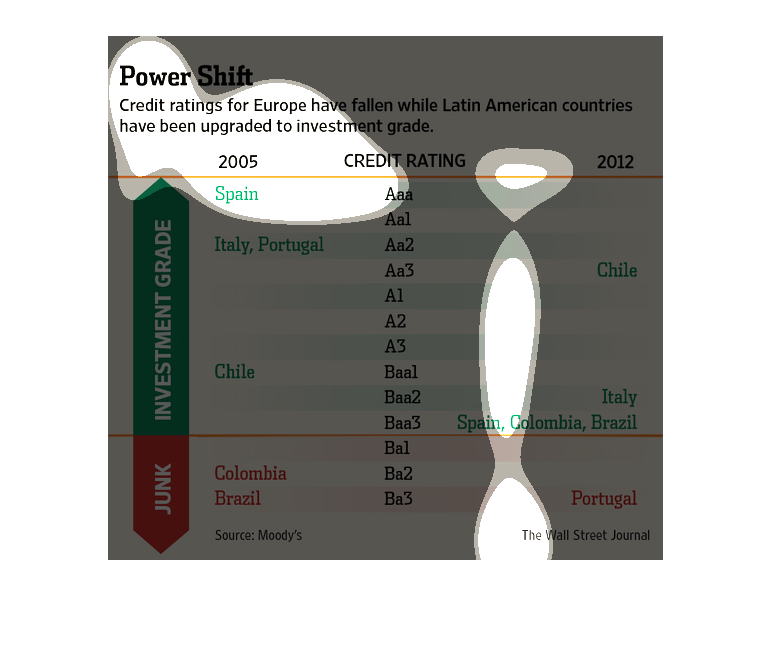
The figure presented is titled Power Shift.  The figure is a representation of the statistical
data for credit ratings for European ratings falling and Latino countries rising.
This chart is titled: Power Shift. Credit rating for Europe have fallen while Latin American
countries have been upgraded to investment grade...........
This chart from the Wall Street Journal shows how credit agencies such as Moody's and S&P
have downgraded European sovereign debt while upgrading Latin American debt
This chart from the Wall Street Journal shows how credit rating agencies like S&P and Moody's
have downgraded Europe while upgrading Latin America.
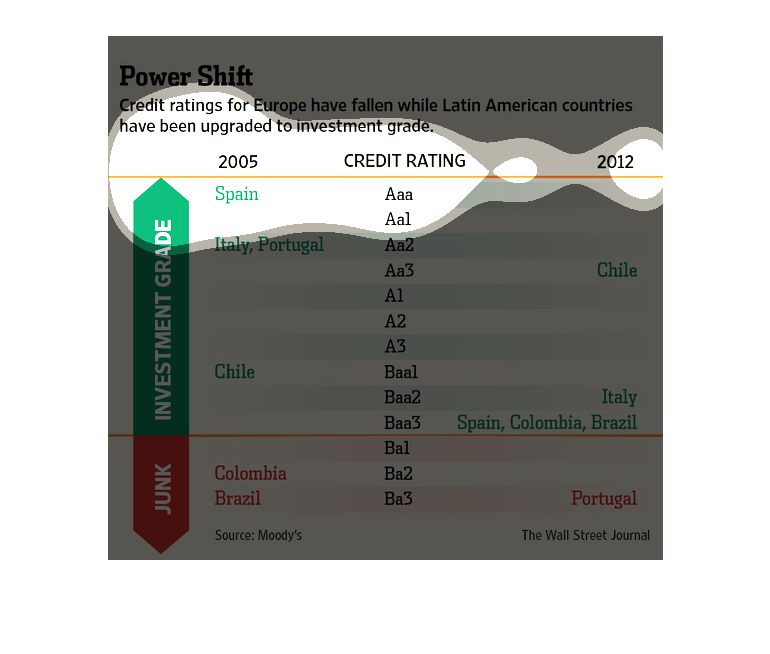
This image shows the credit ratings in several European and Latin American countries. Spain
has the best score listed, and Brazil has the worst. Data from 2005 to 2012 is shown.
This chart shows in red and green how european credit ratings have gone down, while south
american countries credit ratings have been upgraded to investable.
This chart describes power shift. Specifically, credit ratings for Europe have fallen. Different
categories are represented by different colors on the chart.
This chart is showing that for Europe credit ratings have been crashing. However, for Latin
American countries this is not the case. The green and red charts show the information about
this.
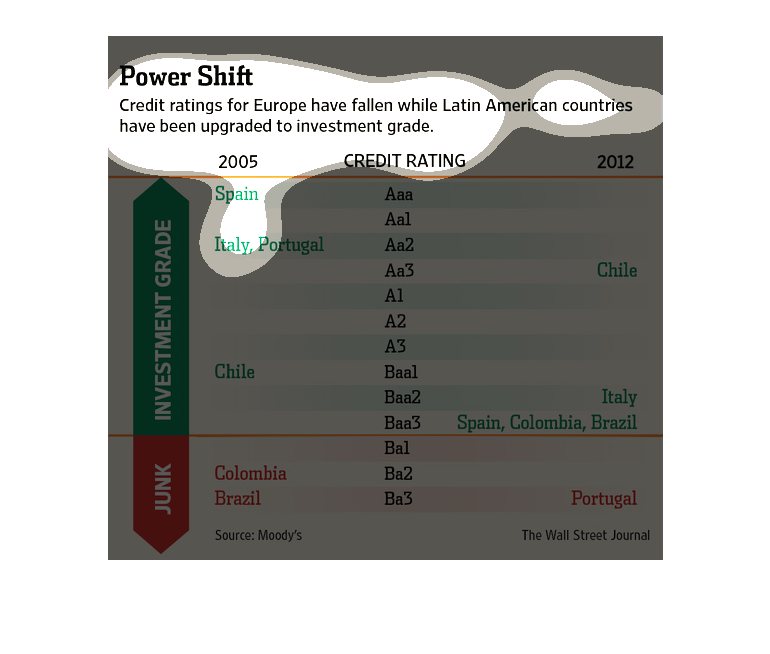
The graph shows credit ratings for different countries in 2005 and 2012. In 2005, Spain, Italy,
and Chile were all investment grade, while Colombia and Brazil were junk.  However, all five
countries listed above were investment grade in 2012, although Spain and Italy had fallen.
Portugal was junk in 2012. The graph shows that European countries' credit ratings have fallen
while South American countries' ratings have risen.