The image depicts how hurricane Sandy's landfall wreaked havoc along the eastern seaboard
and into the Midwest as it continued it's way toward Canada. Almost the entire eastern seaboard
was affected by the storm.
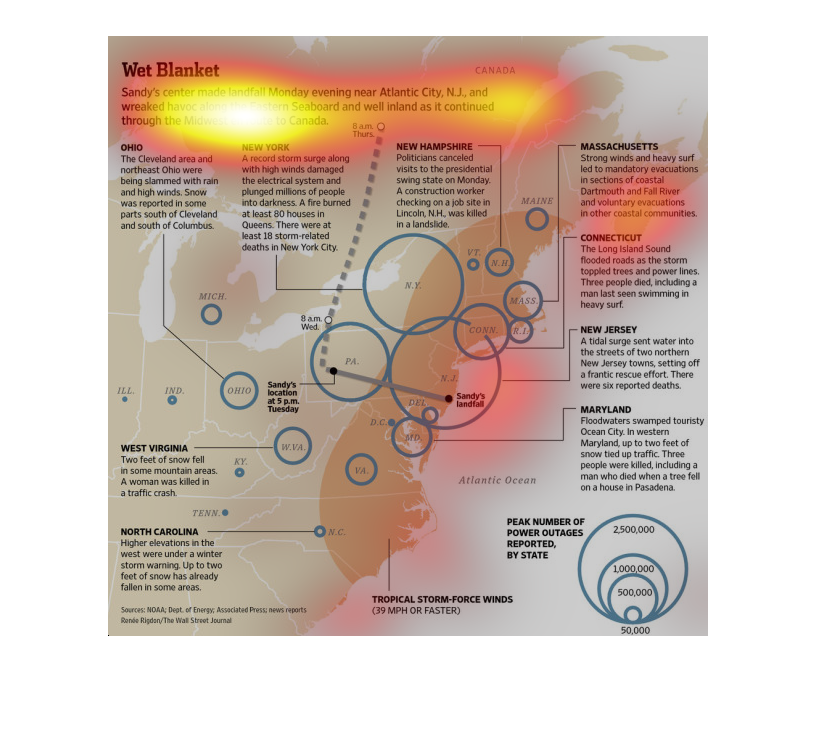
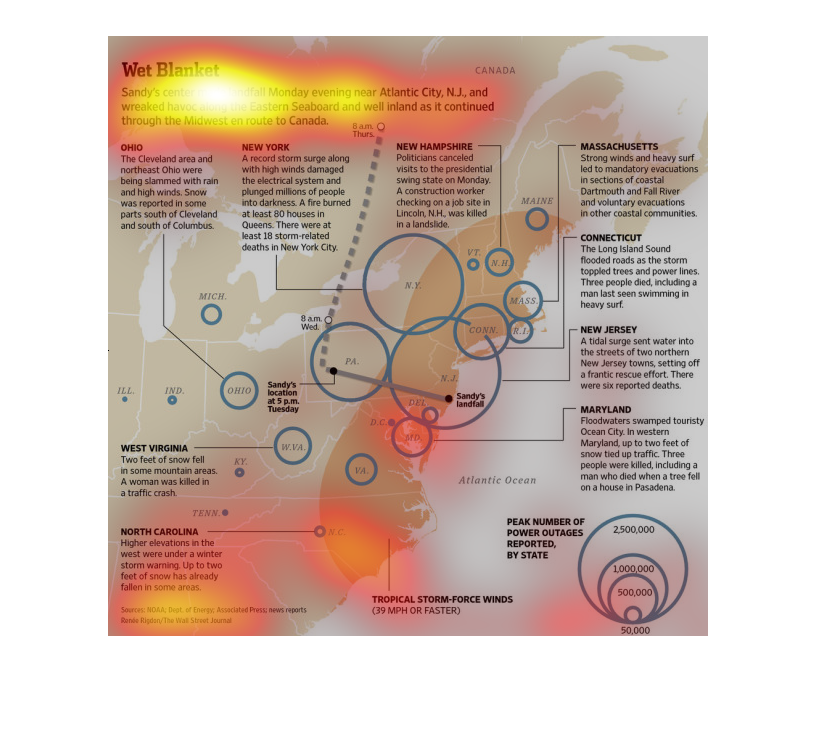
This graph is illustrating the impact that Hurricane Sandy had on certain regions of the northeast.
New York for example, experienced record rainfall.
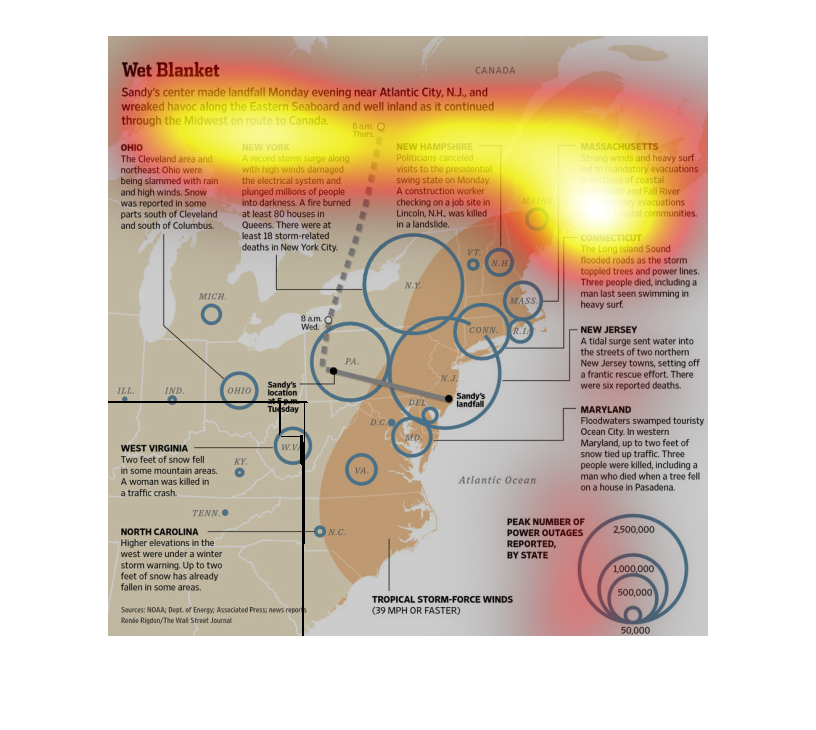
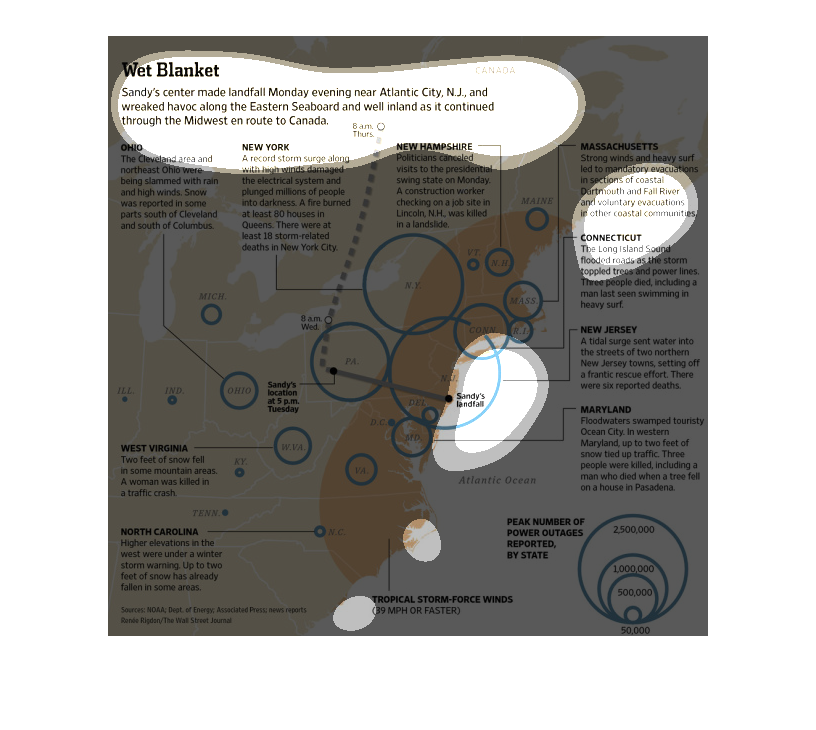
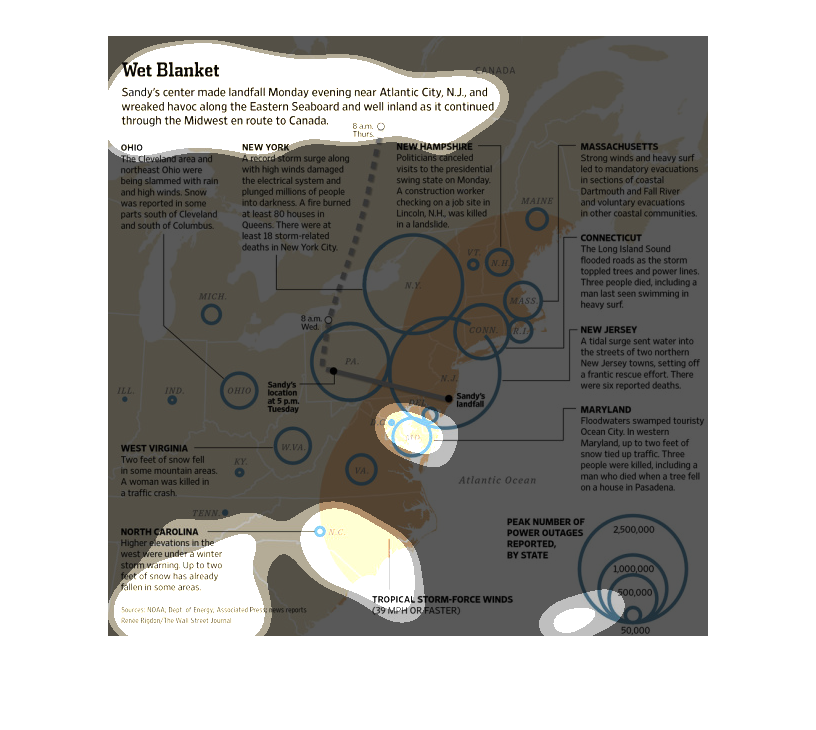
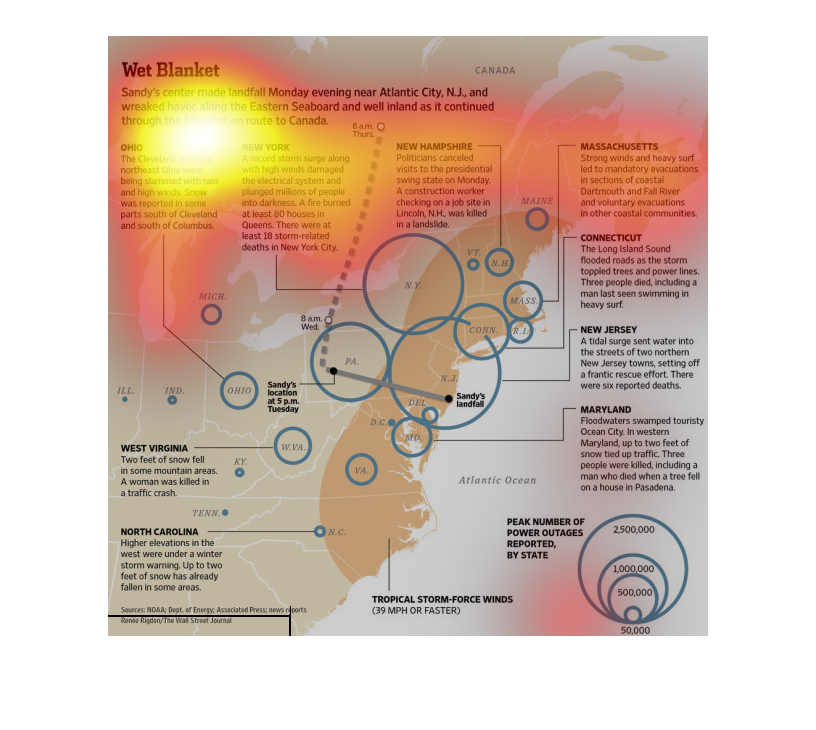
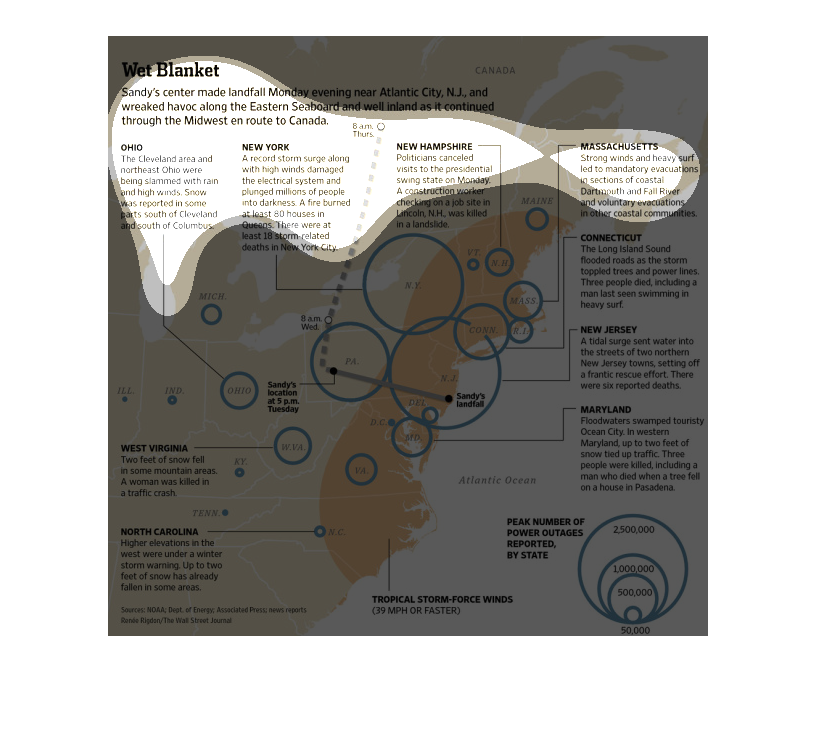
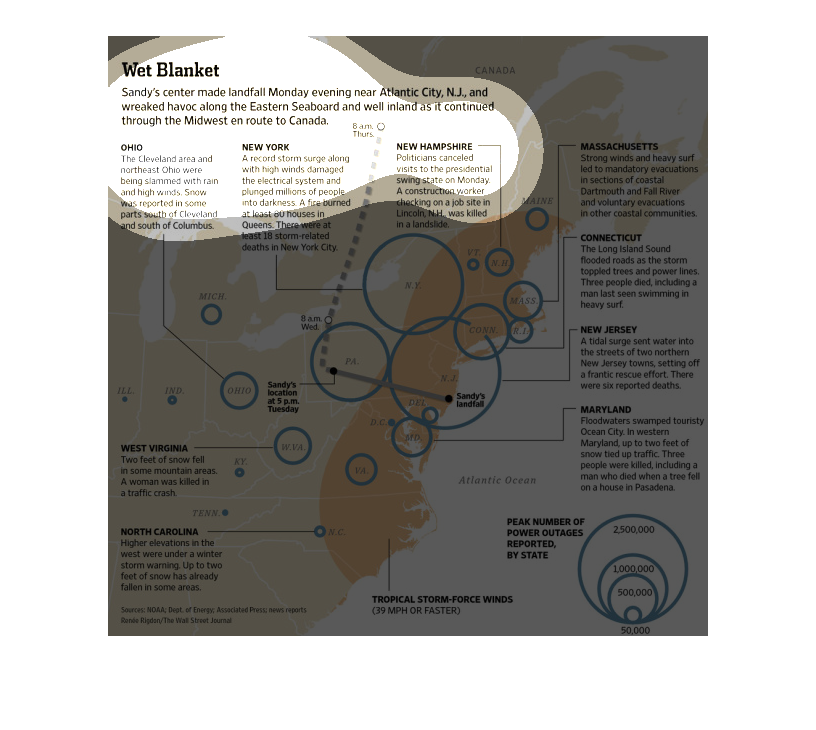
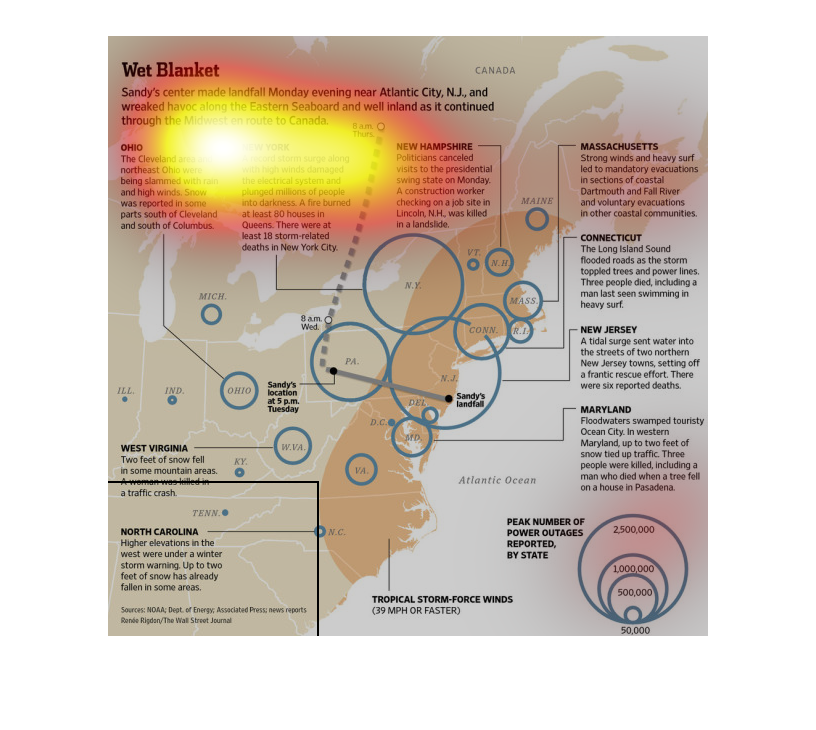
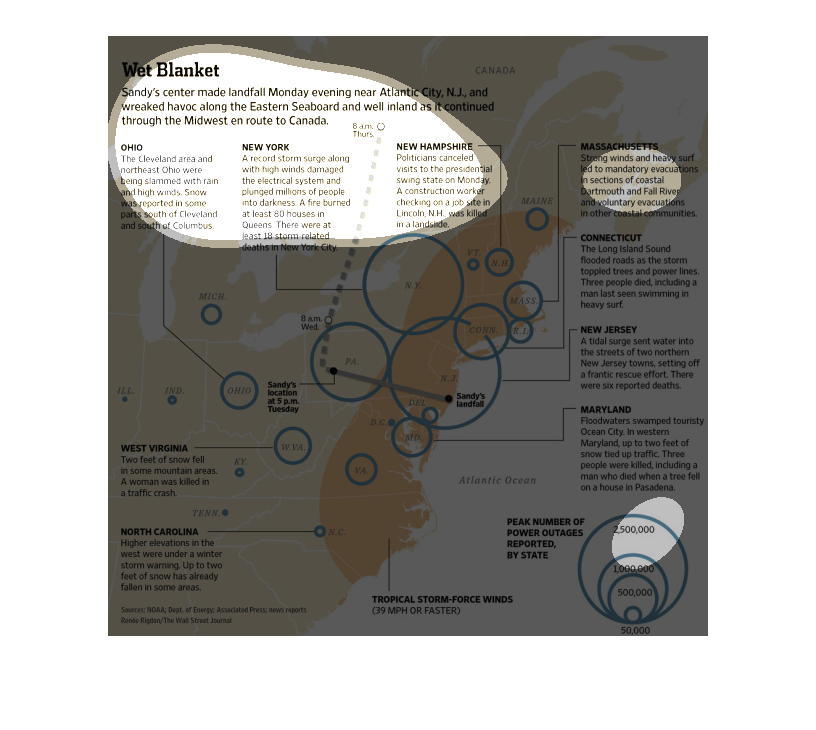
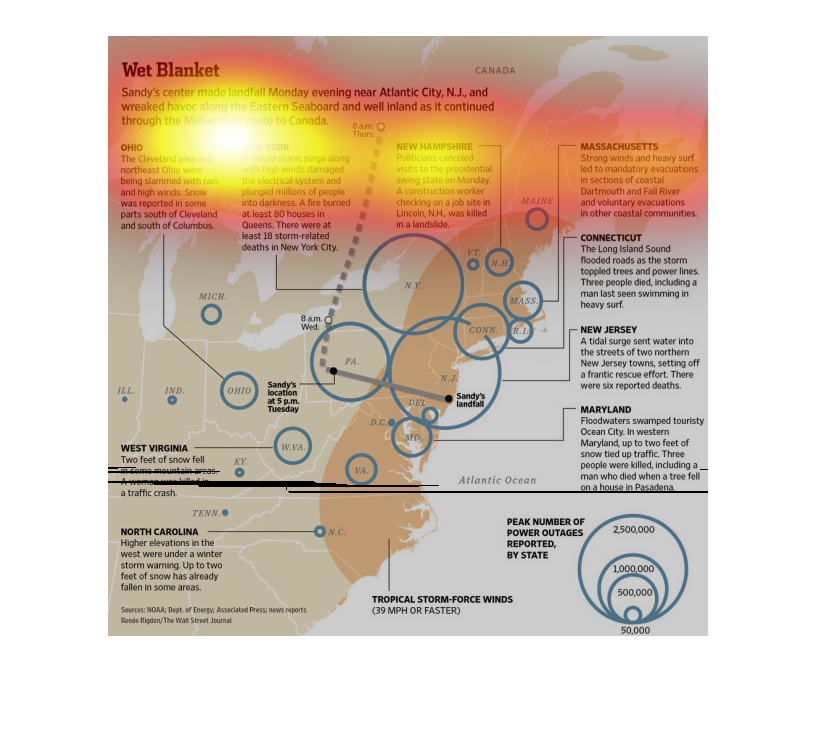
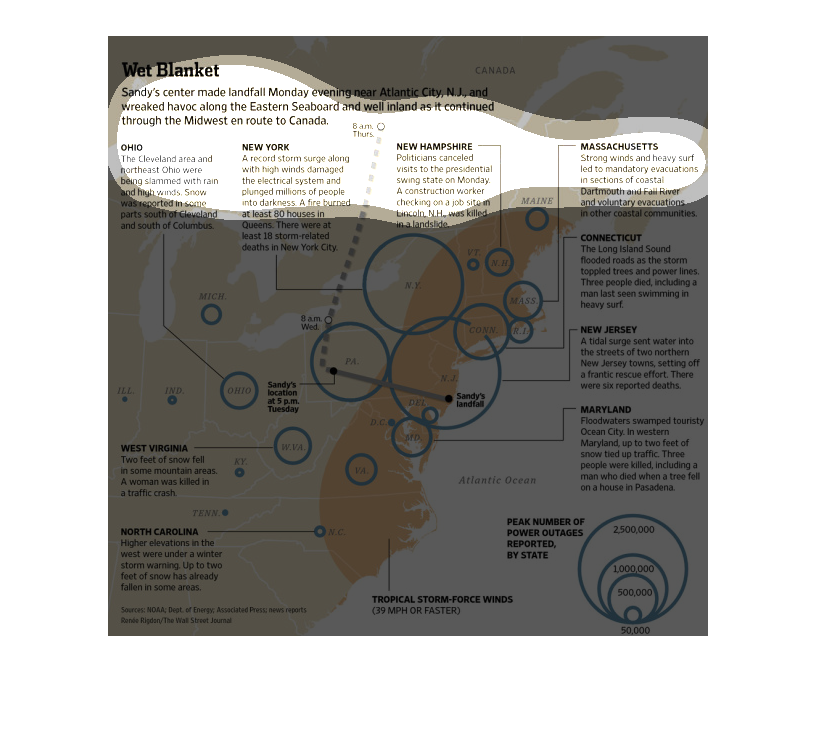
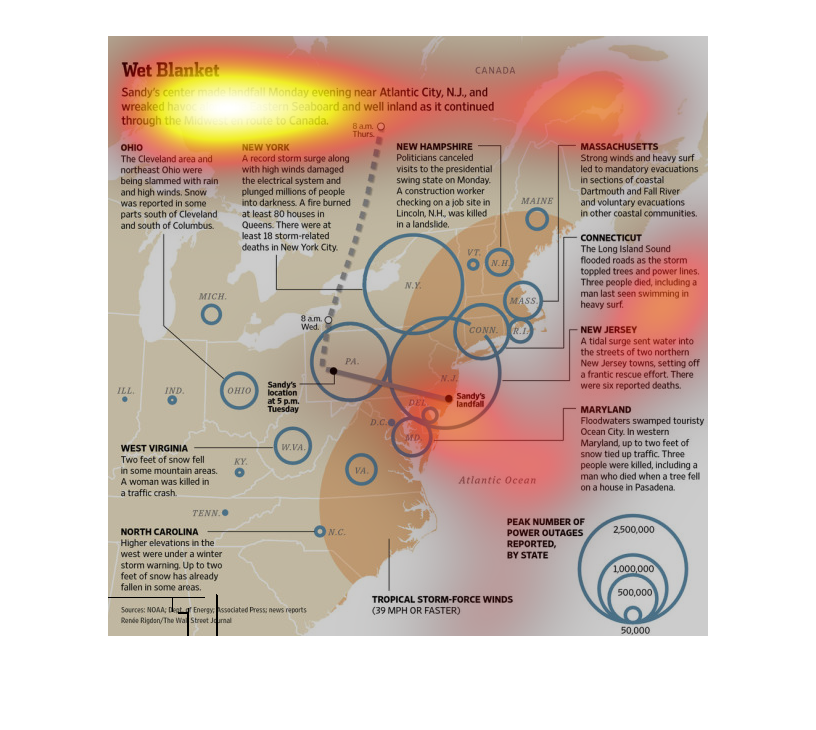
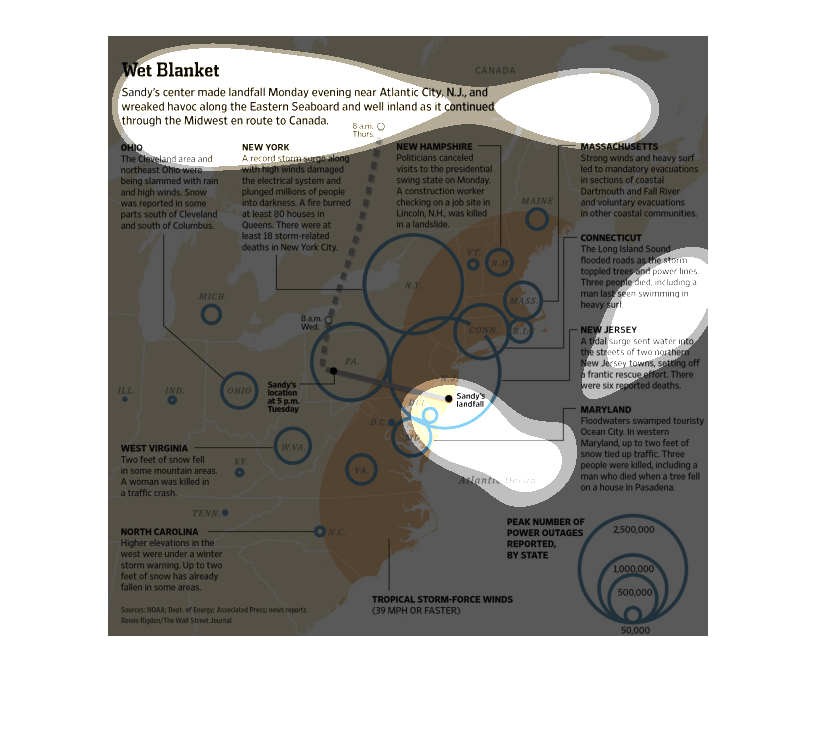
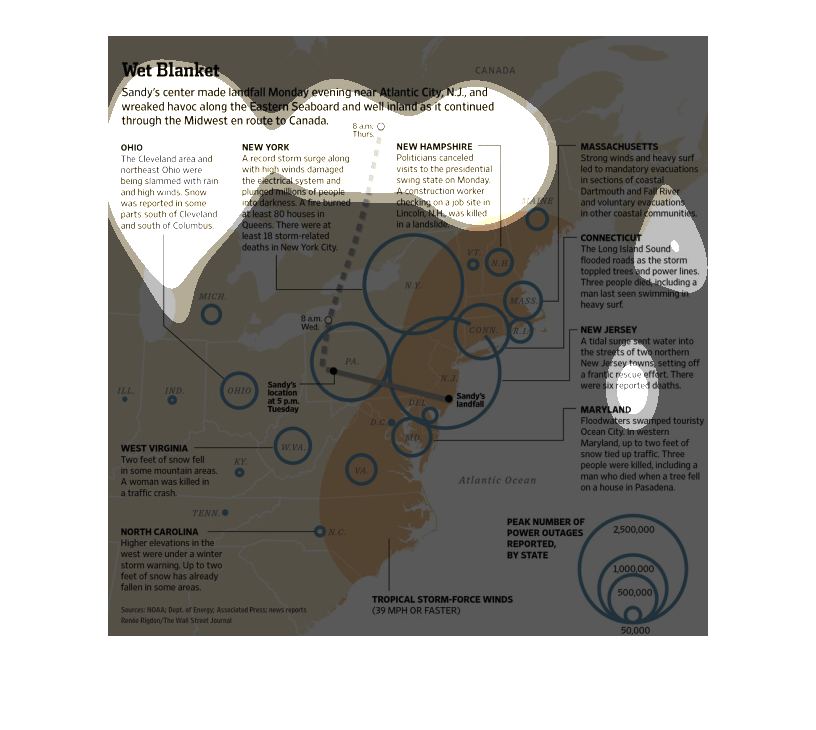
This image is entitled "Wet Blanket."  It shows Sandy's center made landfall Monday evening
near Atlantic City, NJ, and wreaked havoc along the Eastern Seaboard and well inland as it
continued through the Midwest and into Canada.  The impact area is shown from Maine down to
North Carolina.  Each affected state is detailed as to the extent of anticipated impact.
The data was from The Wall Street Journal.
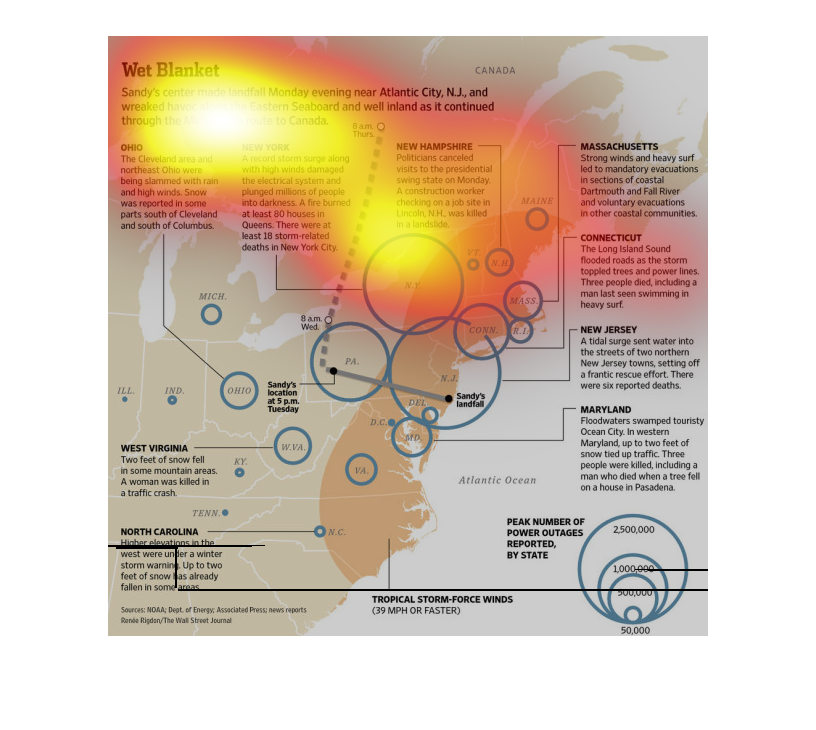
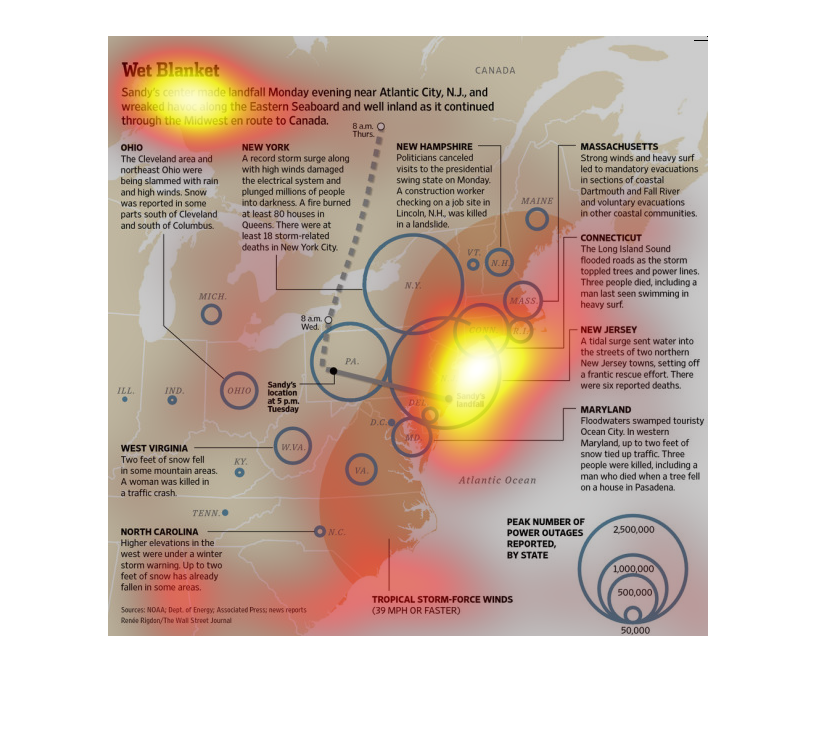
This chart from the Wall Street Journal shows how superstorm sandy affected the northeast
corridor in 2012 and where the main damage was done around New York City
The figure presented to the left is titled Wet Blanket.  The figure is a representation of
the statistical research data for Sandy's center making landfall.
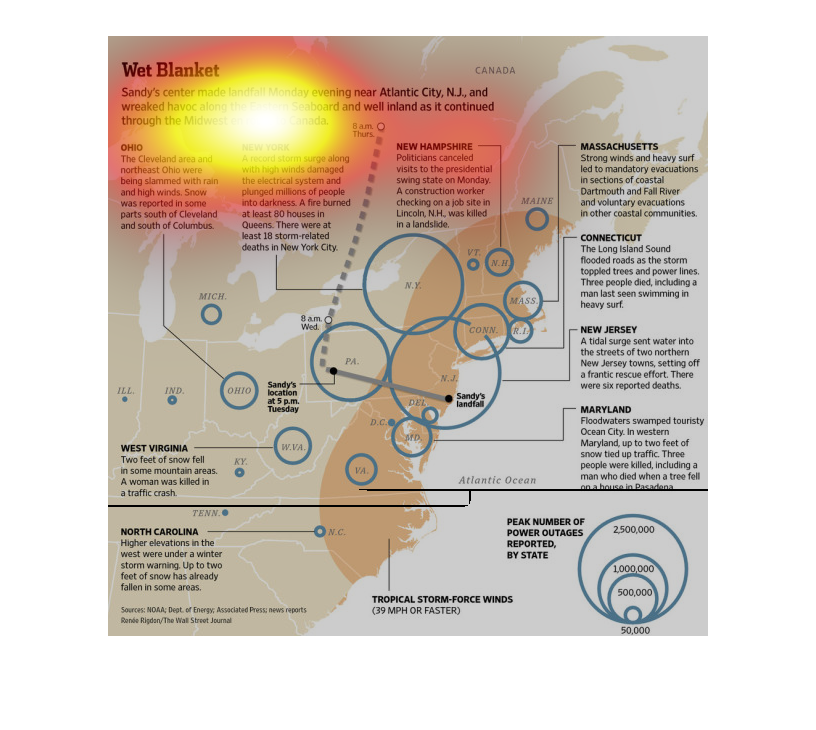
This chart from the Wall Street Journal shows how Superstorm Sandy wreaked havoc and damage
to the New Jersey and New York metro areas in 2012 and the repairs needed
This chart describes your typical graph chart that sets up one or a number of categories,
illustrated by either a map, a graph, an illustration, or photographs, ect.
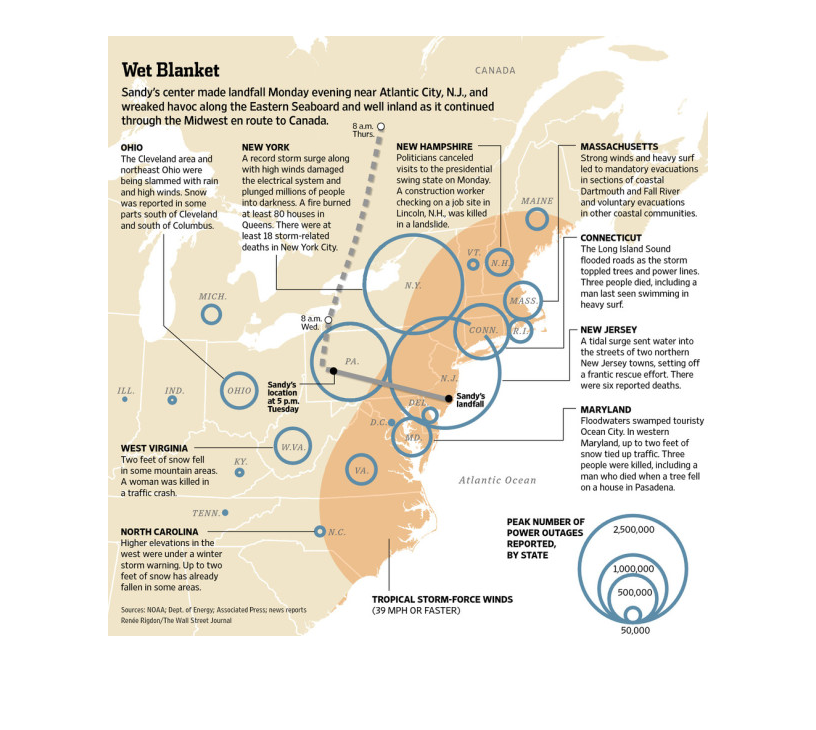
The image depicts the central landfall of Hurricane Sandy near Atlantic City, NJ. The map
shows hurricane damage across the entire east coast, covering different states, with New jersey
receiving massive damage.
This image shows or depicts in various statistical formats data concerning hurricane Sandy
and how it made landfall which wreaked havoc over the eastern seaboard.
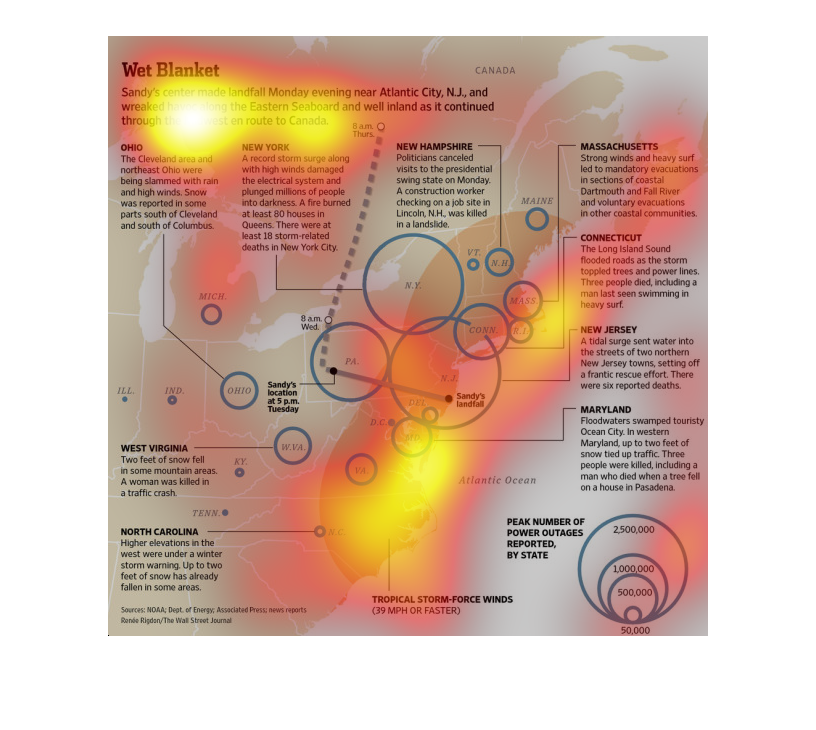
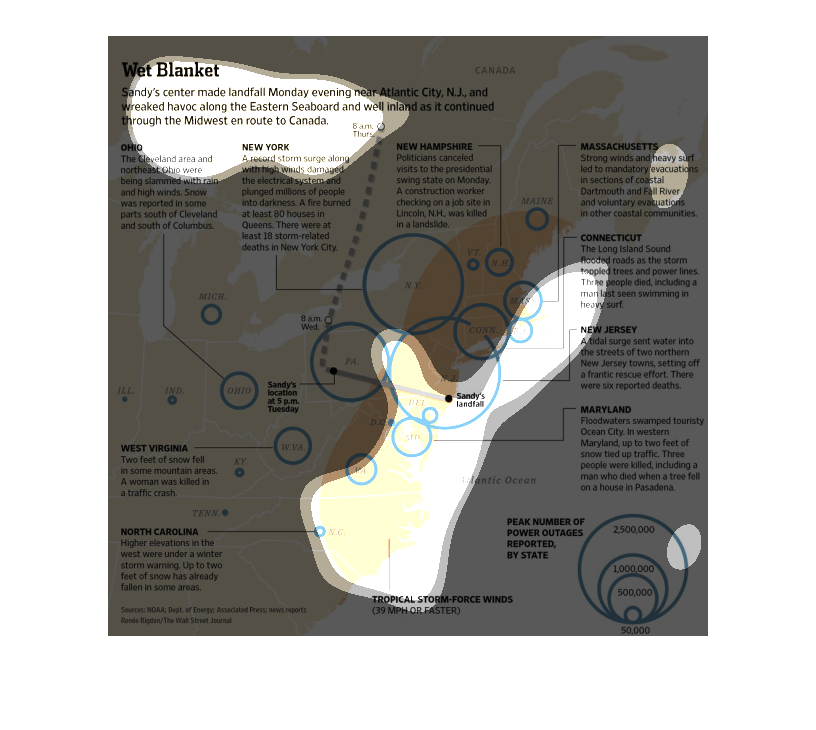
This chart shows the storm Sandy's impact on the United States and Canada. It shows the times
of impact and describes the strength of the storm. It lists different states that were affected
and when. It also shows the peak number of power outages.
This is graph that also functions as a timeline, showing the damage and effect that Hurricane
Sandy had as it cut a swath through the east coast back in 2012.
The effects of hurricane Sandy are still being felt now, even years after the massive damage
done to property has been mostly fixed, the reprocosuions of the hurricane has changed things
considerably.
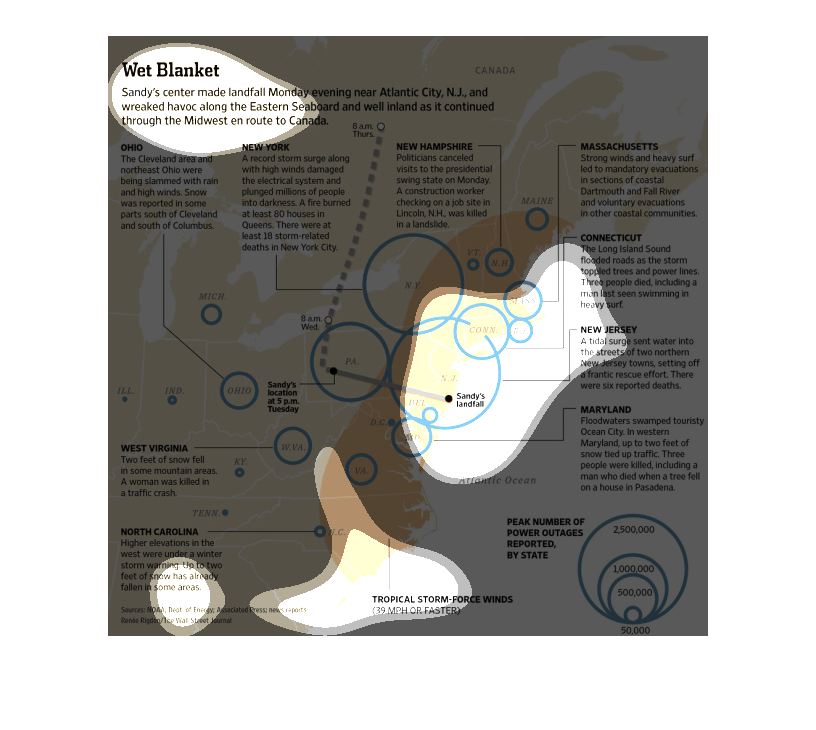
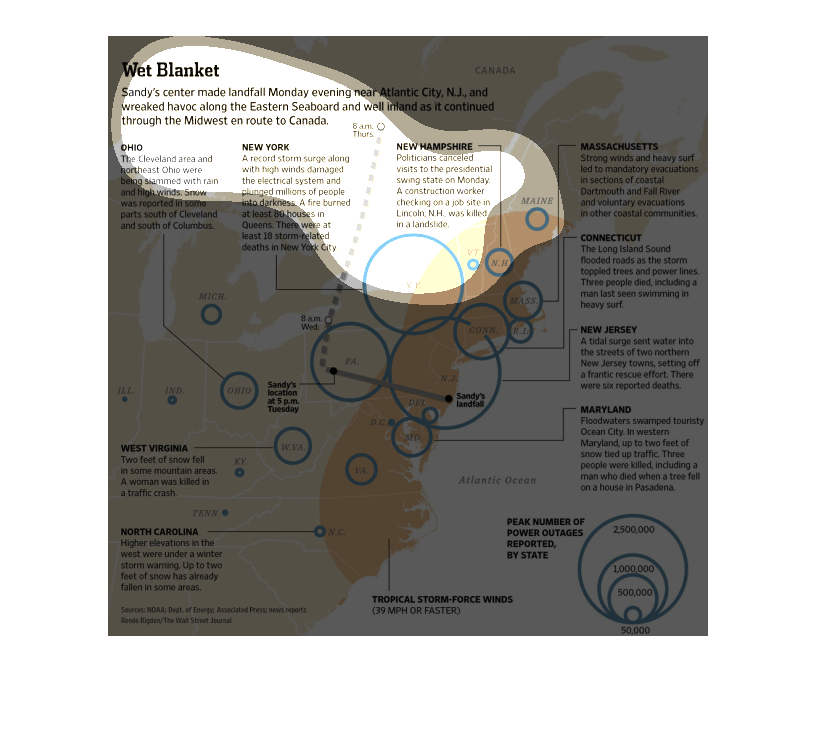
This image discusses Sandy the Hurricane. It includes an image wide graphic of the storms
path through the US.  Text annotates this map, describing what happened at certain points.
For instance, when it reached New Hampshire, presidential politicians cancelled visits to
this swing state.