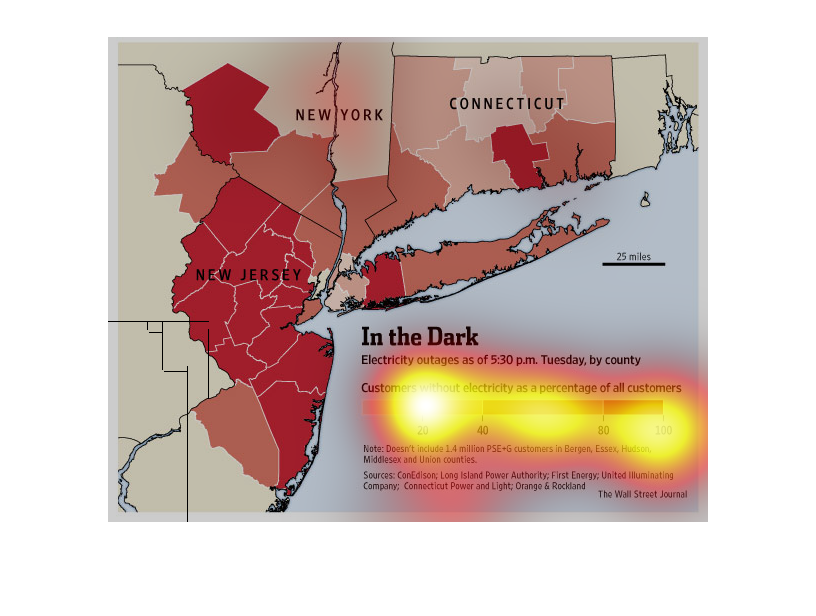
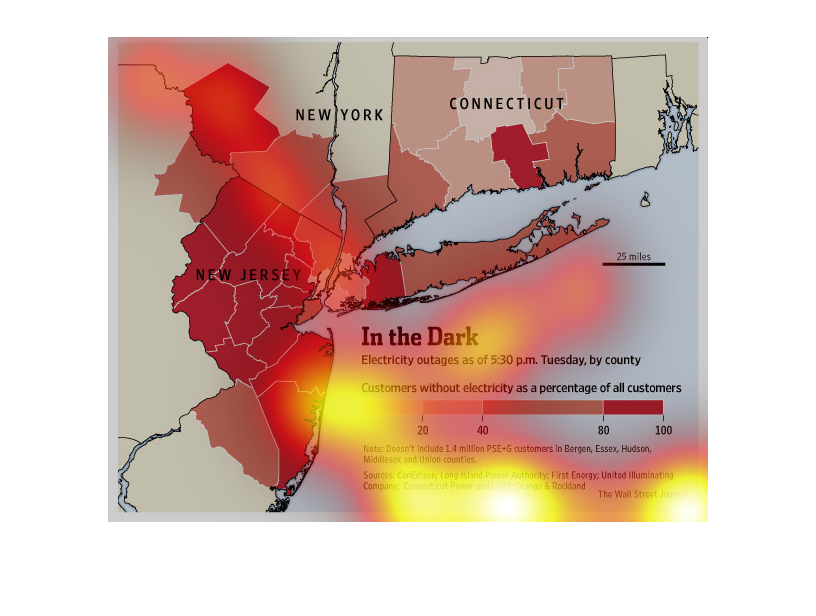
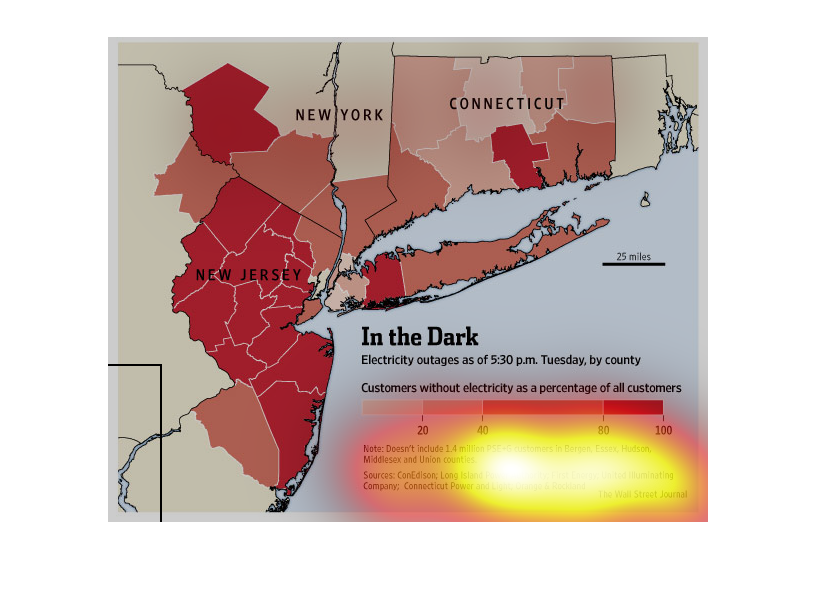
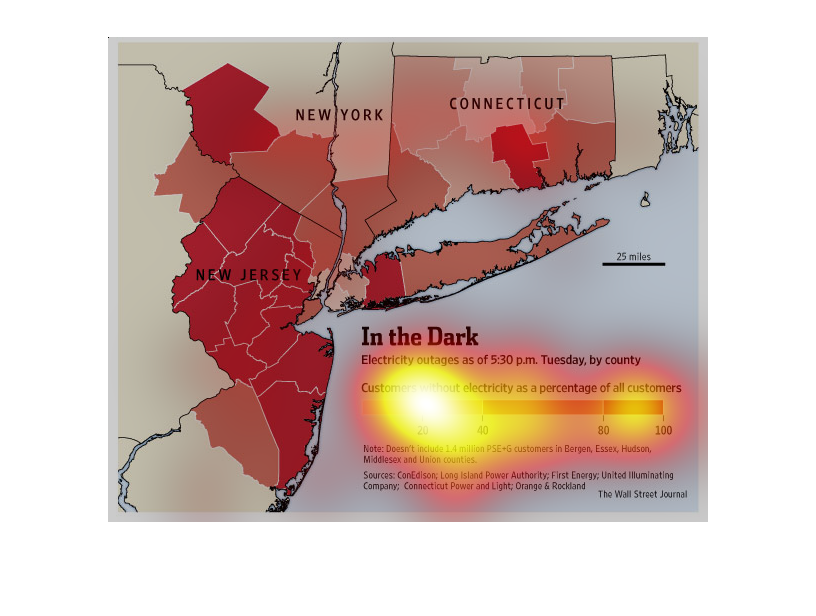
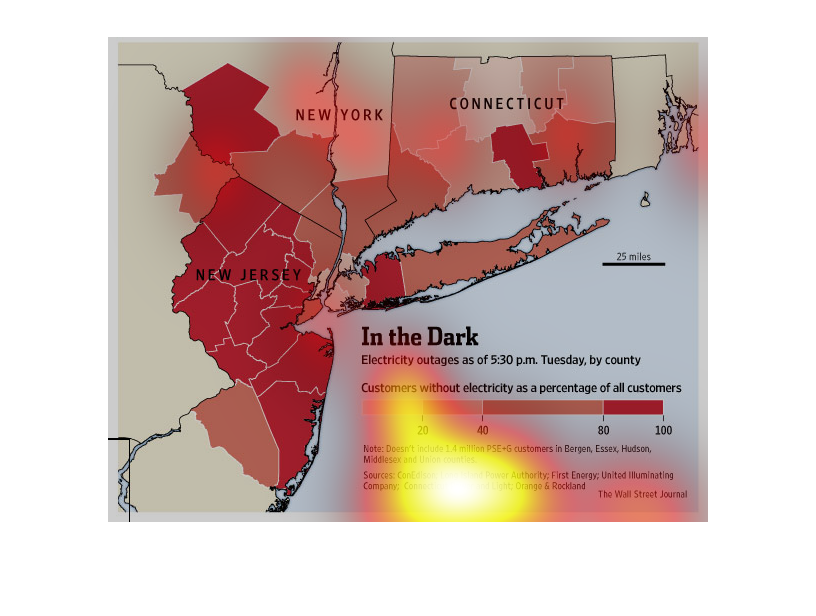
This chart from the Wall Street Journal shows how power outages were severe in the New York
City and New Jersey areas because of the damaged caused by Superstorm sandy

This chart shows a Map of the state of New York, New Jersey, and part of Connecticut. The
chart is Titled in the dark. Electricity outages as of 5:30 PM, Tuesday, by county.
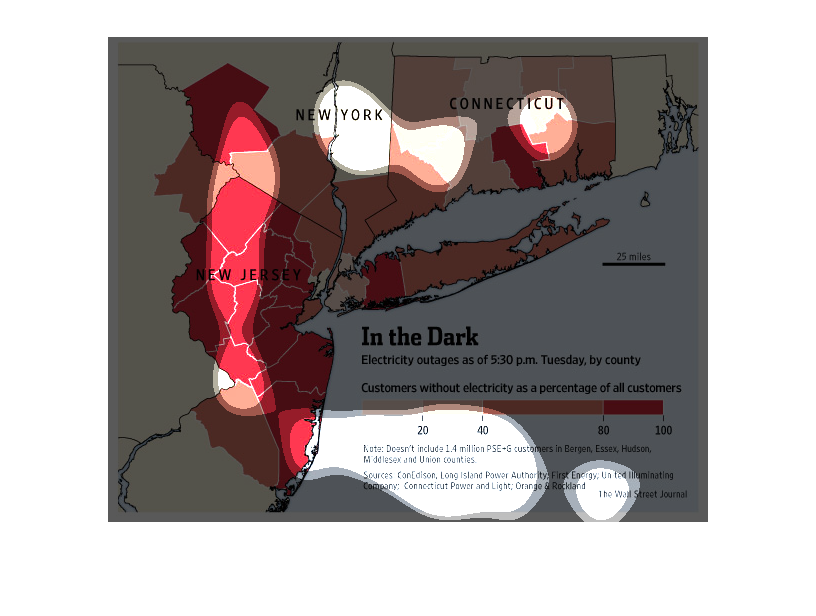
This is a chart detailing electricity outages and percentage of population without electricity
in the New York area including a Northeast United States map.

This chart shows electric outages by region.  The region appears to be on the east coast,
New York, New Jersey, and Connecticut. New Jersey was hit the hardest with almost 100% of
people without electricity
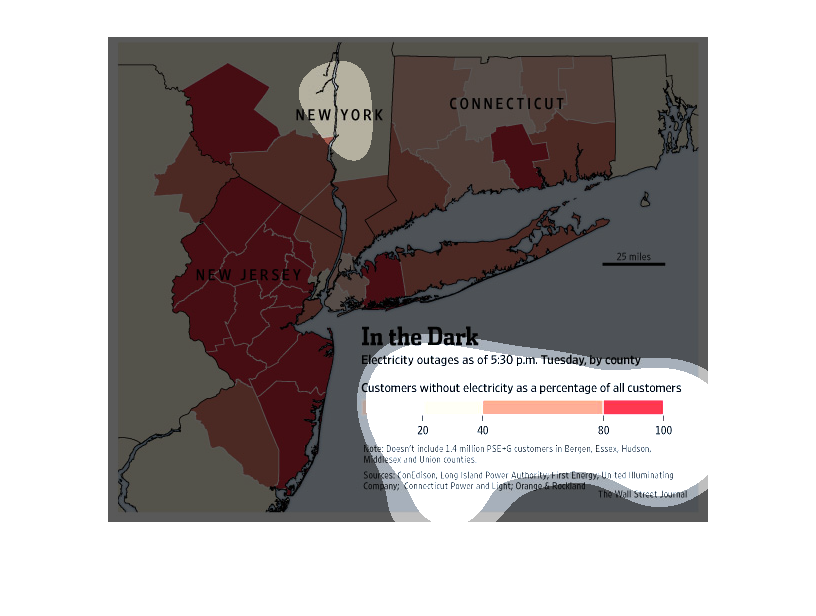
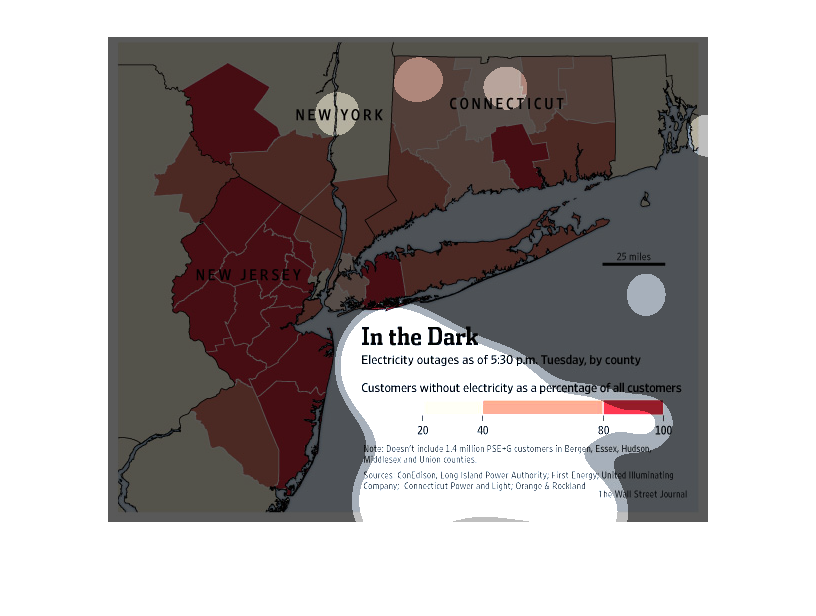
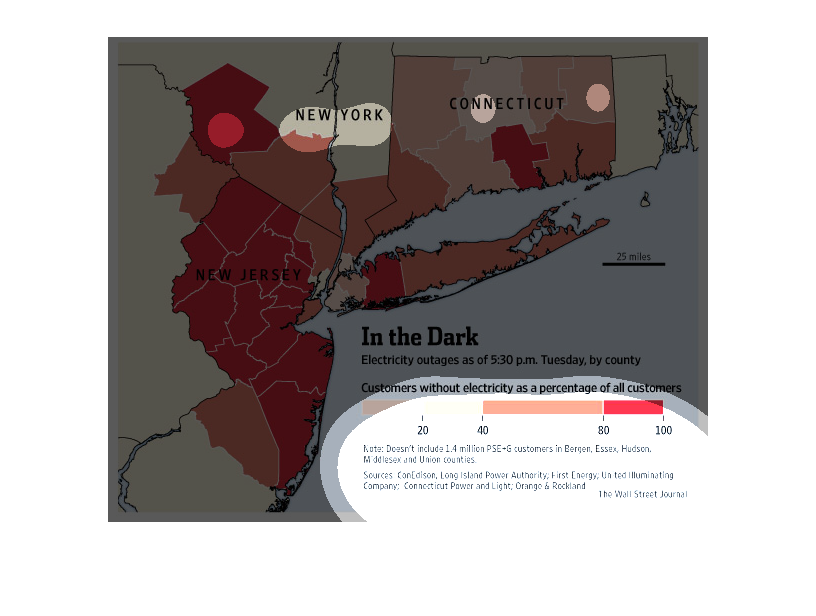
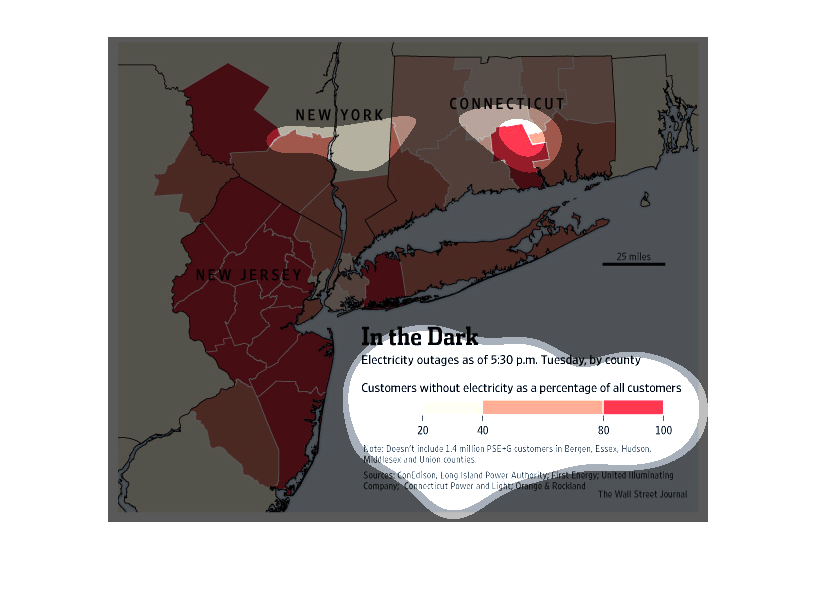
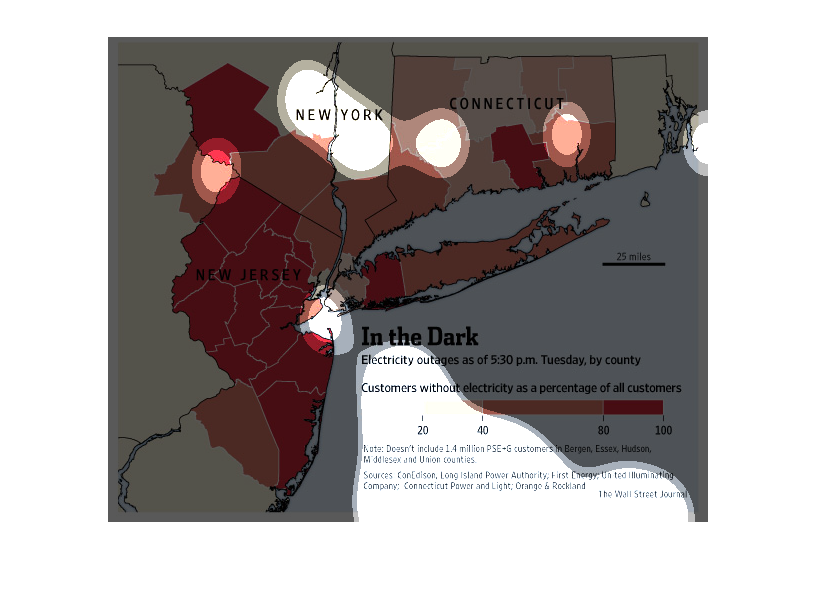
This graphic is a map of the east coast of the United States. It focuses on states in the
broader New York City area, including places like New Jersey. The map shows the impact of
electricity outages on this region in recent years, likely as a result of storms.
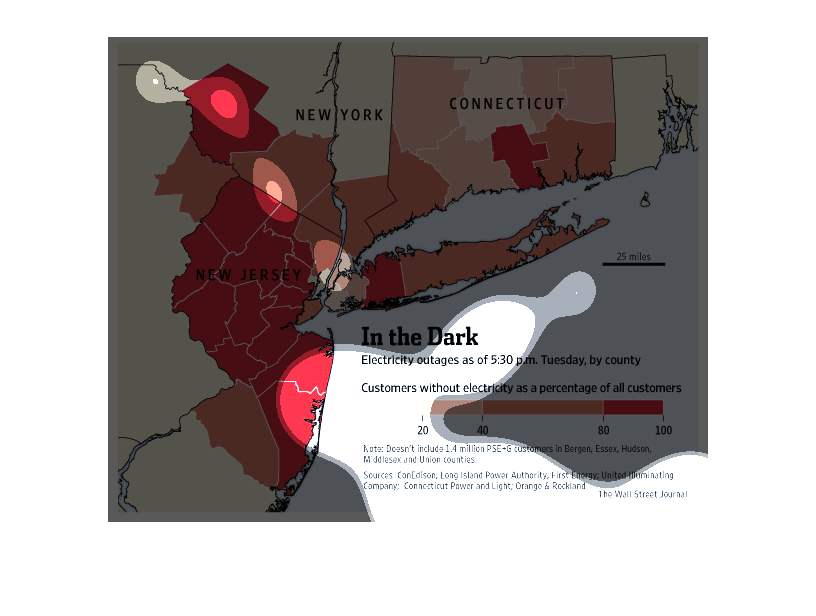
This chart from the Wall Street Journal shows which areas in the northeastern United States
experienced power outages as a result of superstorm sandy
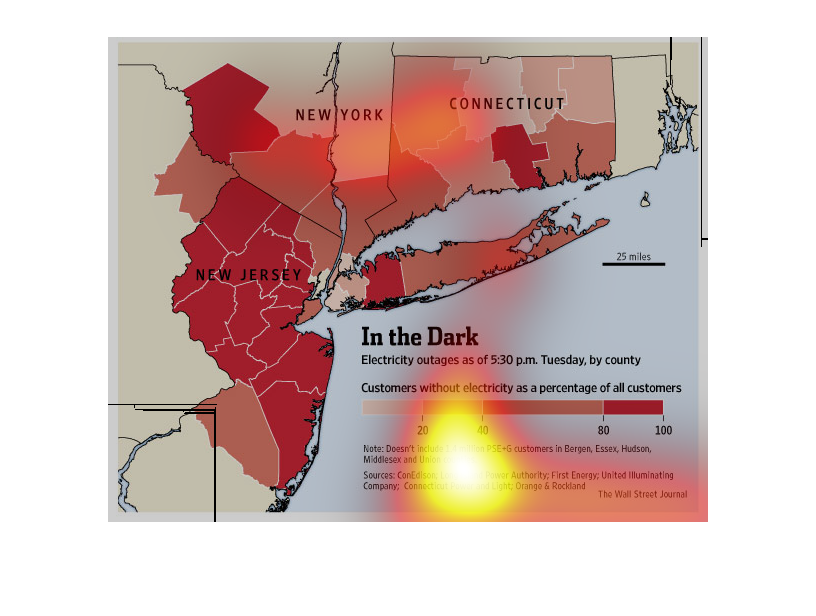
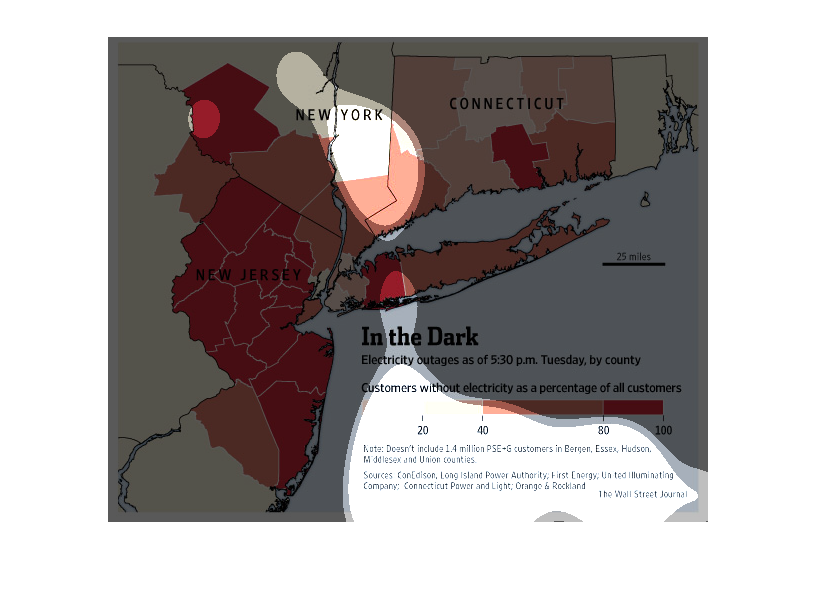
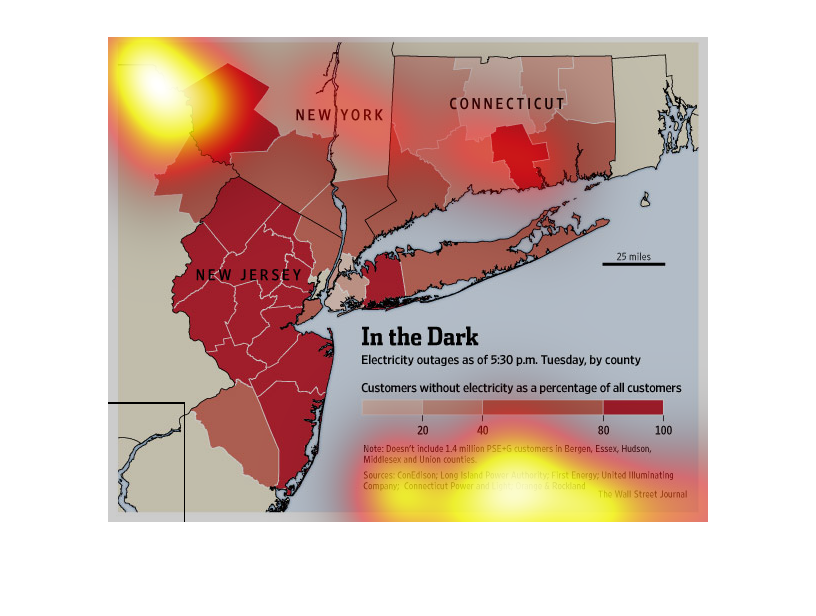
This chart represents electricity outages by county on a Tuesday at 5:30PM. It compares the
number of customers without electricity in relation to all customers.
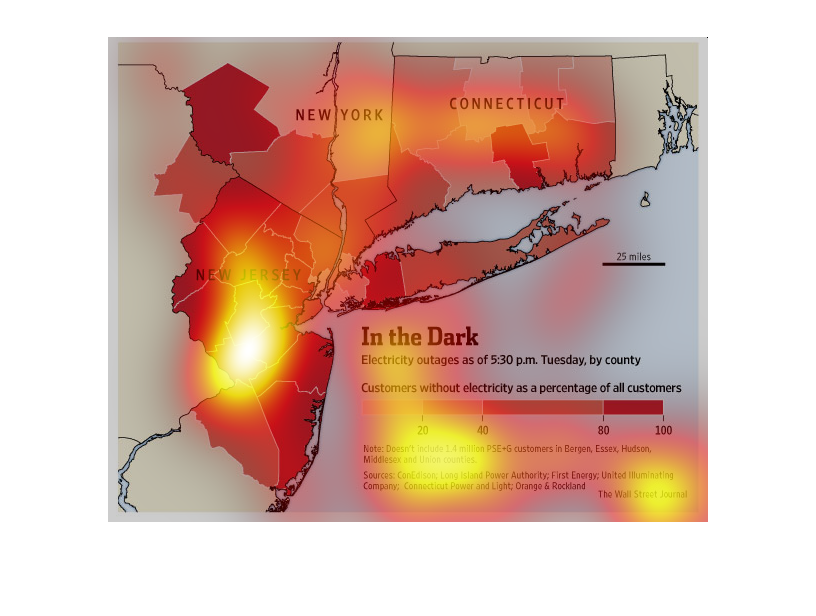
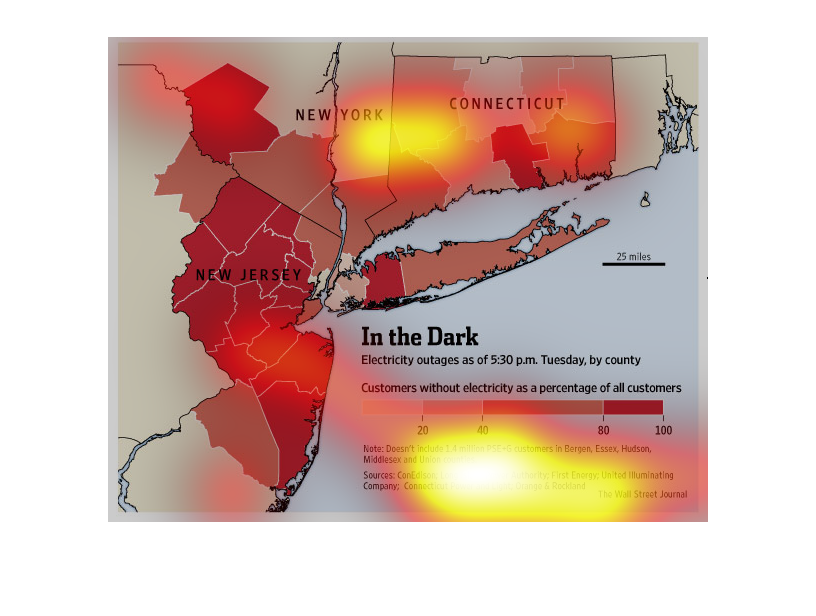
The image depicts the electricity outages as of 5:30pm Tuesday, by county in New Jersey, New
York and Connecticut. Many counties have either nearly 100% outage or 100% outage.
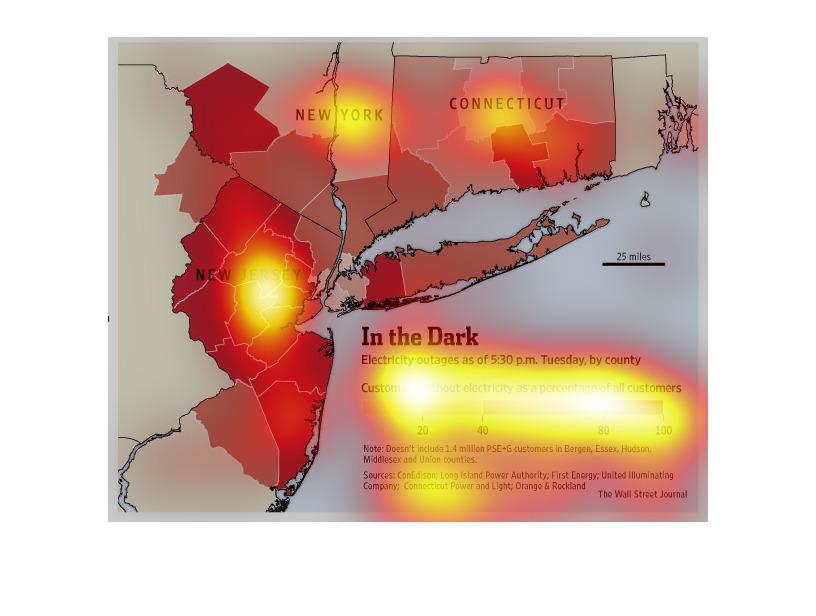
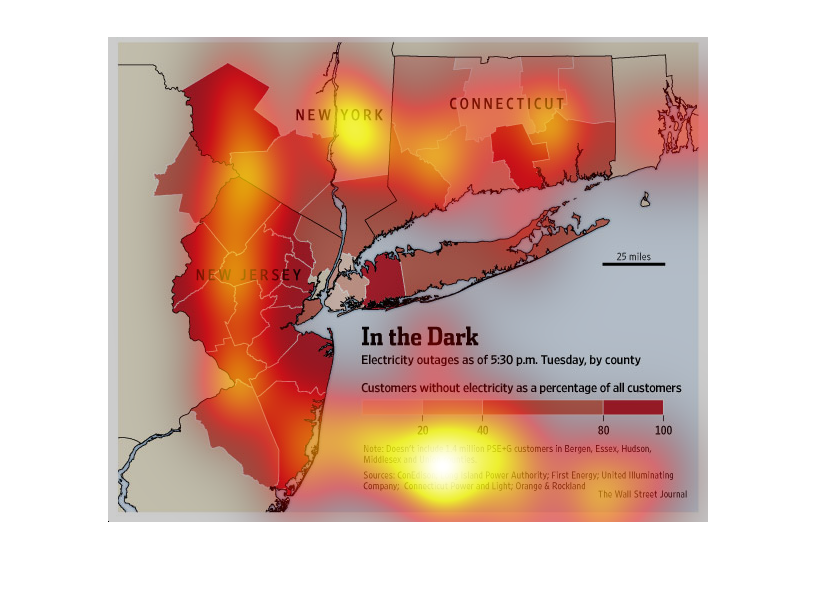
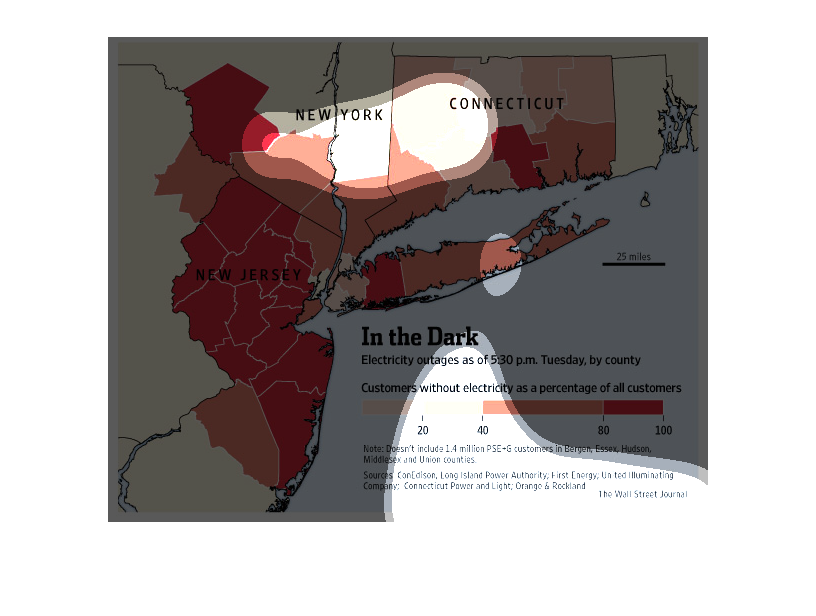
This image shows a map of northeastern United States and the location of power outages by
county. The severity of the power outages was determined by the number of customers without
power.
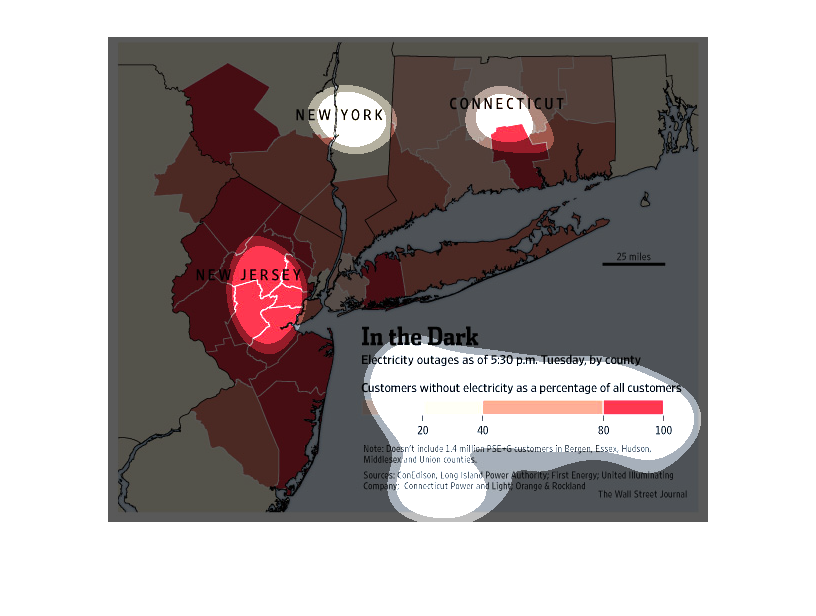
This is a map of the greater New York City area, with surround states like Connecticut.  It
shows the electricity outages as of a certain date and time. Using color, it is clear the
outage is widespread, encompassing most of New Jersey, for instance.
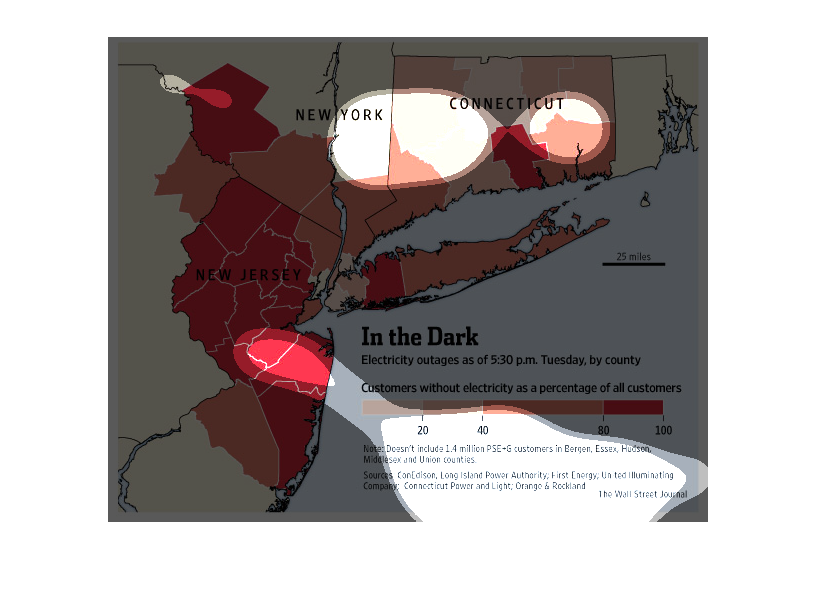
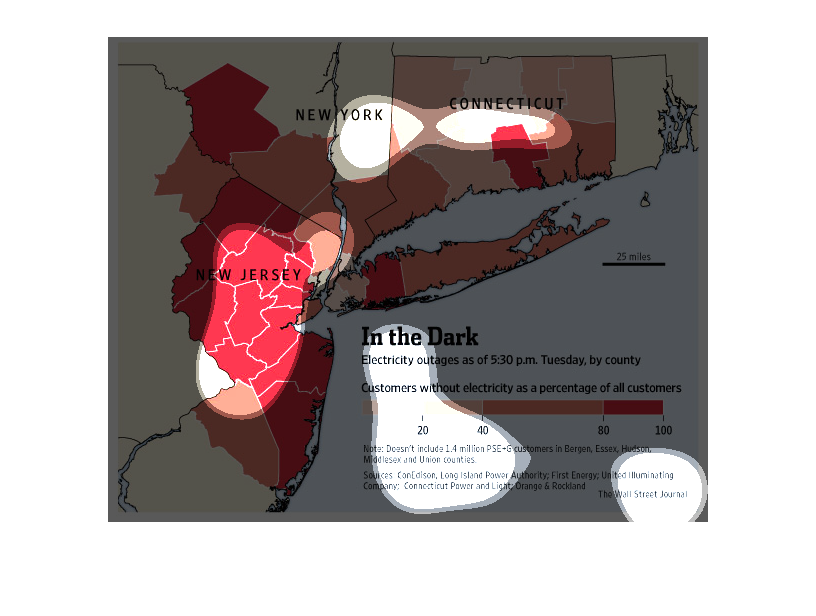
This is a map that is illustrating the areas that were effected by a power outage at 5.30
pm Tuesday. It shows the specific counties that were affected.
The figure presented to the left is titled In the Dark.  The figure is a representation of
the statistical research data for electricity outages on Tuesday.
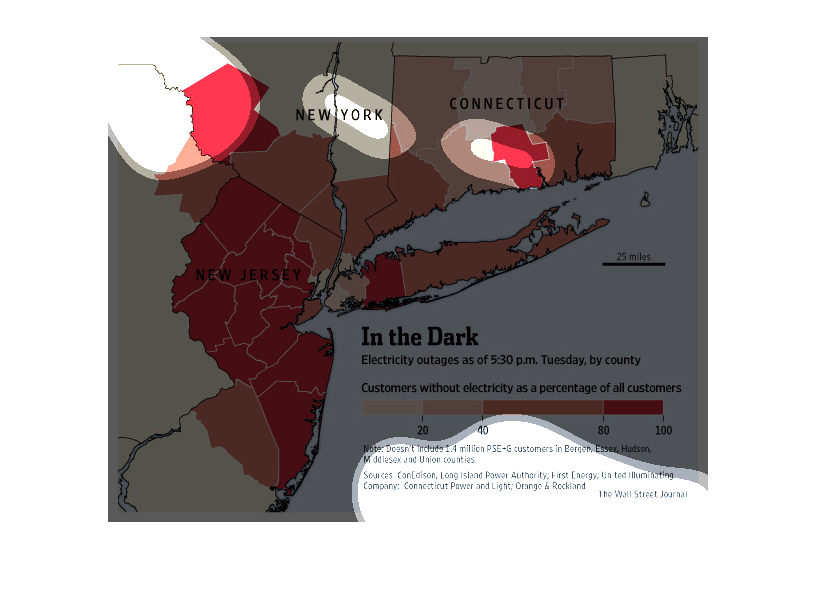
This chart describes and depicts the electricity outages as of five thirty p.m. tuesday by
country. Also it shows the customers without electricity as a percentage of all.