Comparison of the Human Model and Potential Field Method for Navigation

  Before starting to compare the two methods, you may first want to check the following links for a step by step construction of the formulas of both methods to gain insight about their specific properties. The step by step constructions make it very easy to understand how the parameters in the formulas can be used to tune the performance:   Let's begin by looking at a typical performance demonstration of both methods in an example scene:
 
Room dimensions: 5 x 6.5 meters
Smaller tick mark period = 10 cm
Larger tick mark period = 100 cm

Green dots are obstacles.
Blue dot is the target.
Agent starts in upper right corner with heading = 0 degrees (facing +x axis)

White path is traversed with potential field method.
Cyan path is traversed with human model.

In both trials, the constant speed of the agent was 0.5 meters/sec.
White path was traversed in 13.2 seconds. (Length = 6.6 meters)
Cyan path was traversed in 11.2 seconds. (Length = 5.6 meters)

The gray circles around the obstacles show the influence distance (0.8 meters) of the obstacles, which is used while potential field method was controlling the agent.

(NOTE: Although the starting points of the paths do not seem to match, the agent starts at the same point with the same heading angle for both methods. This is a technical detail about the modification of the potential field method to be applicable in the simulation software.)

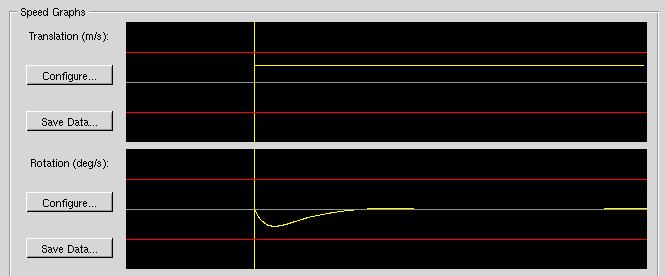
  The speed graphs for the human model (yellow lines) are given below ( the red lines of the translation graph are 0.9 m/s and -0.9 m/s, and the red lines of rotation graph are 167 degrees/sec and -167 degrees/sec, respectively.)  (These graphs can also be plotted using the following matlab data files: Translation data file, Rotation data file)

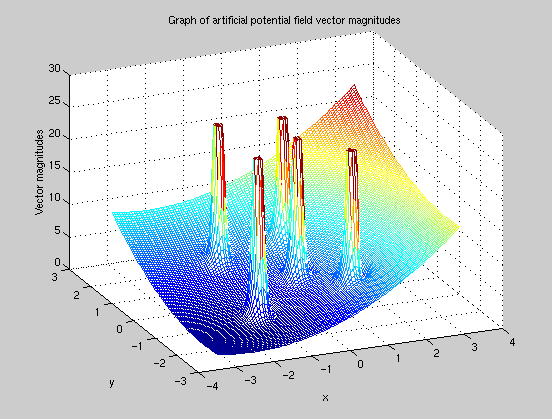
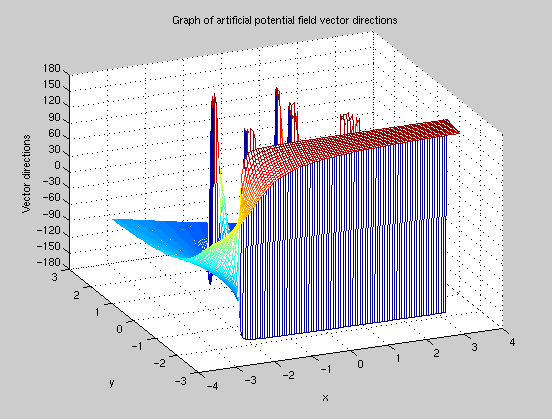
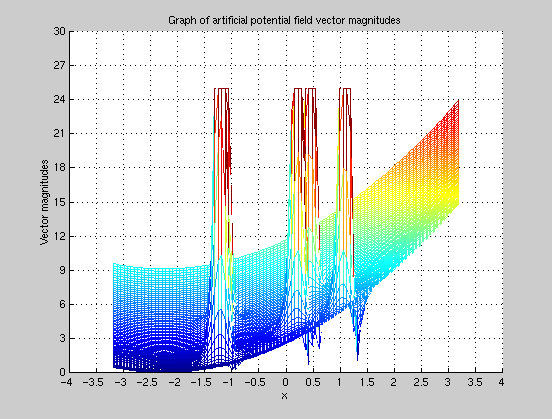
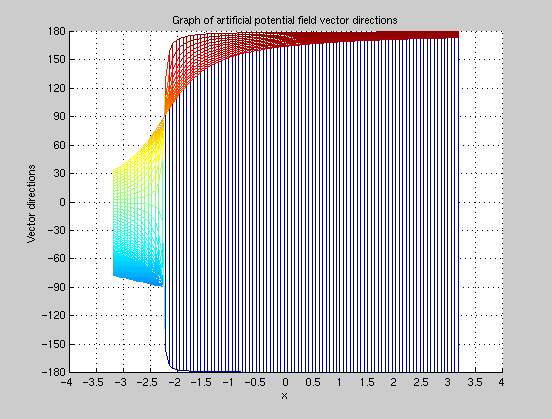
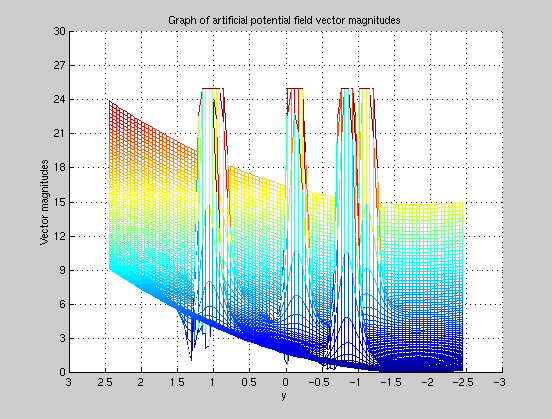
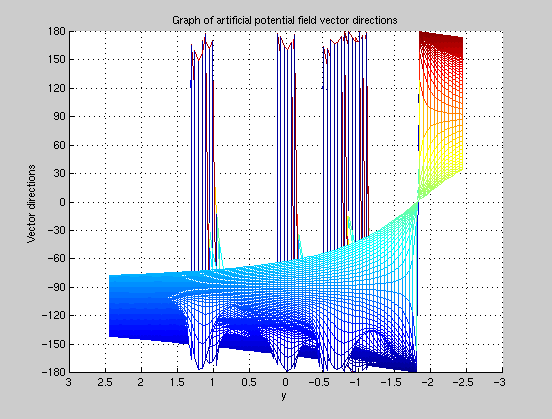
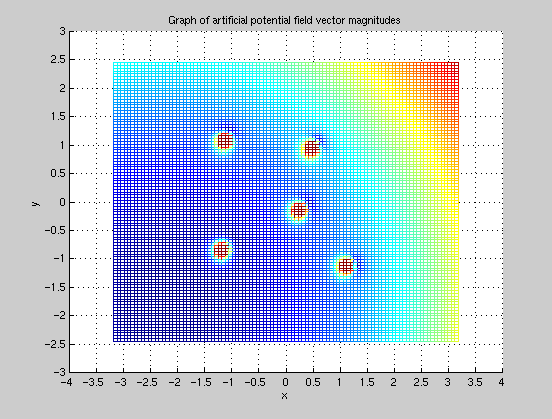
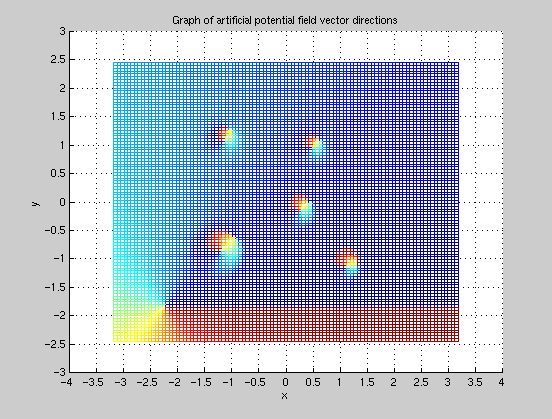
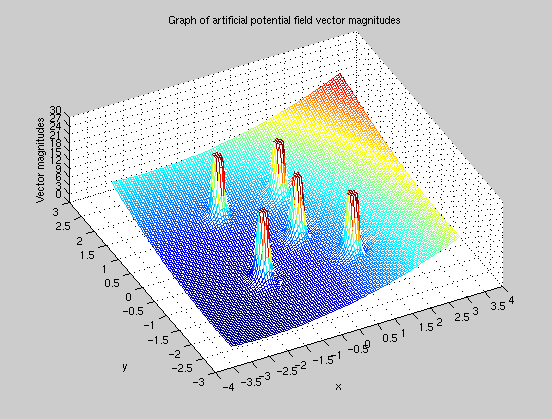
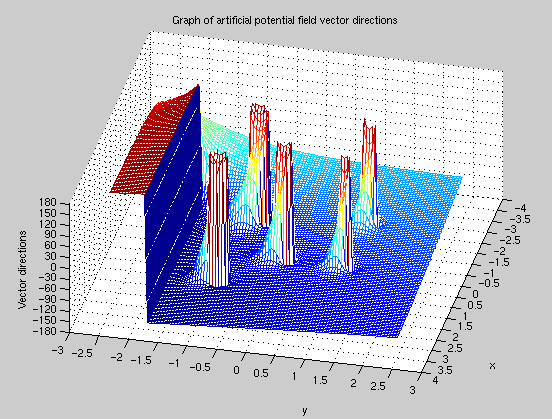
  And the overall artificial potential field in the room is shown (in 5 different views) by the graphs below. (The room is sampled by a 100 x 100 matrix of evenly distributed cells in both x and y directions.)

  The graphs on the left show the magnitudes of the vectors, and the graphs on the right show the directions of the vectors from the same point of view. Only the 5th graphs of both columns are taken from random viewpoints, and do not match with each other.

  Note that the tips of the vector magnitude cones are actually extending to infinity, they are trimmed for better plotting.

  The matlab data file is also available: Potential field data file


  Having seen a typical example, we can now discuss some major differences between these two navigation methods:

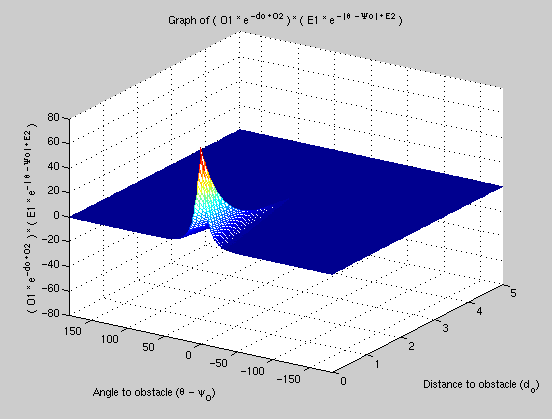
The obstacle parts of both methods are shown below:

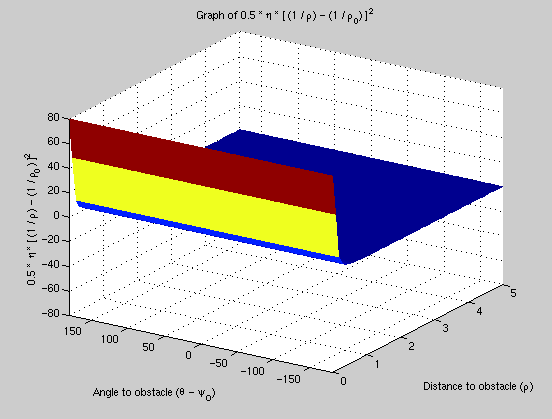
Human model obstacle part
(E1 = 8, E2 = 7, O1 = 10, O2 = 1.6)

Potential field method obstacle part
(Eta = 1, rho_0 = 4)


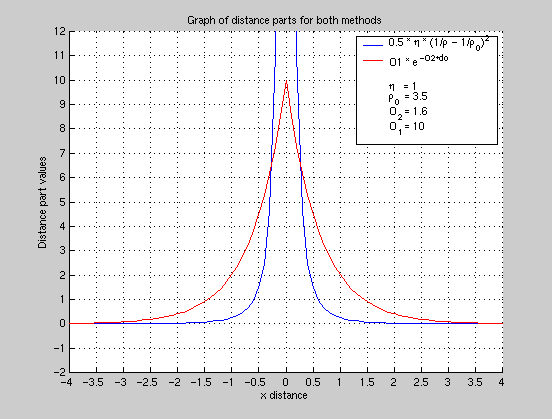
In the first experiment, I tried to adjust the distance part of the potential field method to match with the distance part of the human model (the emphasis is on the influence distance). I did not change the parameters of the human model which were well-tuned for this experiment.

In the graph on the left side, the distance part of the human model is plotted with red, and falls to zero around 3.5 meters. So, I used 3.5 meters as rho_0 (object influence distance) for the potential field method. The resulting distance part of the potential field is plotted with blue in the same graph.

The parameters for the human model were:
B = 3.25, K = 2.5, G1 = 3, G2 = 0.5, E1 = 8, E2 = 4, O1 = 10, O2 = 1.6
(E2 is lower than the usual value (7), to account for the "width" of the obstacle, i.e.  to get a collision-free run.)

And the following were the assignments for potential field method parameters:
k_p = 1, eta = 1, rho_0 = 3.5

The result of the simulation is given below:

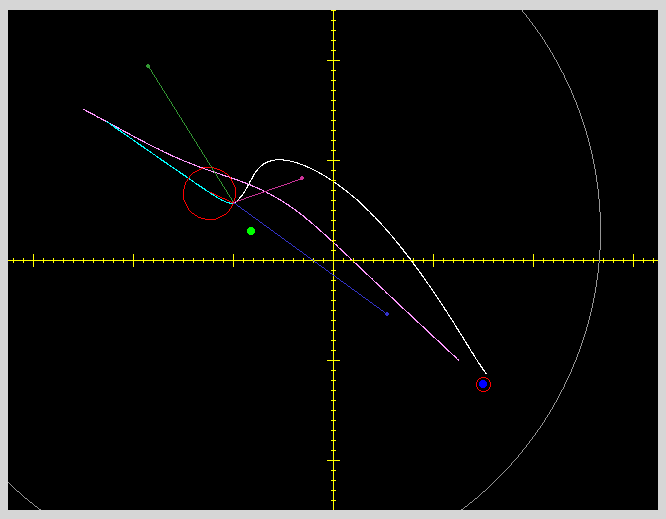
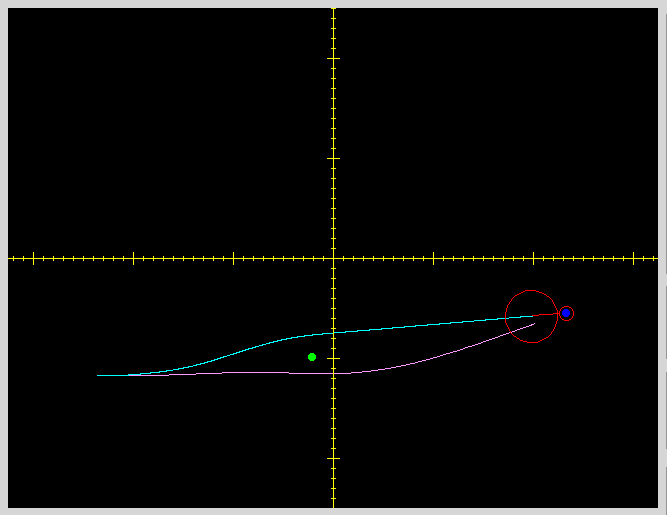
Room dimensions: 5 x 6.5 meters
Smaller tick mark period = 10 cm
Larger tick mark period = 100 cm

Green dot is an obstacle.
Blue dot is the target.
Agent starts in upper left corner with heading = -28 degrees (almost facing the obstacle)

The common translation speed used for both methods is 0.5 m/s.

Magenta path is traversed with human model.
Cyan path is traversed with potential field method, and the agent will continue with the white path under the control of potential field method.

The dark green vector shows the repulsive force of obstacle, the dark blue vector shows the attractive force of the target, and the purple vector is the resultant vector. The darkgray circle is the object influence region for the potential field method.

As seen in the figure, the obstacle repulsive force has a large magnitude, but a small lateral component (due to the nearly "head-on" approach to the obstacle), so the agent should come close enough to the obstacle before the repulsive force lateral component can steer the agent away.

The second experiment is in fact aimed to give its fair share back to the potential field method, and demonstrate the importance of tuning both parts of the obstacle component of the human model together (tuning each part in isolation did not work very well in my experiments).

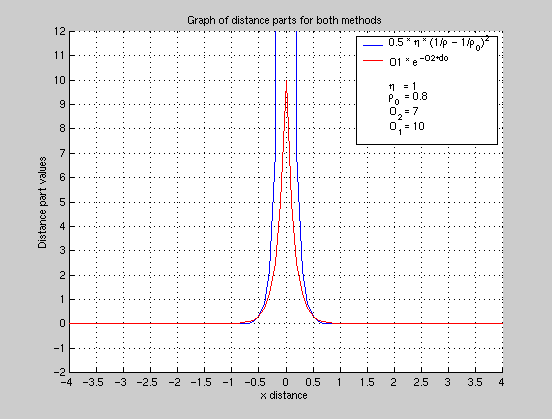
This time, I tried to adjust the distance part of the human model to match with the distance part of the potential field method. The parameters of the potential field method were the ones that I usually used in my simulation experiments:

k_p = 1, eta = 1, rho_0 = 0.8

The graph on the left side shows the distance part of the potential field method in blue. The influence distance is 0.8 meters. So I tried to have a similar influence distance (as close as possible) for the human model by playing with the O2 parameter (result is shown in red).

The parameters for the human model were:
B = 3.25, K = 2.5, G1 = 3, G2 = 0.5, E1 = 8, O1 = 10, O2 = 7

The result of the simulation is given below:

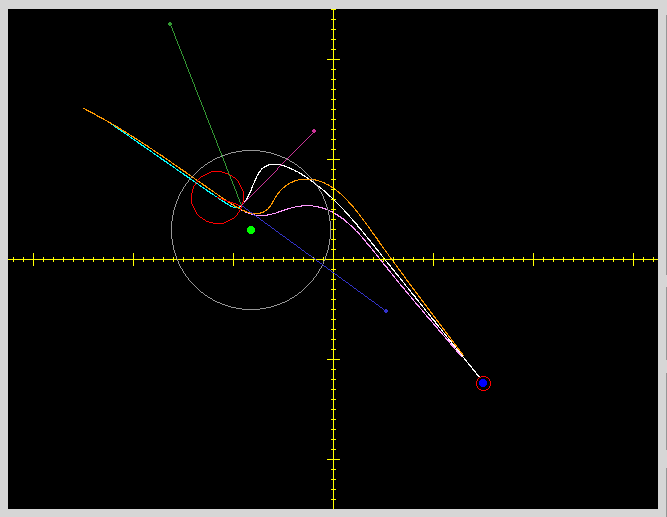
All the geometric settings are the same with the first example. And again, the common translation speed used for both methods is 0.5 m/s.

Magenta path is traversed with human model ( E2 = 1 ).
Orange path is traversed with human model ( E2 = 0.5 ). (As we try to correct the behavior, we are getting worse results, and the path starts looking more like the path of potential field method. Similar sudden rotations start to occur.)
Cyan path is traversed with potential field method, and the agent will continue with the white path under the control of potential field method.

The dark green vector shows the repulsive force of obstacle, the dark blue vector shows the attractive force of the target, and the purple vector is the resultant vector. The darkgray circle is the object influence region for the potential field method.

As seen in the figure, if the distance part is not tuned properly, trying to correct the behavior of the human model by modifying parameters of the direction part does not suffice. The influence distance is too small for the human model in this example (and it is not collision-free if you take the width of the agent into account), but potential field method is always collision free (unless, of course, the influence region is set to 0 meters).


Room dimensions: 5 x 6.5 meters
Smaller tick mark period = 10 cm
Larger tick mark period = 100 cm

Green dot is an obstacle.
Blue dot is the target.
Agent starts in lower left corner with heading = 0 degrees (facing +x axis)

Magenta path is traversed with 1.0 m/s constant translation speed.
Cyan path is traversed with 0.25 m/s constant translation speed.

For the magenta path: the agent started a positive (counter clockwise) rotation towards the target, but since it was fast, it only had a small time to rotate (and a small total rotation). And then the obstacle influence pushed the agent downwards.

For the cyan path: the agent started the same positive rotation towards the target and before the influence of the obstacle took effect, it made a large enough turn, so that the further influence of the obstacle pushed the agent upwards this time.

  On the other hand, even though speed is also not directly taken care of by the potential field method, since the potential field method basically provides just the directions to move in, the agent always traverses the same path under different speeds.


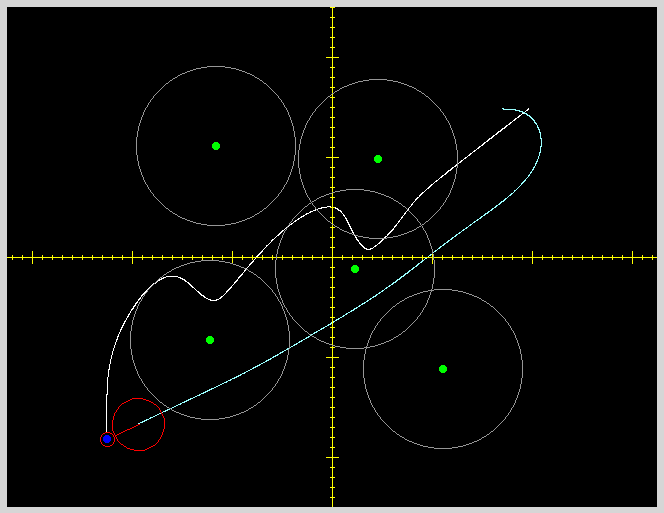
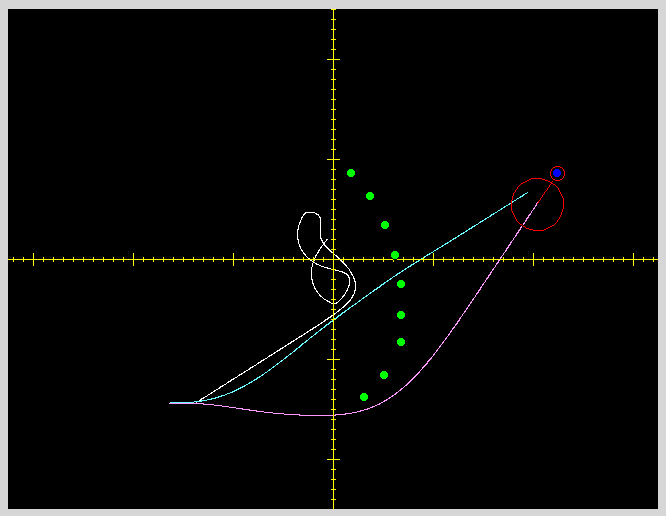
Room dimensions: 5 x 6.5 meters
Smaller tick mark period = 10 cm
Larger tick mark period = 100 cm

Green dots are obstacles.
Blue dot is the target.
Agent starts in lower left corner with heading = 0 degrees (facing +x axis)

In all of the runs, the constant translation speed was 0.5 m/s.

White path shows the local minima effect for the potential field method. The agent is stuck in a "bowl" trying to find a way out, by moving around in circles. This is one type of a local minima for the potential field method. Another type is just having zero magnitude force and getting "freezed" in a location where the attractive and repulsive forces cancel each other.

Cyan path is traversed with the human model (O2 = 1.6) The influence regions of the obstacles are not very large, and since there are obstacles on both sides of the agent, their net contribution to the rotation acceleration calculation becomes negligible along the path, and the agent tries to pass between them.

Magenta path is also traversed with the human model (O2 = 0.8) The influence regions of the obstacles are large, and they force the agent to take an outside path.


Back to Top