Measurement Errors

  1. Measurement errors do not follow a simple noise model. There are several issues:
    1. reported measurements are not monotonic with distance;
    2. the distribution of repeated measurements for the same position often is not unimodel;
    3. the “measurement noise” varies with positions;
    4. there are “outliers” (measurements off by several meters);
    5. objects outside the direct line of sight may affect the measurement;
    6. building materials with high relative permitivitty will bias measurements;
    7. there is a systematic offset that is different for different initiators and responder (and depends on the choice of bandwidth and preamble);
    8. there are large “position-dependent” errors.
    If one ignores some possible outliers, standard deviation less than 0.2 meter may be observed when the initiator and responder are in fixed positions with a clear line of sight (by the way, each distance measurement reported by the Android API is already an average of 7 round trip measurements), but this is not a good measure of the “error” (*).
    The above plots shows sequences of distance measurement for three difference combinations of (hand-held) initiator and fixed responder. Each of the plots shows four 30 second sample runs (1000 FTM RTT responses each) for a given distances. The vertical axes show reported distance measurements in meters — for actual distances of 0.5, 1.5, 2.5, and 3.5 meters (as marked on the right end of each plot). In the leftmost plot, the reported distance measurements is on average about 0.2 meter too large. In the middle plot, the reported distance measurement is on average about 1.5 meter too large. In the rightmost plot a systematic offset of about 5.5 meter has already been subtracted out. The middle plot (and to a lesser extend the leftmost plot) shows some form of quantization (to 0.03 m or perhaps to 0.06 m).

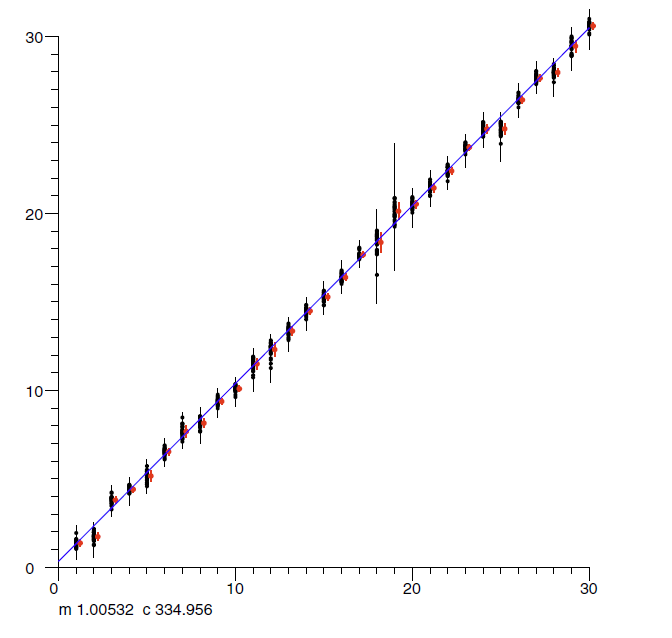
    It should be apparent that the standard deviation measured in a fixed position, even with a clear line of sight, is not really useful when it comes to estimating the expected error. The reported distance measurement and standard deviation vary for various reasons, including small movements of the hand-held smartphone. Note, however, that the variation in reported distance is of the order of a meter, which presumably is very much larger than the actual motion of the hand-held phone. Some combinations of intiator and responder have relatively high fluctuations when in a fixed position, yet do not have much larger errors in real-world measurement than others.

  2. Since the noise is not Gaussian, one may benefit from plotting cumulative distribution functions.
    Sample CDFs — for a particular combination of initiator and responder — when the responder was 1 m (red), 2 m (green), and 3 m (blue) from the initiator. The reported distance measurement is offset by an average of about 1.5 m in this case. Note how the 10% to 90% rise in the CDF is very different for the three distances: 0.37 m, 0.26 m, and 0.50 m respectively (The “rounded stair-case” shapes again hint at some form of quantization).

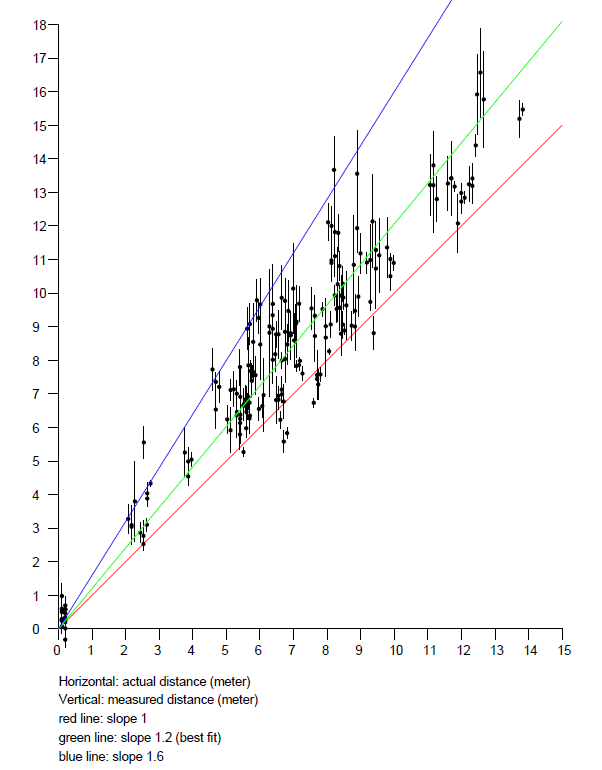
    Finally, it is important to note that the error in distance measurement does not equal the accuracy of position determination. This is because of “dilution of precision” which depends on the geometric arrangement of responders with respect to the intiator. Here an accuracy of two meters is more common (ignoring the occasional complete outlier). See also Where to place the responders and Recovering position from distance measurements

  3. When there is a clear line of sight (and a clear first Fresnel zone), the reported distance measurement, while affected by an offset that can be calibrated out, is linear with slope 1, with respect to actual distance.
    Typical outdoor measurements, away from obstacles, refractors and reflectors. Actual distance on horizontal axis (meters). FTM RTT distance measurement on vertical axis (meters). Slope m and offset c (in mm) of best linear fit shown (Note some significant fluctuations in measurements - vertical bars).

  4. This, of course, is not the typical indoor situation, where signals from and to some responders will go through walls and floors. These not only attenuate the signal (which does not affect the time of flight), but introduce large phase shifts. Brick and concrete, for example, have relative permittivities (ε) very roughly in the range of 4 to 16 at WiFi frequencies (depending on material mix, void, water content and age). This means that signals may take 2 to 4 times as long to travel through a wall as they would travelling the same distance in air! (which will add somewhere between the thickness of the wall and three times the thickness of the wall to the measured distance). Also, if the direct line of sight (LOS) is blocked, the measured signal may be one that has been reflected. In either case, the distance measurement may be significantly larger than the actual Euclidean distance (while rarely being less ☺).
    On the left, sample indoor results from a (wooden) multi-story home. Actual distance on horizontal axis (meters). RTT measurement on vertical axis (meters). Green line is best linear fit, with a slope of 1.2 — indicating a 20% overestimation of indoor distance on average in this particular case. Note the wide spread of reported RTT measurements for a given actual distance.

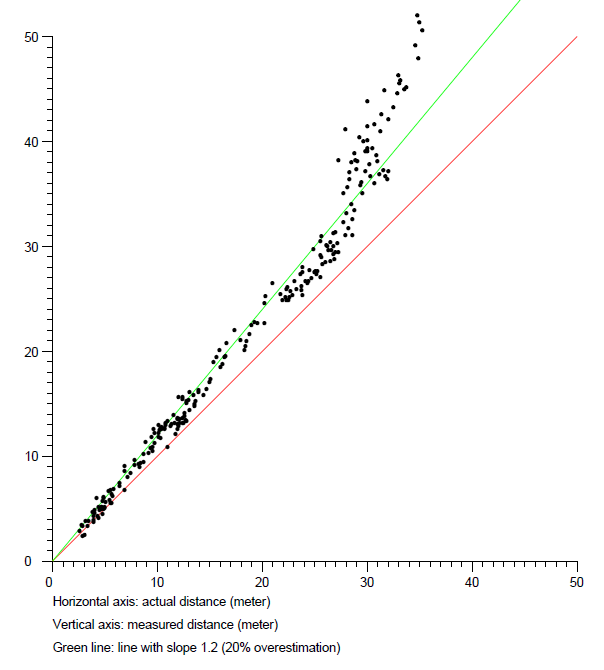
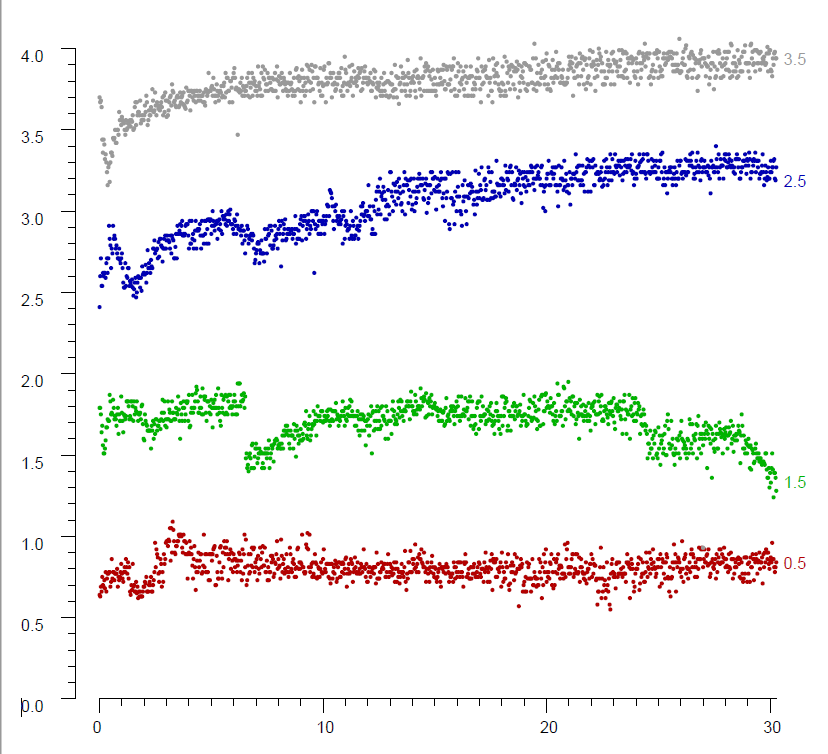
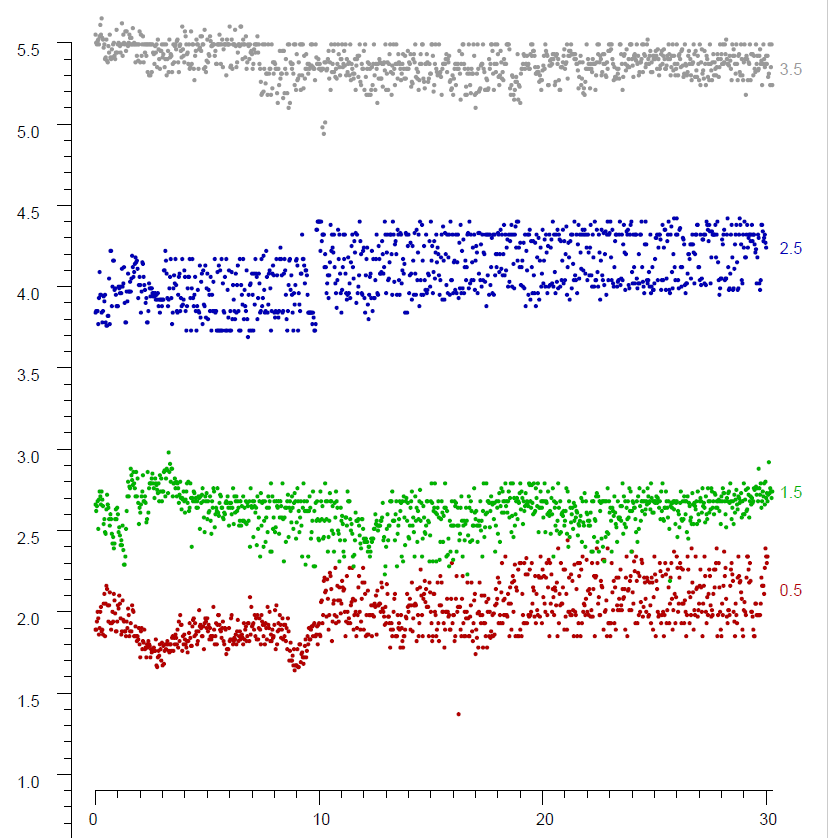
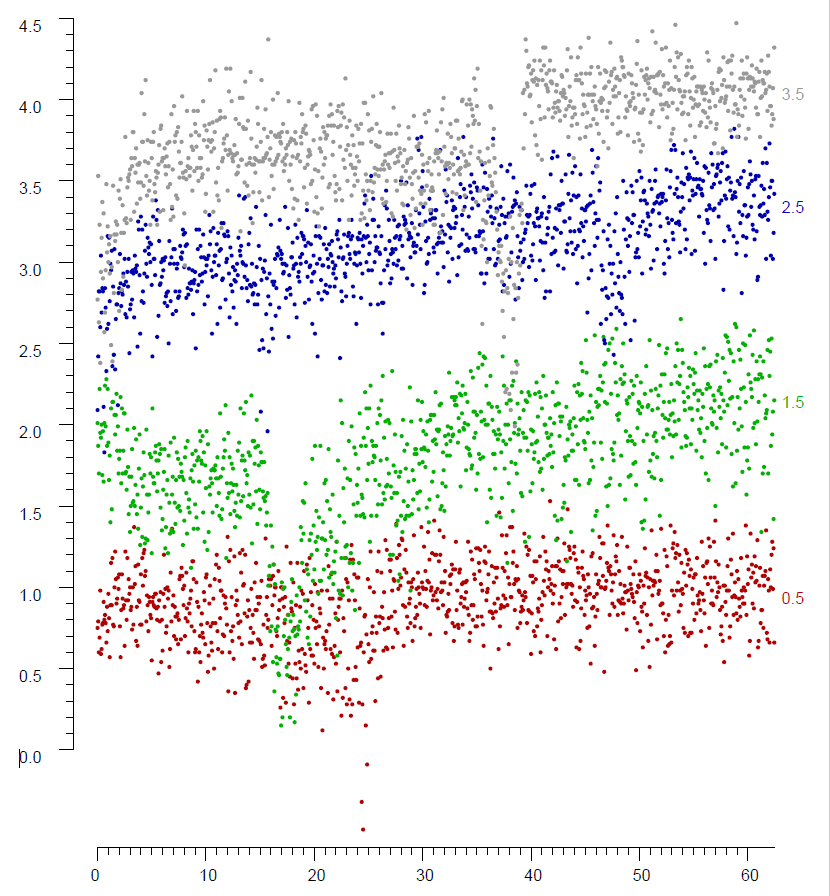
    On the right, sample results from a relatively open office environment (cubicle layout, single level). Averages over 10 RTT bursts (of 7 measurements each) are shown. Here the line of sight (LOS) is maintained over much larger distances than in the typical home. Note that measurements are biased (generally equal to or greater than the actual distance) and get less reliable with distance.

    It may be helpful to note that the RTT measurement is not “distance” per se, but a quantity obtained by multiplying the round trip time (RTT) by the speed of light (and dividing by two). The round trip time in turn is proportional to the integral of the square root of the relative permittivity (ε) along the signal path. So the “distance” measurement reported is the distance between an initiator and a responder that would have resulted in the same round trip time, had there been a clear line of sight between them – in air.

    Why is the measurement so inaccurate even with a clear line of sight?

    Actually, the real questions is “Why is the measurement so accurate”! (*):

    At 80 MHz RF bandwidth (the highest currently supported in all but one or two AP models), the signal is sampled by an analog-to-digital converter (ADC) 80 million times per second (actually both I and Q channels are sampled, for a total of 160 million samples per second, but that doesn't affect the argument here). That means that the ADC samples every 12.5 nano-seconds. If distance were determined simply by which sample had the very beginning of the preamble symbols, then the expected accuracy would be 3.75 meter in round trip distance, or 1.875 meter one way. The device actually produces results with finer resolution than that because of the use of some form of interpolation or “super-resolution” that provides sub-sample resolution in time. These heuristic methods each have their own foibles, but it is hard to say more since the method used in a particular WiFi chip is information that the user does not have access to.


Click here to go back to main article on FTM RTT.
Berthold K.P. Horn, bkph@ai.mit.edu

Accessibility