
grapheps
| Download | Current Version | Released | Terms |
|---|---|---|---|
| graph-eps | 1.15 | 2011-10-12 | Free |
|
| http://people.csail.mit.edu/jaffer/Docupage/grapheps | |||||||
grapheps | ||||||||
|
Why another graphing program? From web searches it appears that hundreds of graphing programs have been written. They run the gamut from FORTRAN, C, or Java function libraries to special purpose languages to interactive applications. It is possible that an adequate free software graphing program has already been written and runs in Linux; but I didn't find it.
This describes a graphing library written in PostScript. Why PostScript?
PostScript is a stack-oriented reverse Polish notation language. This means that literals and return values are pushed on top of the stack; arguments to functions are popped from the top of the stack.
Here is a simple definition:
/myvar 3 defThe name myvar is pushed onto the stack. On top of it is pushed 3. The def operator pops these and makes an association so that when myvar is read, its value (3) is pushed onto the stack.
The vector datatype can be constructed using [ and ]. Those elements pushed onto the stack between [ and ] become the elements of the vector.
Most PostScript-generating programs output a prologue defining 10 or 20 graphics primitives named by one or two letter names; then output polylines in the raster coordinate system. The results are not human readable and limit the precision; magnifying part of the graph does not convey any more information.
Instead we write the raw data as a two dimensional array, a vector of vectors:
  /Data
  [
   [0.3050	9.2	0.05	0.0000	9.5	0.05	0.0000]
   [0.3100	40.8	0.25	0.0003	42.3	0.26	0.0003]
   [0.3150	103.9	0.77	0.0008	107.8	0.80	0.0008]
   [0.3200	174.4	1.64	0.0017	181.0	1.70	0.0017]
   [0.3250	237.9	2.83	0.0029	246.9	2.94	0.0029]
   [0.3300	381.0	4.74	0.0049	395.4	4.92	0.0049]
   [0.3350	376.0	6.62	0.0069	390.2	6.87	0.0069]
   [0.3400	419.5	8.71	0.0090	435.4	9.04	0.0090]
   [0.3450	423.0	10.83	0.0112	439.0	11.24	0.0112]
   [0.3500	466.2	14.33	0.0149	483.8	14.87	0.0149]
   ] def
Four other variables are defined to control graph characteristics: fontsize is height of text characters in points, 1/72 inch; 0.353.mm. glyphsize is the diameter of scatter-plot glyphs. The margin-templates are strings whose displayed width is used to reserve space for the left and right side numerical legends.
  /fontsize 12 def
  /glyphsize 6 def
  /lmargin-template (-.0123456789) def
  /rmargin-template (-.0123456789) def
PostScript commands are written directly to control other rendering features.
The procedures below are documented in the style of the PostScript Language Reference Manual, second edition with (stack) arguments on the left and results on the right of the procedure name in boldface.
A range is a vector of two numbers, the minimum and maximum values of some dataset.
setup-plot. Includes plotrect,
legends, etc.
Each glyph and plot style is encoded by a "gproc", a vector containing 3 procedures [preamble render postamble].
Here are the gprocs provided:
| line | Draws lines between the points. |
|---|---|
| impulse | Draw line from the x axis to each point. |
| bargraph | Draw rectangle from x axis to each point. |
| barfill | Draw filled rectangle from x axis to each point. |
| point | Minimal point -- invisible if linewidth is 0. |
| disk | Solid round dot. |
| circle | Hollow circle. |
| square | Square box. |
| diamond | Square box at 45.o. |
| plus | Plus Sign. |
| cross | X Sign. |
| triup | Triangle pointing up |
| tridown | Triangle pointing down |
| pentagon | 5-sided polygon. |
plot-text-column is like plot-column, but renders text at the specified locations.
Plots text in t-column of array at x coordinate in x-column of array and y coordinate y-column of array. The symbol proc3s specifies the offset of the text from the specified coordinates.
The offsets available are:
above
center
below
left
right
All the offsets other than center are calculated to keep the
text clear of a glyph drawn at the same coordinates. If you need
more or less clearance, use set-glyphsize.
PostScript maintains a separate stack for graphics state.
The current color affects text, lines, and region fills.
fontsize
so that font-dependent sizing scales correctly. Change
fontsize thus:
/fontsize 12 def
/fontname fontsize selectfont
Helvetica is grapheps' default:
Times             Helvetica	         Courier
Times-Italic	  Helvetica-Oblique    	 Courier-Oblique
Times-Bold	  Helvetica-Bold	 Courier-Bold
Times-BoldItalic  Helvetica-BoldOblique	 Courier-BoldOblique
Symbol
To change font to Courier:
/Courier fontsize selectfont
Line parameters do no affect fonts; they do effect glyphs.
In grapheps, a rectangle is a vector of length 4; the first two elements are the x and y coordinates of lower left corner of the rectangle. The other two elements are the width and height of the rectangle.
gpop (with previous gpush)
to undo the effects of clip-to-rect.
String literals in PostScript are delimited by parentheses, eg.
(this is a string literal)
setup-plot). They are intended to pass as the
xcoord argumnet to rule-vertical.
setup-plot). They are intended to pass as the
ycoord argumnet to rule-horizontal.
The first line of a graphing file must be:
%!PS-Adobe-3.0 EPSF-3.0The second line declares the lower left and upper right coordinates of the bounding box of the page. Some programs treat these coordinates as being 72 dots per inch.
%%BoundingBox: 0 0 750 500Other meta-information fields you might like to generate are:
  %%Title: Solar Irradiance
  %%Creator: agj@alum.mit.edu
  %%For: A lark
  %%CreationDate: Fri Nov 14 17:55:30 2003
After any other meta-information fields goes:
%%EndCommentsThe contents of graph-eps should then be copied to the file.
After this the data arrays should be written:
  /Data
  [
   [0.3050	9.2	0.05	0.0000	9.5	0.05	0.0000]
   [0.3100	40.8	0.25	0.0003	42.3	0.26	0.0003]
   ...
  ] def
Then the graph drawing program should be written, followed by:
  grestore
  end
  showpage
The previous section detailed the structure of a grapheps file. Any programming language with the ability to write text to a file can thus create graphs. I have written a package for the SLIB Scheme library which does so. An example of its use is the Scheme code:
(let ((xrange '(.25 2.5)))
(create-postscript-graph
"solarad.eps" '(600 300)
(whole-page)
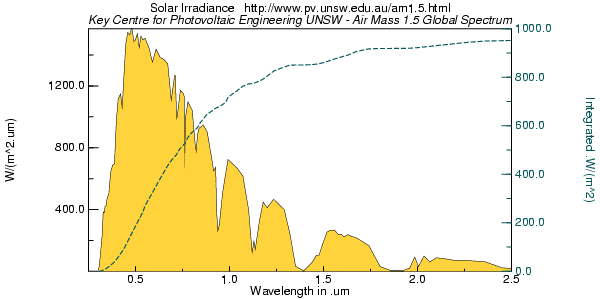
(setup-plot xrange (column-range irradiance 1))
(title-top "Solar Irradiance http://www.pv.unsw.edu.au/am1.5.html")
(in-graphic-context
(set-font "Helvetica-Oblique" 12)
(title-top
""
"Key Centre for Photovoltaic Engineering UNSW - Air Mass 1.5 Global Spectrum"))
(outline-rect plotrect)
(rule-vertical leftedge "W/(m^2.um)" 10)
(in-graphic-context (clip-to-rect plotrect)
(plot-column irradiance 0 1 'line)
(set-color "Bright Sun")
(plot-column irradiance 0 1 'mountain)
)
(rule-horizontal bottomedge "Wavelength in .um" 5)
(set-color 'seagreen)
(setup-plot xrange '(0 1000) graphrect)
(in-graphic-context (clip-to-rect plotrect)
(set-linedash 5 2)
(plot-column irradiance 0 2 'line))
(rule-vertical rightedge "Integrated .W/(m^2)" -10)))
Which produces this graph:
By generating this PostScript code:
/scm:G23
[
 [	305.0e-3	9.2	50.0e-3	0.0	9.5	50.0e-3	0.0]
 [	310.0e-3	40.8	250.0e-3	299.99999999999997e-6	42.3	260.0e-3	299.99999999999997e-6]
 [	315.0e-3	103.9	770.0e-3	800.0e-6	107.8	800.0e-3	800.0e-6]
...
 [	3.573	11.5	959.33	995.6e-3	11.9	995.61	995.6e-3]
 [	3.765	9.4	961.54	997.9e-3	9.8	997.91	997.9e-3]
 [	4.045	7.2	963.66	1.0	7.5	1.0e3	1.0]
] def
whole-page
[ 250.0e-3 2.5 ] scm:G23 1 column-range setup-plot
(Solar Irradiance   http://www.pv.unsw.edu.au/am1.5.html) () title-top
gpush
/fontsize 12 def /Helvetica-Oblique fontsize selectfont
() (Key Centre for Photovoltaic Engineering UNSW - Air Mass 1.5 Global Spectrum) title-top
gpop
plotrect outline-rect
leftedge (W/(m^2.um)) 10 rule-vertical
gpush
plotrect clip-to-rect
[ scm:G23 0 1 ] line plot-column
.995 .827 .235 setrgbcolor
[ scm:G23 0 1 ] mountain plot-column
gpop
bottomedge (Wavelength in .um) 5 rule-horizontal
.035 .345 .349 setrgbcolor
graphrect [ 250.0e-3 2.5 ] [ 0 1000 ] setup-plot
gpush
plotrect clip-to-rect
[ 5 2 ] 0 setdash
[ scm:G23 0 2 ] line plot-column
gpop
rightedge (Integrated .W/(m^2)) -10 rule-vertical

grestore
end
showpage
|
I am a guest and not a member of the MIT Computer Science and Artificial Intelligence Laboratory.
My actions and comments do not reflect in any way on MIT. | ||
| Docupage | ||
| agj @ alum.mit.edu | Go Figure! | |