UT COUSUB
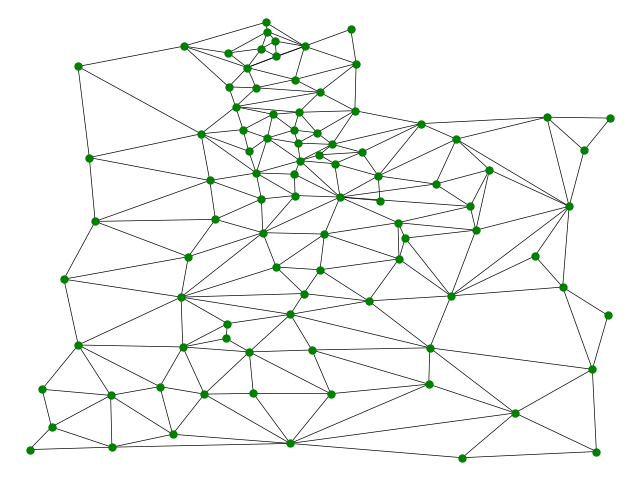
This is the dual graph of UT cousub units as reported by the US census in 2010. The underlying geographic data was downloaded from the census website and processed using GerryChain and maup. Each node in the graph represents one unit and there is an edge between two units if they share a positive length boundary. Population values are aggregated up from census blocks and geographic measurements are taken directly from the census shapefiles.
Link
You can download a .json file for this graph here.
Network Statistics
| Nodes | 93 |
| Edges | 244 |
| Number of Components | 1 |
| LCC Nodes | 93 (100.0%) |
| LCC Edges | 244 (100.0%) |
| Triangles | 149 |
| Transitivity | 0.3833619210977702 |
| Bridges | 0 |
| Leaves | 0 |
| Assortativity | -0.07421024284008193 |