
FreeSnell: Optical Coherence
- Refractive Index Spectra.
- All-Dielectric Optics
- Metal Films
- Granular Metal Films
- Optical Coherence
- Polyethylene
|
http://people.csail.mit.edu/jaffer/FreeSnell/coherence.html |
FreeSnell: Optical Coherence | |
|
FreeSnell is a program to compute optical properties of multilayer thin-film coatings.
This validation suite is from "coherence.scm", part of the FreeSnell package. "coherence.log" is the text generated by running coherence.scm:
scm -l coherence.scm > coherence.log
Suppose we have a 14.um thick sheet of high-density polyethylene with air on both sides. If the wavelength we want to pass is around 11.um (vertical arrow), then this plastic film will pass it with little attenuation.
The vacillations between transmissions of 0.8 and 1.0 are caused by destructive and constructive interference between the incident and reflective waves at the HDPE surfaces.
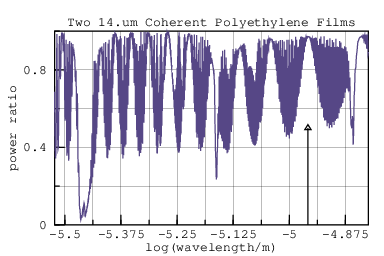
But a thin single sheet of plastic also conducts heat well. One way to reduce heat conduction is to use multiple glazings (sheets) separated by air.
Now there is interference across the enclosed air space which, by virtue of its greater thickness, has 50 times more peaks and troughs than the HDPE intererence.
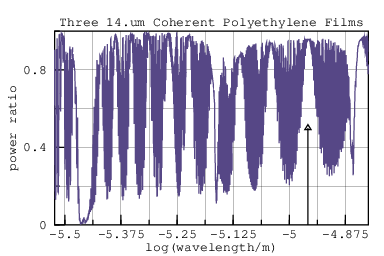
When we add a third glazing the troughs become quite deep, making this
analysis suspect; or at least difficult to interpret. The peak and
valley wavelengths of the narrow bands are extremely sensitive to
changes in the distance between sheets, such as could be caused by
temperature changes, vibration, or small changes in incident angle.
When dealing with layers less than a few wavelengths thick, the interference model holds true. Changes in angle of a few degrees change transmitted and reflect ratios by small amounts. Such is a coherent system.
But with millimeter layer thicknesses a one degree change can jump several short-wavelength peaks. The reflections are no longer strongly correlated with the incident light; they are incoherent.
Whereas coherent systems are modeled by the electric field intensities whose complex values add and subtract as interference; incoherent light intensities add as quantities of (electrical) power. A calculation analogous to FreeSnell's matrix method will suffice: The 2-by-2 matrices set up are the same as for the coherent case except that the square of the magnitude of each matrix element replaces that matrix element.
The incoherent designation applies to an individual layer. FreeSnell segregates the stack into coherent substacks separated by incoherent layers. Each substack is solved and the resulting matrices are used as the reflection matrices in the incoherent stack.
![]()
If we make all layers incoherent, then the graph will lack any ripples. That would be incorrect; each glazing this thin does add ripple. We assign incoherence to only the spaces between the glazings. In the single glazing case there is no difference from the coherent case.
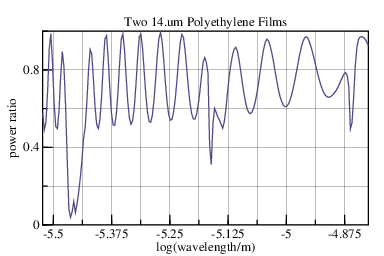
The transmission for two coherent glazings with an incoherent airspace between them is shown to the right. The ripples are twice as deep as for one glazing.
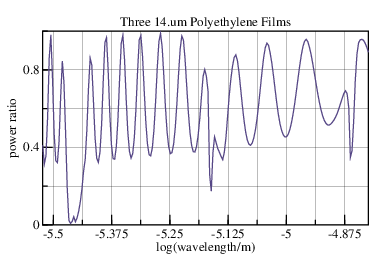
The transmission for three coherent glazings with two incoherent airspaces between them is shown to the right. The ripples are thrice as deep as for one glazing.
A 50.um sheet having uniform 1.54 IR would produce the following curve:
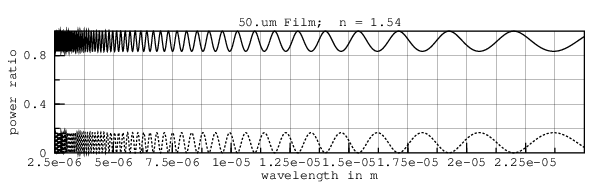
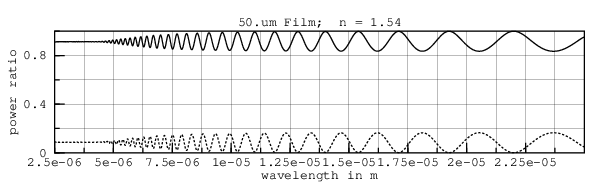
Because of the incoherence effects discussed earlier, and because of the finite apertures of spectrographs, at short wavelengths the wiggles average out. Adding (smooth 0.05e-6) computes the convolution of the spectrum with the Gaussian filter having a sigma of 0.05.um, as was done in the section Matching Measured Data.
Smoothing is much easier to apply in the wavenumber (and eV) domain because the interference ripples are evenly spaced:
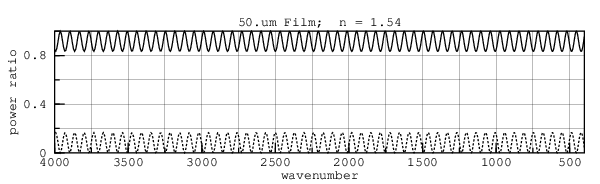
Wavenumbers and electron-Volts also have the desirable property that each increment in value corresponds to a proportional increment in photon energy.
In an analysis for SimRoof, Infrared Scattering by Water Clouds models clouds:
Clouds have mean droplet sizes ranging from 6 μm to 14 μm, with the largest sizes occurring "over remote tropical oceans"[53], and the smaller sizes occurring over land, particularly over polluted areas. Infrared scattering in the infrared atmospheric window between 8 μm and 14 μm by water droplets is particularly important to address.
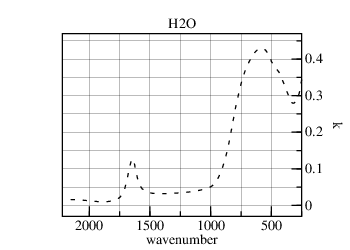
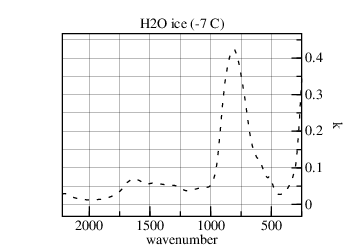
First consider small droplets. The refractive-indexes of water and ice have significant k>0 through their thermal ranges (4.5 μm to 40 μm):
Waves which are larger than droplets will induce electric dipoles in those droplets. This, and the droplets comprising a low volume fraction of clouds, indicates that Maxwell Garnett Theory should apply. The transmission through a 250 m thick cloud holding 1 g/m3 of water in small droplets is nearly null [a wavenumber scale is used for the abscissa so that equal areas represent equal energies]:
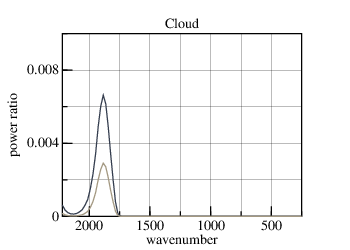
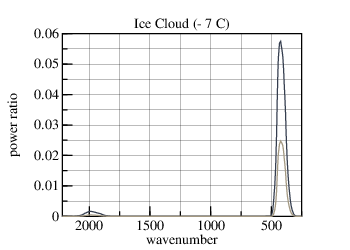
1 g/m3 of water (ice, on right) in a 250 m thick cloud corresponds to 0.25 mm of precipitable-moisture, a nearly unnoticeable amount if it fell as rain. The transmission through this equivalent 0.25 mm film of water (ice) is the lighter trace in the graph. [The refractive index of ice varies with temperature; but only at wavelengths longer than those of interest.]
Imagine breaking this 0.25 mm=250 μm film into 250 μm diameter droplets distributed uniformly-randomly in a 250 m thick cloud. This cloud has the same precipitable-moisture as the earlier hypothesized cloud, but in much larger droplets. In the process of scattering infrared light, the droplets will have roughly the same attenuation as the 0.25 mm film. Smaller droplets, such as those occuring in clouds, should have transmission between the two curves, both of which are negligible.
The change in direction of infrared photons by scattering affords opportunities for more scattering and hence even more attenuation.
Because of water's and ice's positive k, scattering by droplets absorbs infrared radiation, making water and ice clouds effective blackbodies for thermal radiation.
The next chapter attempts to deduce the spectral refractive index of polyethylene from published graphs of transmission.
|
I am a guest and not a member of the MIT Computer Science and Artificial Intelligence Laboratory.
My actions and comments do not reflect in any way on MIT. | ||
| FreeSnell | ||
| agj @ alum.mit.edu | Go Figure! | |