
|
| http://people.csail.mit.edu/jaffer/SimRoof/Weather |
SimRoof: Weather |
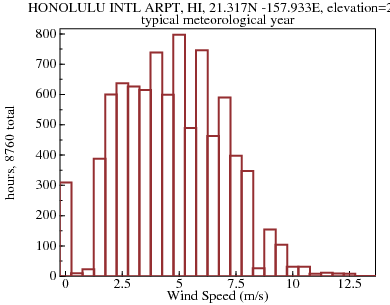
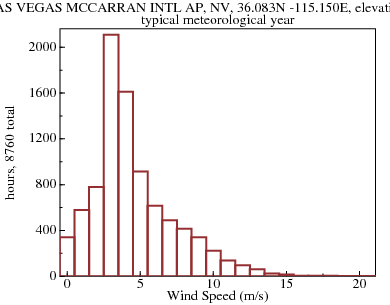
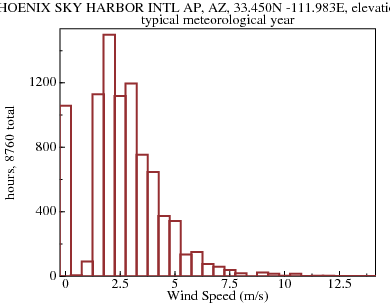
Here are the distributions of wind-speeds in representative locations:
| Honolulu, HI | Las Vegas, NV |
|---|---|
|
|
| Phoenix, AZ | |
|
Wind velocity is a function of height. The TMY3 documentation doesn't specify the height of the measuring instrument. The convention at airports (which many TMY3 stations are) seems to be 10 m. The Automated Surface Observing System (ASOS) User's Guide states:
Before ASOS, airport wind sensors were generally exposed 20 feet above ground level. With modern, high- performance aircraft, this standard no longer applies. Now, current federal standards for siting meteorological equipment specify (with some variance permitted) a height of 10 meters (32.8 feet). Typical ASOS wind sensor heights are 33 feet or 27 feet, depending on local site-specific restrictions or requirements.
http://en.wikipedia.org/wiki/Wind_gradient#Wind_turbines gives a formula for wind-speed at any height:
vw(h) = v10 ⋅ (h/h10)a
where:
The a value they list for "Neutral air above human inhabited areas" is 0.34.
For a roof at 3 m, vw = 0.664 v10
ASHRAE Fundamentals Handbooks 1997[28] and 2009[70] give the formula:
| UH = Umet ( | δmet
Hmet |
)amet ( | H δ |
)a |
| anemometer site | ||
|---|---|---|
| Umet | anemometer wind speed | |
| Hmet | height of anemometer | 10 m |
| amet | exponent (Table 16.1 zone 3) | 0.14 |
| δmet | layer thickness (Table 16.1 zone 3) | 270 m |
| roof site | ||
| UH | wind speed at height H | |
| H | height | 3 m |
| a | exponent (Table 16.1 zone 2) | 0.22 |
| δ | layer thickness (Table 16.1 zone 2) | 370 m |
At the indicated values, UH = 0.55 Umet
TMY3 has three quantities dealing with clouds:
Ceiling means the height above the earth's surface of the lowest layer of clouds or obscuring phenomena that is reported as “broken”, “overcast”, or “obscuration”, and not classified as “thin” or “partial”.So the cloud base which ceiling-height refers to is for opaque clouds (opaque-sky-cover). According to Wikipedia:
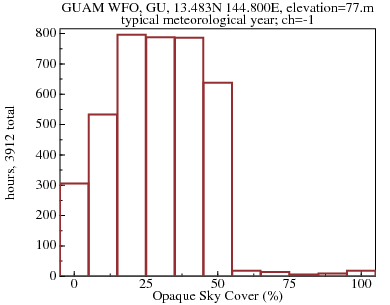
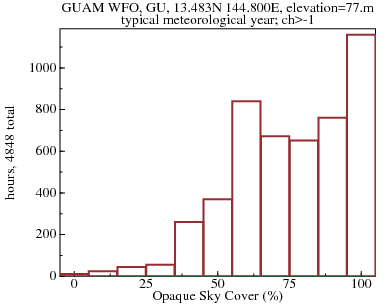
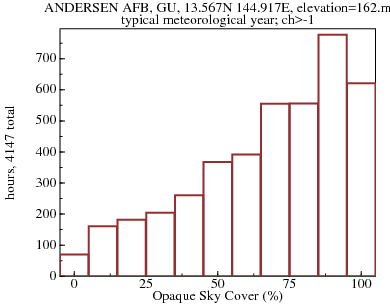
A ceiling listed as "unlimited" means that the sky is clear or is free of any substantial cloud cover.One might reasonably expect that unlimited ceiling-height occurs only when the opaque-sky-cover is 0%. But that isn't the case with the tropical TMY3s. The Guam TMY3s have unlimited-ceiling-height 45% and 53% of the time. The histograms of opaque-sky-cover occuring with unlimited-ceiling show that over 90% of the unlimited-ceiling hours have non-zero opaque-sky-cover! The potential simulated radiative transfer error for an overcast sky (100% OSC) is more serious than for a 10% opaque-sky-cover. To reflect this, The TMY3-loader calculates the "Ceiling-Unlimited Opaque Sky Coverage" hours (and percentage), which is 13% and 20% for the Guam TMY3s.
    912120TYA.CSV: GUAM WFO, GU, 13.483N 144.800E, elevation=77.m
	 Description:                     Data range (res):    Source flags:
      hr Time                             1 to 24 h
     ghi Global Horizontal Irradiance     0 to 1019 W.h/m^2    1:100%
     dni Direct Normal Irradiance         0 to 940 W.h/m^2     1:100%
     dhi Diffuse Horizontal Irradiance    0 to 627 W.h/m^2     1:100%
     tsc Total Sky Cover                  0 to 100 % (10)      A:88% B:1% E:11%
     osc Opaque Sky Cover                 0 to 100 % (10)      A:80% B:1% E:19%
     dbt Dry Bulb Temperature          21.7 to 32.8 oC (5/9)   A:93% B:7%
     dpt Dew Point Temperature            0 to 26.7 oC (5/9)   A:93% B:3% E:4%
      ap Atmospheric Pressure         95800 to 103200 Pa (100) A:93% B:7%
      ws Wind Speed                       0 to 38.6 m/s (0.1)  A:93% B:3% E:4%
      ch Ceiling Height                   0 to 21238 m         A:51% B:2% E:2% -45%
      pw Precipitable Water              24 to 63 mm           E:100%
    Ceiling-Unlimited Opaque Sky Coverage Hours: 1133.8 (13%)
| Histogram of Opaque Sky Cover with Unlimited Ceiling | Histogram of Opaque Sky Cover with Ceiling |
|---|---|
| 
|
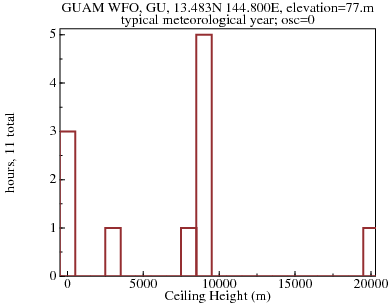
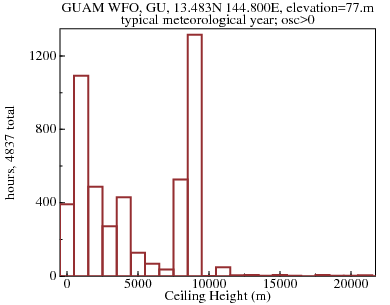
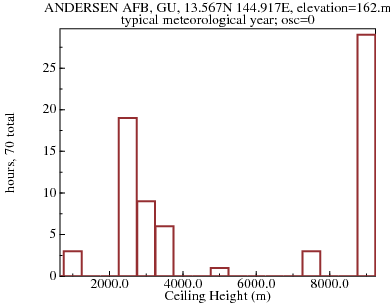
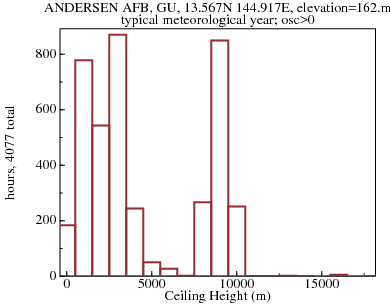
| Histogram of Ceiling Height with no Clouds | Histogram of Ceiling Height with Clouds |
| 
|
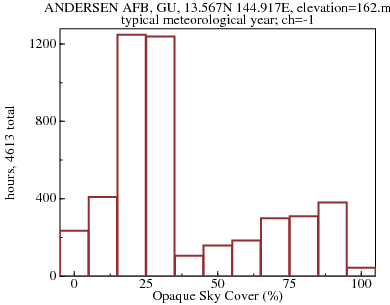
    912180TYA.CSV: ANDERSEN AFB, GU, 13.567N 144.917E, elevation=162.m
	 Description:                     Data range (res):    Source flags:
      hr Time                             1 to 24 h
     ghi Global Horizontal Irradiance     0 to 1023 W.h/m^2    1:100%
     dni Direct Normal Irradiance         0 to 950 W.h/m^2     1:100%
     dhi Diffuse Horizontal Irradiance    0 to 647 W.h/m^2     1:100%
     tsc Total Sky Cover                 20 to 100 % (10)      A:100% B:0% E:0%
     osc Opaque Sky Cover                 0 to 100 % (10)      B:0% E:100%
     dbt Dry Bulb Temperature          21.1 to 31.7 oC (5/9)   A:100% B:0% E:0%
     dpt Dew Point Temperature         14.4 to 27.2 oC (5/9)   A:100% B:0% E:0%
      ap Atmospheric Pressure         97600 to 99900 Pa (100)  A:99% B:1% E:0%
      ws Wind Speed                       0 to 23.1 m/s (0.1)  A:100% B:0% E:0%
      ch Ceiling Height                  90 to 17667 m         A:47% B:0% E:0% -53%
      pw Precipitable Water              25 to 65 mm           E:100%
    Ceiling-Unlimited Opaque Sky Coverage Hours: 1738.9 (20%)
| Histogram of Opaque Sky Cover with Unlimited Ceiling | Histogram of Opaque Sky Cover with Ceiling |
|---|---|
| 
|
| Histogram of Ceiling Height with no Clouds | Histogram of Ceiling Height with Clouds |
| 
|
The SimRoof strategy is to combine the clouded and cloudless downward thermal radiations according to the "opaque sky cover" ratio.
3. Vertical distribution of moisture
The fact that [in the monthly average] precipitable water can be well estimated from surface dew point indicates that moisture in the atmosphere has some sort of a uniform lapse rate, that the average rate of decrease through a deep layer tends toward some constant.
 Reitan uses a (decreasing) exponential to model moisture as a function
of altitude. Comparing Reitan's function with saturation
vapor-pressure
(CIMO) at a
uniform lapse-rate of 6.5 K/km shows that it is a reasonable
approximation.
Reitan uses a (decreasing) exponential to model moisture as a function
of altitude. Comparing Reitan's function with saturation
vapor-pressure
(CIMO) at a
uniform lapse-rate of 6.5 K/km shows that it is a reasonable
approximation.
But Reitan also writes "Beta [=0.44/km] is the average rate of decrease through a deep layer, and is not a constant with height." so the moisture profile is exponential only in the average.
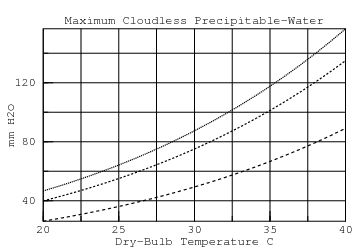 High humidity with cloudless skies turns out to constrain the moisture
profile significantly. If the
environmental-lapse-rate
is larger than the adiabatic-lapse-rate, then clouds will tend to
form. So we can estimate the maximum cloudless precipitable-water at
a given sea-level ambient temperature by integrating the
partial-pressure of water-vapor through the lapse-rate. Shown are the
maximum water load for lapse-rates of 5.5 K/km (top),
6.5 K/km, and 10 K/km. The dry adiabatic lapse-rate,
10 K/km, is the largest; lapse-rates larger than this are
unconditionally unstable. At 30°C, the maximum water load for a
constant lapse-rate of 10 K/km is 50 mm H2O, a water load which
certainly occurs in the tropics. This supports the claim that
humidity is exponentially decreasing through the troposphere.
High humidity with cloudless skies turns out to constrain the moisture
profile significantly. If the
environmental-lapse-rate
is larger than the adiabatic-lapse-rate, then clouds will tend to
form. So we can estimate the maximum cloudless precipitable-water at
a given sea-level ambient temperature by integrating the
partial-pressure of water-vapor through the lapse-rate. Shown are the
maximum water load for lapse-rates of 5.5 K/km (top),
6.5 K/km, and 10 K/km. The dry adiabatic lapse-rate,
10 K/km, is the largest; lapse-rates larger than this are
unconditionally unstable. At 30°C, the maximum water load for a
constant lapse-rate of 10 K/km is 50 mm H2O, a water load which
certainly occurs in the tropics. This supports the claim that
humidity is exponentially decreasing through the troposphere.
SimRoof calculates the downward thermal infrared radiation from the
cloudless portion of the sky, modeling the troposphere as having a
linearly decreasing temperature from the ground to the tropopause,
with water-vapor and dry-air pressure decreasing exponentially, scaled
so that the total amount of water-vapor equals the TMY3 precipitable
moisture [See troposphere.pdf].
The Infrared Scattering by Water Clouds section establishes that water clouds are effectively blackbody radiators. So SimRoof models the downward thermal infrared raditation from the cloudy portion of the sky as it does the clear sky from the ground up to the ceiling-height. That precipitable moisture which hasn't already been accounted for in the clear-sky integral is treated as a thin blackbody layer at the ceiling-height and at the ceiling-height temperature (determined from the ambient temperature and lapse-rate).
What to do when the ceiling-height is unlimited? A large fraction of the simulated hours (45%) have unlimited ceiling-height. Trying to infer a ceiling height seems risky because only 19% of the limited ceiling-height data is not interpolated or estimated. The most pessimistic approach would be a ceiling-height of 0 m, which is fog. Assuming a ceiling-height of 1 km is still pessimistic (as to how much radiative cooling would occur), but doesn't have the station in fog 45% of the time.
The dataset is decimated by wavelength. Its 2299263 lines span 2.99999905 μm to 39.9997864 μm. The spacing between adjacent wavelengths grows with wavelength. It turns out that the difference between the wavenumbers averages 0.001341 cm-1, which is 166.3 neV or 40.21 MHz. This makes sense because these measures are proportional to energy, and energy is quantized. ATRAN samples the spectrum at a resolution fine enough to separate all the absorption lines, but not finer. So the wavelength coordinates can be eliminated from the dataset, being derived from the index k:
| λ(k)= | 0.01
n(k) | where |
n(k) = n0 − k · ninc n0 = 0.01÷2.99999905×10⁻⁶ nl = 0.01÷39.9997864×10⁻⁶ ninc = (n0−nl)÷2299262 |
Evaluating radiative-transfer over the range of sky angles at over two million wavelengths (of transparency data) is very time-consuming. Looking at the curves for blackbody radiation from 290 K to 310 K, one can see that radiation outside of the 2000 cm-1 to 100 cm-1 band will contribute vanishingly little to net radiative cooling.
| Precipitable H2O | Radiated Power | bracket excluding 2 W/m2 |
|---|---|---|
| 0 mm | 391 W/m2 | 2134.84 cm-1 - 360.11 cm-1 |
| 10 mm | 321 W/m2 | 2117.22 cm-1 - 360.11 cm-1 |
| 20 mm | 300 W/m2 | 2103.53 cm-1 - 360.11 cm-1 |
| 30 mm | 286 W/m2 | 2089.04 cm-1 - 360.11 cm-1 |
| 40 mm | 275 W/m2 | 2071.30 cm-1 - 360.11 cm-1 |
| 50 mm | 266 W/m2 | 2052.05 cm-1 - 360.11 cm-1 |
| 60 mm | 258 W/m2 | 2031.08 cm-1 - 360.11 cm-1 |
| 70 mm | 250 W/m2 | 1979.69 cm-1 - 360.11 cm-1 |
As the humidity increases, the lower threshold moves upward and the outer bands contribute less and less to net radiative cooling. Note that these integrals overestimate the radiated power. Because the airmass through which most of the rays (in the hemisphere) pass is greater than at the zenith, the effective atmospheric-transparency will be less, further marginalizing the outer bands.
Restricting the atmospheric-transparency array to the 10 mm preciptable-water bracket reduces its size by 43% with a negligible effect on accuracy. The binary file holding the 1312123 values is 10496984 B in length. The wavenumber function of indexes of the reduced dataset is:
| wn(k) = n(k + 905029) |
Copyright © 2010 Aubrey Jaffer
|
I am a guest and not a member of the MIT Computer Science and Artificial Intelligence Laboratory.
My actions and comments do not reflect in any way on MIT. | ||
| SimRoof | ||
| agj @ alum.mit.edu | Go Figure! | |